Genetic Variability Analysis of Agro-Morphological Traits
among Bread Wheat (Triticum aestivum L.)
Genotypes at Raya Valley of Southern Tigray, Ethiopia
1Girma Degife*; 2Wassu Mohammed; 3Kebebew Assefa
1 Ethiopian Institute of Agricultural
Research, Mehoni Agricultural Research Centre, P.O.
Box 47, Mehoni, Ethiopia
2Haramaya University, P.O. Box 138, Haramaya, Ethiopia
3 Ethiopian Institute
of Agricultural Research, Debre-Zeit Agricultural
Research Centre, Debre-Zeit, Ethiopia
|
ARTICLE INFO
|
ABSTRACT
|
|
Article No.: 090219165
Type: Research
DOI: 10.15580/GJAS.2019.4.090219165
|
Assessment of genetic
variability in crop species is one of the major activities of plant breeding
which helps to design breeding methods and/or selection of genotypes for
further evaluation to meet the diversified goals. Therefore, this field
experiment was conducted to assess the genetic variability in bread wheat
genotypes. The field evaluation of 32 genotypes and 4 released varieties was
conducted in 6 x 6 Triple Lattice Design at Mehoni
Agricultural Research Station in 2017 cropping season. Results of analysis
of variance revealed the presence of significant differences among genotypes
for 12 quantitative traits. The variation observed among genotypes for grain
yield ranged from 2.80 to 5.33 t ha-1. The four genotypes
(QAFZAH-2/FERRIUG-2, KAUZ'S'/FLORKWA1//GOUMRIA-3, ETBW5957and SERI
82/SHUHA'S'//PASTOR-2 had yield advantage of 7.58 to 12.21% over the high
yielding check variety, GAMBO (4.75 t ha-1). Phenotypic (PCV) and genotypic
(GCV) coefficient of variations ranged from 5.67 (plant height) to 14.74
(fertile tiller per plot) and 7.06 (days to maturity) to 19.08% (fertile
tiller per plot), respectively. Heritability (H2) in broad sense and genetic
advance as percent of mean (GAM) ranged between
41.46 (biomass yield) and 89.08 (days to heading) and 8.56 (plant height)
and 24.09% (harvest index), respectively. High H2 estimates coupled with
moderate or high GAM for plant height, days to heading, days to maturity,
spike length, grain yield, spikelets per spike and
harvest index suggested the higher chance of improving these traits through
selection of genotypes for high mean performance.
|
|
Submitted: 02/09/2019
Accepted: 22/09/2019
Published: 01/11/2019
|
|
*Corresponding Author
Girma Degife
E-mail: girmadegife12@ gmail.com
|
|
Keywords: Heritability; Genotypic Coefficient of Variations; Genetic Advance
|
|
|
|
1.
INTRODUCTION
Bread wheat (Triticum aestivum L.) is a hexaploid
species with (2n=6x=42) having AABBDD with A, B and D genomes) (Sleper and Poehlman, 2006). It is
one of one of the oldest domesticated grain crops for 8000 years which native to Middle East. It has been the basic staple food of
many regions of the world, while it is grown under both irrigated and rain-fed
conditions. It belongs to family Poaceae (formerly Graminae) (Yadawad et al., 2015). World wheat production in
2017 was 743.2 million tons with average yield (3.34 t ha-1)
and it accounts for nearly 30% of global cereal (FAO, 2017). The hexaploid bread wheat accounts for 95% of the total wheat
production; most of the remaining 5% is from tetraploid
durum wheat (T. turgidum
subsp. durum, 2n=4x=28, AABB) (Shewry, 2009).
In Ethiopia, wheat is one of the major staple and strategic
food security crops, and accounts for approximately 11% of the national calorie
intake. Ethiopia is the second largest wheat producer in sub-Saharan Africa
after South Africa. It is cultivated on 1.7 million hectares of land and has
the production of 4.54 million tons with remain low productivity of 2.67 t ha-1
(CSA, 2017) in the country as compared to the world average yield (3.34 t ha-1)
(FAO, 2017).
Wheat is producing in Tigray
regions which relatively lager as compared to other crop of the area. The total
wheat area and production in Tigray region was 107,724.17
hectares and 212,867.26 tons with the average yield of 1.98 t ha-1. Wheat
stands second both in area and production among all crops followed by barely
and tef. In
the southern zone, the area coverage and
productivity of wheat was 49,189.20 ha and 1,019,11.14 tons with the average
yield of 2.072 t ha-1 respectively which is lower than from national
(CSA, 2017).
Genetic improvement to develop varieties with high yield
potential and resistance/tolerance to abiotic and biotic stresses, with
acceptable end-use quality, is the most viable and environment-friendly option
to sustainably increase wheat yield. Selection for grain yield improvement can
only be effective if sufficient genetic variability is present in the genetic
material (Ali et al., 2008). Therefore, knowledge of genetic variability
present in a given crop species for the character under improvement is of
paramount importance for the success of any plant breeding program (Bisne, 2009). Variability is the occurrence of differences
among individuals due to differences in their genetic composition and/or the
environment in which they are raised (Allard, 1960; Falconer and Mackay, 1996).
In order to bring the heritable improvements in economic characters through
selection and breeding, estimation of genetic parameters must be made before
starting a program. There are different techniques available to compute the
genetic parameters and the index of transmissibility of characters (Waqar- Ul-Haq et al., 2008).
The existence of variation alone in the population is not
sufficient to improve desirable characters. High heritability is also needed to
have better opportunity to select directly for the traits of interest. This is
mainly because of the opportunity associated with high heritability incorrect
identification and measurement of the genotypes based on phenotypic values and
in avoiding errors in genotypic classification (Welsh, 1981). In breeding
programs, selection is an integral part by which genotypes with high
productivity in a given environment could be developed. However, selection for
high yield is difficult because yield is the end product of components of
several characteristics, polygenic inheritance, and highly influenced by
environment and genotype x environment interaction.
In the Southern Zone of Tigray
Regional State, at mid and highland areas, some genetic variability studies in
wheat genotypes have been made to develop varieties (Adhiena
et al., 2016). Raya Valley is the
part of Southern Zone of Tigray Regional State;
however, neither genetic variability studies in wheat genotypes nor
introduction of improved wheat varieties were attempted. This is due to the insufficient
rain fall to support the growth and yield production of wheat in the area and
the largest part of the valley is at low altitude ( 1600 m.a.s.l.)
experiencing warm to hot weather conditions. But, the dependence on rainfall
alone in the area has in recent years been gradually replaced by supplemental
irrigation and irrigated crop production. The number of farmers and investors
using irrigation and supplemental irrigation is increasing. However, the
absence of recommended varieties for the area remains as one of the major wheat
production constraints in the area. Therefore, it is necessary to undertake
research to develop wheat varieties for which genetic variability study is the
first step. Thus, the present research was undertaken with the following
objectives:-
1600 m.a.s.l.)
experiencing warm to hot weather conditions. But, the dependence on rainfall
alone in the area has in recent years been gradually replaced by supplemental
irrigation and irrigated crop production. The number of farmers and investors
using irrigation and supplemental irrigation is increasing. However, the
absence of recommended varieties for the area remains as one of the major wheat
production constraints in the area. Therefore, it is necessary to undertake
research to develop wheat varieties for which genetic variability study is the
first step. Thus, the present research was undertaken with the following
objectives:-
·
To
assess genetic variability in selected bread wheat genotypes
3.
MATERIALS AND METHODS
3.1. Description of the Experimental Area
The study
was carried at the research
station of Mehoni Agricultural Research Center (MhARC) under
supplemental irrigation in the 2017 main cropping season. Mehoni is located
in Raya Valley in the northern parts of Ethiopia about 668 km from county’s
capital city of Addis Ababa, and about 120 km South of
Mekelle, the capital city of Tigray
regional state, Northern Ethiopia. Geographically, the experimental site is
located at 12° 41'50'' N latitude and 39° 42'08'' E longitude with an altitude
of 1578 m.a.s.l. The site receives mean annual
rainfall of 750 mm with an average minimum and maximum temperature of 22 °C and
32 °C, respectively. The soil type and textural class of the experimental area
is verty soil and clay loam respectively with pH of 7.9-8.1
(Haileslassie et
al., 2015).
When there
was cessation of rainfall during the execution of the experiment, the crop was
affected by moisture stress. During this time supplementary irrigate was
provided using ground water resource to compensate the amount of water needed
by the crop and also to provide the essential moisture for normal growth. This
practice helps in alleviating the adverse effects of unfavorable rain patterns
and improves crop yields. Therefore, amount of irrigation water to supplement to
each experimental plot was directed using drip irrigation which was installed
in the experimental site, and the amount of water was
measured using soil squeezed method to test soil moisture manually by hand and
the irrigating started from booting stage at 55 days after sowing.
A total of
36 bread wheat genotypes including four standard checks (Table.1) obtained from
the National Wheat Research Program specifically from Werer
(WARC) and Kulumsa (KARC) Agricultural Research
Centers. The genotypes were selected based on adaptation to low moisture stress
and classified under lowland types. In this experiment, four released for
moisture stress bread wheat varieties were included as standard checks
.
Table
1.List and pedigree of
the thirty six bread wheat genotypes including four released varieties
|
G*
|
Genotype (Pedigree)
|
Origin
|
|
G1
|
HUBARA-3*2/SHUHA-4
|
CIMMYT/ICARDA
|
|
G2
|
Atila-7
|
CIMMYT/ICARDA
|
|
G3
|
ETBW5535
|
EIAR/KARC
|
|
G4
|
ETBW5957
|
EIAR/KARC
|
|
G5
|
ATILA/AWSEQ-4
|
CIMMYT/ICARDA
|
|
G6
|
FENTALLE (CHECK)
|
CIMMYT/ICARDA
|
|
G7
|
ADEL-2
|
CIMMYT/ICARDA
|
|
G8
|
DAJAJ-1//VEE'S'/SAKER'S'
|
CIMMYT/ICARDA
|
|
G9
|
PASTOR-2/HUBARA-5
|
CIMMYT/ICARDA
|
|
G10
|
HIDDAB/ATTILA-7
|
CIMMYT/ICARDA
|
|
G11
|
PASTOR-2/HUBARA-3
|
CIMMYT/ICARDA
|
|
G12
|
HUBARA-5/ANGI-1
|
CIMMYT/ICARDA
|
|
G13
|
GAMBO (CHECK)
|
CIMMYT/ICARDA
|
|
G14
|
ANGI-2/HUBARA-3
|
CIMMYT/ICARDA
|
|
G15
|
ETBW 5898 (SETII C1)
|
EIAR/KARC
|
|
G16
|
QAFZAH-2/FERRIUG-2 (SET II C1)
|
CIMMYT/ICARDA
|
|
G17
|
TAGANA
|
CIMMYT/ICARDA
|
|
G18
|
JNRB.5/PIFED
|
CIMMYT/ICARDA
|
|
G19
|
KINGBIRD (CHECK)
|
EIAR/KARC
|
|
G20
|
OGOLCHO (CHECK)
|
EIAR/KARC
|
|
G21
|
ETBW5955 SET II C2)
|
EIAR/KARC
|
|
G22
|
REYNA-28
|
CIMMYT/ICARDA
|
|
G23
|
ETBW5963(SET II C3)
|
EIAR/KARC
|
|
G24
|
PRINIA-1//NESMA*2/14-/3/DUCULA
|
CIMMYT/ICARDA
|
|
G25
|
FRANCOLIN #1/BAJ #1
|
CMSS09B00490S-099M-099Y-2WGY-0B
|
|
G26
|
KAUZ'S'/FLORKWA1//GOUMRIA-3
|
CIMMYT/ICARDA
|
|
G27
|
BJY/COC//PRL/BOW/3/BLOYKA-1
|
CIMMYT/ICARDA
|
|
G28
|
KUBSA
|
CIMMYT/ICARDA
|
|
G29
|
PBW343*2/KUKUNA//KIRITATI
|
CIMMYT/ICARDA
|
|
G30
|
HUBARA-2/QAFZAH-21//DOVIN-2
|
CIMMYT/ICARDA
|
|
G31
|
INQALAB 91*2/TUKURU//WHEAR
|
CIMMYT/ICARDA
|
|
G32
|
ATILA*2//CHIL/BUC*2/3KUKUNA
|
CIMMYT/ICARDA
|
|
G33
|
SERI 82/SHUHA'S'//PASTOR-2 (SET I)
|
CIMMYT/ICARDA
|
|
G34
|
florkwa2/6/saker's'/5/rbs /anza/3/kvz/hys/ymh/tob
/4/bow
|
CIMMYT/ICARDA
|
|
G35
|
katila17/deek2/8vee's'/7/cebeco148/3/ron/cha//nor67/5/hk/38m
|
CIMMYT/ICARDA
|
|
G36
|
attila 50y//attila/bcn/3/star*3/ musk-3
|
CIMMYT/ICARDA
|
Source:
G*= genotype code number used in the thesis.
Table
2. Analysis of variance in triple lattice design and
expected mean square
|
Source
of variation
|
DF
|
Sum of squares (SS)
|
Mean square
MS=
|
Computed
F
|
Expected
mean squares
|
|
Replication
|
r – 1
|
SSR
|
MSR
|
 
|

|
|
Treatment
(unadj.)
|
k2 – 1
|
SST (unadj.)
|
MST (unadj.)
|
|
σ2 ( ) m
σt2 ) m
σt2
|
|
Blocks
within replication (adj.)
|
r(k-1)
|
SSB
(adj.)
|
MSB (adj.)
|

|

|
|
Intra block
error
|
(k-1)(rk-k-1)
|
SSE
|
MSE
|
|

|
|
RCB
Error
|
(t-1) (r-1)
|
SSe
|
MSe
|
|
s2e
|
|
Total
|
rk2 – 1
|
SSTO
|
|
|
|
r =
Number of replications. k2
= Number of treatments, k =
Number of plots in a block, SS =
Sum square, MS = Mean square, s2 =
Variance, t = Number of genotypes,
MSE = Mean squares for error and s2e= Error variance.
Relative efficience= according to (Gomez
and Gomez (1984).
according to (Gomez
and Gomez (1984).
The characters that exhibited significant mean squares in
general ANOVA were further subjected to genetic analyses. Phenotypic and
genotypic variance and coefficient of variation, heritability, and genetic
advance were computed using the Excel Microsoft Program. Genetic diversity was
estimated from quantitative traits of genotypes using Euclidean distance computed
by Statistical Software.
3.6.2.
Phenotypic and genotypic variability
The
phenotypic and genotypic variability of each quantitative trait were estimated
as phenotypic and genotypic variances and coefficients of variation. The
phenotypic and genotypic coefficients of variation were computed using the
formula suggested by Burton and de Vane (1953) as follows.
Genotypic variance (σ2g) 
Where, σ2g = genotypic variance, Msg=
mean square of genotype, Mse = mean square
of error, r = number of replications
Phenotypic
Variance (σ2p) = σ2g + σ2e
Where,
σ2g = Genotypic variance, σ2e = Environmental variance in which Environmental variance =
mean square of error and
σ2p
= phenotypic variance


Where: PCV= Phenotypic coefficient of variation, GCV=
Genotypic coefficient of variation
= population mean of the character
being evaluated
PCV and
GCV values were categorized as low, moderate, and high values as indicated by Sivasubramaniah and Menon (1973)
as follow. > 0 -
10% = Low, > 10 – 20% = Moderate; and > 20% = High
Broad
sense heritability values were estimated using the formula adopted from
Falconer and Mackay (1996).
H2 =
(σ2g/σ2p) x 100
Where, H2 = heritability in broad sense
σ2p = phenotypic
variance
σ2g = Genotypic variance
The heritability percentage was categorized
as low, moderate and high as suggested by Robinson et al. (1955) as
follows:-
> 0 - 30% = Low, > 30 – 60% = Moderate;
and > 60% = High
Expected
genetic advance under selection (GA)
Genetic
advance in absolute unit (GA) and as percent of the mean (GAM), assuming
selection of superior 5% of the genotypes were estimated in accordance with the
methods illustrated by Johnson et al. (1955) as:
GA
= K * SDp * H2;
Where,
GA = Genetic advance, SDp = Phenotypic standard
deviation on mean basis, H2 = Heritability in the broad sense and K =
the standardized selection differential at 5% selection intensity (K = 2.063).
Genetic
advance as percent of mean (GAM)
Genetic
advance as percent of mean was estimated as follows:
GAM =  X100
X100
Where, GAM = Genetic advance as percent of mean, GA =
Genetic advance

The GA as percent of mean was categorized as
low, moderate and high as suggested by Johnson et al. (1955) as follows. 0 - 10% = Low, 10 – 20% = Moderate, and >20%
= High
4.
RESULTS AND DISCUSSION
The
analyses of variance (Table 3) showed highly significant differences (P 0.01) among
wheat genotypes for all studied traits. Such considerable range of variations
would provide a good opportunity for yield improvement. The results also
justifies carrying out further genetic analysis by considering all (12) agro-morphology traits. Adhiena et al. (2016) conducted genetic
variability study in 26 bread wheat genotypes considering twelve traits in Southern Zone of Tigray Regional State, at mid and
highland areas. They reported the presence of significant differences among genotypes for all traits except for plant height and number of spikelets per plant. Many
authors also revealed highly significant differences among all the wheat
genotypes for all the characters (Mohammed
et al., 2011; Dergicho et al.,
2015; Gezahegn et al., 2015). However, days to
maturity, number of tillers per plant, biological yield and harvest index were
not significantly different in durum wheat genotypes (Dawit
et al., 2012). This disparity may be
due to the differences in the genotypes and test environments used in the
different studies.
0.01) among
wheat genotypes for all studied traits. Such considerable range of variations
would provide a good opportunity for yield improvement. The results also
justifies carrying out further genetic analysis by considering all (12) agro-morphology traits. Adhiena et al. (2016) conducted genetic
variability study in 26 bread wheat genotypes considering twelve traits in Southern Zone of Tigray Regional State, at mid and
highland areas. They reported the presence of significant differences among genotypes for all traits except for plant height and number of spikelets per plant. Many
authors also revealed highly significant differences among all the wheat
genotypes for all the characters (Mohammed
et al., 2011; Dergicho et al.,
2015; Gezahegn et al., 2015). However, days to
maturity, number of tillers per plant, biological yield and harvest index were
not significantly different in durum wheat genotypes (Dawit
et al., 2012). This disparity may be
due to the differences in the genotypes and test environments used in the
different studies.
The
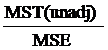
relative efficiency of triple lattice design was greater than one for more than
half quantitative traits but it was greater than 0.95 for all quantitative
traits indicating
triple lattice design is advantage as over RCBD in increasing in experimental
precision (Table 3). Masood et al. (2008) and Idrees
and Khan, (2009) reported alpha lattices design were on the average more
efficient in reducing the experimental error and hence provide the efficient
estimation of treatment contrasts. Thus,
the present analysis were done by using triple lattice
design. Coefficients of variation in percent were also used to compare the
precision of the experimentation i.e. means with lower CV% for most of the
characters revealed the reliability of the data collected from the experiment
(Gomez and Gomez, 1984).
Table
3. Mean
squares from analysis of variance for twelve traits of thirty six bread wheat
genotypes evaluated at Mehoni in 2017
|
Traits
|
Replications(d.f =2)
|
Block Within replication (Adj.)(df=15)
|
Treatments (d.f=35)
|
Intra block Error
(d.f=55)
|
RCBD
Error
|
Rel. to effic.
(%)
|
CV (%)
|
|
(Unadj)
|
(Adj)
|
|
Plant height (cm)
|
1293.51**
|
20.43**
|
94.92
|
91.22**
|
17.49
|
18.12
|
100.51
|
4.88
|
|
Days to heading
|
7.06**
|
4.82**
|
142.80
|
122.83**
|
4.04
|
4.21
|
100.64
|
2.80
|
|
Grain filling period (days)
|
2.26ns
|
5.71**
|
28.04
|
27.50**
|
6.12
|
6.08
|
98.39
|
8.59
|
|
Days to maturity
|
1.69ns
|
9.04**
|
157.00
|
132.74**
|
8.13
|
8.32
|
100.24
|
2.84
|
|
No. of fertile tillers/plant
|
0.11ns
|
0.07ns
|
0.50
|
0.38**
|
0.09
|
0.08
|
95.67
|
13.53
|
|
Spike length (cm)
|
0.14ns
|
0.24ns
|
2.70
|
2.17**
|
0.25
|
0.25
|
98.89
|
5.28
|
|
No. of spikelets/spike
|
0.22ns
|
0.98ns
|
7.31
|
6.48**
|
1.21
|
1.16
|
95.92
|
5.98
|
|
No. of kernels/ spike
|
15.53**
|
17.32**
|
65.39
|
56.24**
|
12.22
|
13.31
|
102.49
|
7.54
|
|
1000-kernel weight (g)
|
3.77ns
|
12.70**
|
58.66
|
53.33**
|
12.99
|
12.93
|
99.51
|
10.07
|
|
Grain yield (t/ha)
|
0.14ns
|
0.09ns
|
1.13
|
0.96**
|
0.12
|
0.12
|
94.46
|
8.38
|
|
Biomass yield (t/ha)
|
0.04ns
|
0.08ns
|
0.25
|
0.25**
|
0.10
|
0.09
|
95.31
|
10.26
|
|
Harvest index (%)
|
2.09ns
|
7.83**
|
82.19
|
74.19**
|
6.91
|
7.11
|
100.33
|
7.60
|
Note, ** and *
indicates highly significant at (1%) and significant at (5%) probability
levels, respectively. DF= degree freedom
Rel.effic. = relative
efficiency, RCBD=completely randomized design, CV= coefficient of variations and adj. and uadj. =
adjusted or unadjusted treatment
4.2. Mean
Performance of Genotypes
The genotypes variation for days to heading, grain filling period and
days to maturity ranged from 58 to 81, 21 to 33 and 89 to 115, respectively. The mean performances of genotypes for plant height and number of
fertile tillers per plot ranged from 74 to 97, and 1.4 to 2.9, respectively (Table
4). Adhiena et al. (2016)
reported a wide range of variations among 26 bread wheat genotypes for days to heading ranged from 49.3 to 63 days with a mean of
56.9 days and days to maturity ranged from 102.7 to 129.7 days with a mean
value of 114 days. Alemu et al. (2016) also
reported wide range of variation between 48 and 66, and 97 and 108 for days to
heading and days to maturity, respectively, among 30 bread wheat genotypes.
One (G1), three (G3) and two (G2) genotypes had mean performances lower
than the earliest standard check (Kingbird) for days to heading, grain filling
period and days to maturity, respectively (Table 4). None of new entry
genotypes showed superiority over highest performing check (Gambo)
for plant height while four genotypes had mean number of fertile tillers per
plot greater than the highest performing check variety (Fentalle).
Three (G3) and five (G5) genotypes were shorter than the check with shortest
plant height among check varieties and low number of fertile tillers per plot,
respectively. Among 36 genotypes, 47.22% exhibited days to heading lower than
the genotypes mean indicating those genotypes were early heading as compared to
the others (Table 4). Grain filling is also an important trait that ultimately
affects the overall grain yield by increasing grain weight. The results in agreement with the
findings of Mollasadeghi et al. (2012) in
which days to heading and days to maturity showing similar parallelism to each
other. However, some authors also reported non-significant differences among
bread wheat genotypes for days to maturity and number of fertile tillers (Khan,
2013). This result suggested that the higher chance of selecting early genotypes
which can escape the terminal moisture stress which is one of the wheat
production problems in the study area. In this study, the genotypes with early
heading also showed early maturity and late maturing ones exhibited
correspondingly late days to heading. The differences of different
authors report for the performance of bread wheat genotypes for maturity, plant
height and number of fertile tillers for varied number of bread wheat genotypes
might be due to the differences in the genetic factors carried by the genotypes
included in each experiment, growing seasons and environments where the
genotypes evaluated. The early maturity, plant height and number fertile
tillers were reported as a function of both genetic and environmental factors (Berhanu, 2004; Obsa, 2014; Alemu et al.,
2016).
Traits like, the number of grains per spike is an important plant
attribute that depends upon spike length, spikelets
per spike and spike density. Accordingly, the wide genotypes variation for
spike length, spikelets per spike, number of kernels
per spike and thousand-kernel weight ranged from 7.6 cm to 11.4 cm, 15 to 22,
35 to 59, and 27g to 44g, within an average value of 9.46, 18.38, 46.10 and 35.79
respectively (Table 4). Similarly, Maqbool et al.,
(2010) reported wide range of variation for plant height, grain filling
period, number of spikelets per spike, biological
yield, grain yield and thousand-kernel weight. The mean performances of
genotypes for biomass yield (plot-kg) and harvest index were ranged
from 2.1 to 3.5 and 21.9-42.1% respectively. Current modern wheat varieties
have harvest index (HI) of c. 0.45-0.50 (spring type) and 0.50-0.55 (winter
type), approaching its theoretical maximum value (c. 0.64 in winter wheat) (Foulkes et al., 2011; Reynolds et al., 2012).
This wide ranges of mean values these traits depicted that bread wheat germplasm possess good amount of genetic variability.
Three genotypes; viz ATILA*2//CHIL/BUC*2/3KUKUNA,
ETBW5535 and ETBW5963 (SET II C3) genotypes
with longer spike length than the check (Gambo), the
longest spike length among check varieties. High number of kernels per spike was recorded for genotypes 6 and 9
respectively than the standard check (Gambo) (Table 4).
Eight, twenty nine and thirty three entry genotypes showed superior for spikelets per spike than highest performing check (Gambo). Among 36 genotypes, 25% of the genotypes showed highest
thousand-kernel weight than the highest performing check (Ogolcho)
variety. In the present result for thousand kernel weight, comparative result
with Obsa (2014) report for 1000-seed weight with
values ranging from 25 to 46.67 g with a mean value of 39.67g.
Grain yield per plant is also a
character of prime importance and of special interest to a wheat breeder.
Accordingly, highly significant variability was observed among genotypes for
grain yield t ha-1, which ranged from 2.9 to 5.3 with the mean value
of 4.18 t ha-1 and coefficient of variation of 8.38%. Depending on
the mean performances, genotypes such as QAFZAH-2/FERRIUG-2
(SET II C1), KAUZ'S'/FLORKWA1//GOUMRIA-3, SERI 82/SHUHA'S'//PASTOR-2 (SET I)
and ETBW5957HUBARA-3*2/SHUHA-4 had mean
performances higher than the highest performing check variety (Gambo=4.75 t ha-1) for grain yield (t ha-1)
with 5.33, 5.16, 5.15 and
5.11 while lower yielder were obtained from genotypes G30 (3.33 t ha-1),
G11 (2.98 t ha-1) and G8 (2.87 t ha-1) (Table 4). Generally,
the range of variation was wide for all the characters studied. Berhanu et al.
(2017) conducted genetic variability among 49 bread wheat genotypes at Axum,
Northern, Ethiopia and reported a wide range of grain yield from 2.37 to 5.44 t ha-1
with a mean of 3.95 t ha-1 and the maximum grain yield obtained was
5.44 t ha-1 and 5.37 t ha-1), 4.64 t ha-1) and
4.56 t ha-1 respectively. Gezahegn et
al. (2015) reported a wide variation of grain yield per hectare which
ranged from 2.11 to 5.95t ha-1 while Alemu
et al. (2016) also reported that 2.59
to 4.68 t ha-1 and 1.28 to 3.79 tones ha-1 at Kulumsa and Tongo site for bread
wheat in Ethiopia respectively. Regarding biomass yield, 25% of the genotypes were
greater than the highest biomass yielder check Gambo (13.08
t ha-1). These high yielding genotypes could be utilized in further breeding.
Table
4. Mean performance of thirty six bread wheat
genotypes evaluated at Mehoni in 2017
|
G*
|
HD
|
GFP
|
MD
|
PHT
|
FTPP
|
SL
|
SPS
|
KPS
|
TKW(g)
|
GY(t/ha)
|
BY(kg p)
|
Hi (%)
|
|
G1
|
70.00h-k
|
29.33ah
|
99.33g-j
|
82.88e-h
|
2.57a-d
|
9.21g-l
|
19.13b-f
|
46.53b-i
|
32.73g-m
|
4.75a-d
|
3.30a-c
|
36.35c-k
|
|
G2
|
78.67a-c
|
26.67dj
|
105.33c-f
|
85.34d-f
|
2.27d-i
|
10.55b-d
|
19.47b-d
|
49.60b-e
|
35.33c-l
|
3.83h-m
|
3.03a-c
|
31.85j-n
|
|
G3
|
73.33e-i
|
25.00gk
|
98.33g-k
|
94.23ab
|
2.07d-k
|
10.37a-c
|
19.27b-d
|
49.67b-e
|
30.87j-m
|
4.59b-g
|
3.00a-c
|
37.92a-g
|
|
G4
|
65.67lm
|
24.00i-j
|
89.67o
|
83.32d-h
|
2.60ac
|
8.90i-o
|
15.00k
|
39.73jk
|
42.13a-c
|
5.15ab
|
3.10a-d
|
41.53a-c
|
|
G5
|
78.00a-d
|
29.00a-h
|
107.00b-d
|
87.55b-f
|
1.90h-n
|
10.20c-f
|
18.67b-g
|
47.67b-g
|
29.20l-k
|
4.11e-j
|
3.20a-d
|
32.19h-n
|
|
G6
|
68.33k-l
|
29.67a-g
|
98.00g-l
|
94.87ab
|
2.67ab
|
10.06c-g
|
17.87c-h
|
48.90b-e
|
31.20j-m
|
4.26e-i
|
3.17a-d
|
33.66f-l
|
|
G7
|
71.00f-k
|
21.33k
|
92.33m-o
|
81.60e-h
|
2.9a
|
8.29m-q
|
15.17j
|
35.30k
|
38.33a-h
|
4.10e-j
|
2.70dc
|
38.51a-f
|
|
G8
|
80.67ab
|
33.00a
|
113.67a
|
83.97d-h
|
1.37n
|
10.20c-f
|
22.30a
|
58.43a
|
35.77b-k
|
2.87o
|
3.07a-d
|
23.40pq
|
|
G9
|
77.67ad
|
30.67a-f
|
108.33bc
|
90.12bd
|
2.67ab
|
8.81j-o
|
18.50b-g
|
52.93ab
|
33.53e-m
|
4.05f-j
|
3.20a-d
|
31.85h-n
|
|
G10
|
59.67po
|
29.67a-g
|
89.33o
|
74.34i
|
2.53a-e
|
7.55q
|
17.00f-k
|
40.97h-k
|
43.87a
|
4.71b-e
|
2.80b-d
|
42.10a
|
|
G11
|
81.11a
|
33.33a
|
114.67a
|
78.40g-i
|
1.60k-n
|
7.74pq
|
17.43e-i
|
40.07i-k
|
35.00d-l
|
2.98no
|
3.47a
|
21.85q
|
|
G12
|
71.00f-k
|
27.00c-j
|
98.00g-l
|
85.42d-f
|
2.47a-f
|
9.02h-m
|
18.73b-g
|
45.63d-j
|
38.40a-h
|
4.34c-g
|
2.93a-d
|
37.07a-h
|
|
G13
|
73.33e-i
|
24.67h-k
|
98.00g-l
|
97.43a
|
2.00e-l
|
10.72a-c
|
19.93bc
|
52.93ab
|
37.53b-j
|
4.75a-d
|
3.27a-d
|
36.35c-j
|
|
G14
|
69.67i-k
|
26.33e-j
|
95.00i-m
|
84.67d-h
|
2.07d-k
|
8.98h-n
|
19.13b-f
|
48.17b-g
|
32.07g-m
|
4.51c-g
|
3.00a-c
|
37.64a-g
|
|
G15
|
69.33i-l
|
23.67kj
|
93.00l-o
|
85.26df
|
2.50a-f
|
9.63e-j
|
17.80c-h
|
43.73d-j
|
39.87a-e
|
4.68b-f
|
3.00a-c
|
39.19a-e
|
|
G16
|
61.00n-p
|
30.67a-f
|
91.67m-o
|
89.75be
|
2.67ab
|
9.24g-k
|
15.80h-i
|
42.20g-j
|
42.60ab
|
5.33a
|
3.3ab
|
39.56a-e
|
|
G17
|
79.33ab
|
28.67a-h
|
108.00bc
|
93.38ac
|
2.27d-i
|
9.83d-h
|
19.40b-d
|
44.23d-j
|
35.33c-l
|
3.52j-m
|
3.43a
|
25.64o-k
|
|
G18
|
77.00be
|
31.67a-c
|
108.67bc
|
93.93ab
|
1.70j-n
|
8.95h-o
|
19.63bc
|
52.27bc
|
32.33g-m
|
4.25e-i
|
3.43a
|
30.94k-n
|
|
G19
|
58.33op
|
32.00ab
|
90.33no
|
74.55i
|
1.93g-l
|
8.20n-q
|
15.80ij
|
45.37d-j
|
37.00a-j
|
3.34m-o
|
2.13e
|
39.19a-e
|
|
G20
|
57.67p
|
32.67a
|
90.33no
|
84.23fh
|
2.57a-d
|
8.35l-q
|
16.00h-j
|
40.30h-j
|
38.80a-g
|
4.34e-i
|
2.67d
|
41.03a-b
|
|
G21
|
79.33ab
|
29.00a-h
|
108.33bc
|
87.87b-f
|
2.03d-l
|
11.07ab
|
18.97b-f
|
44.33d-j
|
41.13a-d
|
3.73i-m
|
3.17a-d
|
29.55m-o
|
|
G22
|
59.33op
|
32.67a
|
92.00m-o
|
77.35hi
|
2.50a-f
|
8.57k-p
|
16.70h-k
|
41.80g-j
|
33.50e-m
|
3.42l-o
|
2.73dc
|
31.94j-n
|
|
G23
|
63.33nm
|
30.67a-f
|
94.00j-o
|
86.12c-f
|
2.20d-i
|
9.54g-i
|
18.50b-g
|
43.13e-j
|
37.07a-j
|
4.50c-g
|
2.70dc
|
41.91ab
|
|
G24
|
62.00no
|
33.00a
|
95.00j-n
|
73.70i
|
2.53a-e
|
8.11o-q
|
17.07e-j
|
41.53g-j
|
38.80a-h
|
4.11e-j
|
2.87a-d
|
35.98d-k
|
|
G25
|
74.00d-h
|
26.33e-j
|
100.33f-i
|
85.65d-g
|
1.97g-l
|
10.18c-f
|
18.90b-f
|
49.50b-e
|
26.87m
|
4.25e-i
|
3.07a-d
|
34.54e-m
|
|
G26
|
71.67f-k
|
31.00a-e
|
102.67d-g
|
83.84d-h
|
2.37a-h
|
9.70d-i
|
19.20b-e
|
48.37b-f
|
37.53a-j
|
5.16ab
|
3.27a-d
|
39.47a-e
|
|
G27
|
70.67g-k
|
26.00f-j
|
96.67h-m
|
85.23df
|
2.10d-k
|
8.57k-p
|
18.60b-g
|
46.07c-j
|
31.60i-m
|
4.74a-e
|
3.23a-d
|
36.59b-j
|
|
G28
|
77.67a-d
|
27.67b-j
|
105.33c-f
|
89.57be
|
1.97g-l
|
10.45b-e
|
19.27b-d
|
52.57a-c
|
28.67m
|
4.40e-h
|
3.17a-d
|
35.06e-l
|
|
G29
|
81.00ab
|
30.00a-f
|
111.00ab
|
88.97b-f
|
1.60k-n
|
9.10h-l
|
20.40b
|
48.33b-f
|
41.40a-d
|
3.47k-n
|
3.43a
|
25.58o-q
|
|
G30
|
75.00cf
|
31.33a-d
|
106.33b-e
|
62.13eh
|
1.97g-l
|
9.08h-m
|
19.70bc
|
48.20b-f
|
40.40a-e
|
3.33m-o
|
2.97a-d
|
28.08n-p
|
|
G31
|
72.67fj
|
28.67a-h
|
101.67e-h
|
88.22bf
|
1.73i-n
|
10.20c-f
|
18.23b-g
|
43.50e-j
|
31.73g-m
|
3.51j-n
|
2.70dc
|
32.73g-n
|
|
G32
|
78.33ac
|
33.00a
|
111.33ab
|
89.07bf
|
1.43nm
|
11.38a
|
19.10b-f
|
43.93d-j
|
31.40i-m
|
4.11e-j
|
3.40ab
|
30.24l-o
|
|
G33
|
74.00dg
|
27.67b-j
|
101.67e-h
|
88.67bf
|
2.40a-h
|
10.27b-f
|
19.97bc
|
49.77b-e
|
39.67a-f
|
5.11a-c
|
3.27a-d
|
39.14a-e
|
|
G34
|
68.67jl
|
31.33a-d
|
100.00g-j
|
83.9dh
|
2.73ab
|
10.04c-g
|
18.83b-g
|
45.43d-j
|
40.00a-e
|
4.41d-g
|
3.07a-d
|
36.12d-k
|
|
G35
|
72.67fj
|
27.67b-j
|
100.33f-i
|
85.50
|
2.30c-h
|
9.41g-k
|
18.83b-g
|
46.73b-h
|
37.67a-j
|
4.02h-l
|
2.73dc
|
36.82a-i
|
|
G36
|
74.33dg
|
26.33e-j
|
100.67f-i
|
83.13dh
|
1.50n-l
|
9.54e-j
|
17.87c-h
|
50.37b-c
|
29.47l-m
|
3.85h-m
|
2.73dc
|
35.22e-l
|
Source: G* = genotype
code number used in the table, Mean values in column of each trait followed by
similar letter(s) had non-significant difference at P<0.05
TKW=Thousand-kernel weight, BY=biomass yield (kgplot-1), GY=grain
yield t ha-1, HI=Harvest index.
4.3.
Estimates of Variance Components
Genotypic
and phenotypic coefficients of variation are used to measure the variability
that exists in a given population. PCV and GCV values were categorized as low
(0 - 10%), moderate (10 - 20%) and high (> 20%) by Sivasubramaniah
and Menon (1973). Accordingly, the genotypes
coefficient of variation (GCV) ranged from 5.67% for the plant height to 14.74%
for number of fertile tillers plant-1, whereas the phenotypic
variation (PCV) ranged from 7.06% for days to maturity to 19.08% for number of
fertile tillers plant-1 (Table 5). In the present study, none of the
traits had high PCV and GCV values. Whereas traits with moderate PVC value were
number of kernels per spike, number of fertile tiller per plant, grain filling
period, thousand-kernel weight, grain yield, Biomass yield, and harvest index.
Considering the GCV estimates, number of fertile tillers per plant,
thousand-kernel weight, grain yield, and harvest index exhibited moderate
values. Moderate GCV coupled with moderate PCV was observed for number of
productive tillers per plant, thousand-kernel weight, grain yield and harvest
index, indicating the effectiveness of selection based on the phenotypic
performance of the genotypes. The studied characters that had low GCV values
were plant height, days to heading, grain filling period, days to maturity,
spike length, number of spikelets per spike, number
of kernels per spike and biomass yield while for PCV were plant height, days to
heading, days to maturity, spike length and number of spikelets
per spike, suggesting the difficulty in
hereditary genetic material of these traits through plant breeding.
Similar
observations showing moderate values for the phenotypic and genotypic
coefficients of variation in wheat were reported by Kolakar
et al. (2012), Mohammmed
et al. (2011) and Berhanu
et al. (2017) for grain yield,
biomass yield, plant height, peduncle length, number of productive tillers per
meter, spike length, number of spikelets per spike,
number of grains per spike and 1000-grain weight; with the indication that the genotype
could be reflected by the phenotype and the effectiveness of selection based on
the phenotypic performance for these characters. In contrary to the current
finding, Berhanu et
al. (2004) reported that higher GCV
and PCV values were observed for grain yield, thousand-kernel weight, harvest
index, tillers per plant, spikes per plant, spike length, kernels per spike and
grain protein yield while similar lowest GCV and PCV values (< 5 %) were
observed for days to maturity in bread wheat.
The
phenotypic coefficient of variation was relatively greater than the genotypic
coefficient of variation for all the traits; however, the magnitude of the
difference was small for all traits expect for number of fertile tillers. This
indicated narrow range of genotypic variability along with less influence of
environment for the expression of the traits, and the results revealing
moderate GCV and PCV indicate there is still some possibility for the improvement
the characters. Similar results depicting closer values of the PCV to the GCV
estimates for most characters thereby showing little environmental effect on
the expression of the characters were also reported by Dawit
et al. (2012) and Adhiena et al. (2016).
4.3.2.
Estimates of heritability and expected genetic advance
In the
present study, the broad sense heritability estimates ranged from 41.46% for
biomass yield to 89.08% for days to heading (Table 5). High heritability
(>60%) noticed for days to heading (89.08%) followed by days to maturity
(82.02%), grain yield (76.31%), harvest index (73.85%), spike length (72.83%),
and number of spikelets per spike (65.16). The obtained results were
also in accordance with results of Dergicho et al.
(2015) who reported high heritability was observed for studied characters
such as, days to heading, thousand-grain weight, grain filling period, days to
maturity, spike length, and number of spikelets per
spike in 68 bread wheat germplasm. The other authors
also reported similar results in which high heritability were recorded for
spike length, number of grain per spike and grain yield per plot in wheat were
reported (Ali et al., 2008; Kolakar at al., 2012; Desheva and Cholakov, 2014). But, the present finding was disagreement
with the result of Gezahegn et al. (2015) who were reported moderate and
low heritability values for harvest index,
grain yield per plot and biomass yield. Moderate heritability values were also recorded
for all the remaining of traits. This result suggests that selection could be
easy and improvement is possible using selection breeding for these traits. In
agreement with the current result, Berhanu et al.
(2017) reported moderate heritability for grain filling period, kernels per
spike, plant height, biomass, thousand-kernel weight in bread wheat genotypes.
The expected genetic advanced expressed as a
percentage of the mean varied between 8.56% for plant height and 24.09% for
harvest index (Table 5), indicating that selecting the top 5% of the base
population could result in an advance of 8.56% to 24.09% over the respective
population. Genetic advance as a percentage of the mean was high for harvest
index (24.09%) followed by number of tiller per plant (23.47%), and grain yield
(23.22%). Traits like spike length, number of spikelets
per spike, days to heading, days to maturity, grain filling period,
thousand-kernel weight, number of kernels per spike and biomass yield were
showed moderate genetic advance as percent of mean. It was also moderate for
days to heading (12.21%) and days to maturity (12.00%). This result implied
that the high and moderate values of these traits showed the traits were under
genetic controls which help for true selection for wheat breeding improvement.
This is because of high values of genetic advance are indicative of additive
gene action whereas low values are indicative of non-additive gene action
(Singh, 1993).
The estimate of genetic advance is more
useful as a selection tool when considered jointly with heritability estimates
(Johnson et al., 1955). Accordingly, high heritability coupled with high
genetic advance as percent of mean were also found for grain yield (76.31%,
23.22%) and harvest index (73.85%, 24.09%). Dergicho et al. (2015) reported similar findings for high heritability
associated with high genetic advance for grain yield per plot and harvest index
which supports the present findings. High heritability coupled with
moderate genetic advance as percent of mean were noticed for days to heading,
days to maturity, number of spikelets per spike and
spike length. Moderate heritability associated with high genetic advance was
observed for number of fertile tillers per plant, whereas moderate heritability
coupled with moderate genetic advance as percent of mean was observed for grain
filling period, number of kernels per spike, thousand-kernel weight and biomass
yield. These are simply inherited traits indicates that most likely the
heritability is due to additive gene effects. Therefore, these characters could
be useful criteria for selection and may be effective in early generations for
these traits. Mohammed et al. (2011) and Berhanu et al.
(2017) also reported similar results, showing relatively high estimates of
genetic advance (as percentage of mean) for grain yield and yield related
traits like number of fertile tiller per m2, plant height,
thousand-kernel weight, kernel number per spike and harvest index. Berhanu et
al. (2017) also reported similar findings as high heritability is coupled
with moderate genetic advance as percent of mean for days to heading and days
to maturity in bread wheat genotypes. This finding is in part similar with
those reported by Gezahegn et al. (2015). Rehman et al. (2015) report explained that
high heritability coupled with high genetic advance indicate
that there could be predominance of additive gene action and might not much
prejudiced by environmental fluctuations.
Contrasting
results as compared to the present
investigation, high heritability
associated with high genetic advance noticed for days to heading, grain filling
period, fertile productive tillers, spikelet per spike, spike length, kernel
per spike, thousand grain weight and biomass yield per plot respectively by Dergicho et al. (2015); for moderate
heritability coupled with high genetic advance observed for grain yield
(41.71%, 63.05%) whereas high heritability couple with moderate genetic advance
as percent of mean was observed for 1000 kernel weight (74.28%, 20.13%), and plant
height (69.43%, 10.27%) respectively (Gezahegn et al., 2015).
Table 5. Estimates for variability components for twelve
characters of thirty six bread wheat genotypes evaluated at Mehoni
in 2017
|
Trait
|
Range
|
Mean+ SE
|
PCV
(%)
|
GCV (%)
|
H2b (%)
|
GA
|
GAM (%)
|
|
Plant height (cm)
|
74-97
|
85.7
|
7.74
|
5.67
|
53.60
|
7.34
|
8.56
|
|
Days to heading (days)
|
58-81
|
71.7
|
9.29
|
8.76
|
89.08
|
12.21
|
17.07
|
|
Grain filling period(days)
|
21-33
|
28.93
|
12.45
|
9.31
|
55.99
|
4.16
|
14.38
|
|
Days to maturity (days)
|
89-115
|
100.5
|
7.06
|
6.46
|
82.02
|
12.00
|
11.94
|
|
No. of fertile tillers/plant
|
1.4-2.9
|
2.18
|
19.08
|
14.74
|
59.61
|
0.51
|
23.47
|
|
Spike length (cm)
|
7.6-11.4
|
9.46
|
9.93
|
8.48
|
72.83
|
1.41
|
14.92
|
|
No. of spikelets/spike
|
15-22
|
18.38
|
9.12
|
7.37
|
65.16
|
2.25
|
12.27
|
|
No. of kernels/ spike
|
35-59
|
46.10
|
11.94
|
7.81
|
42.82
|
4.86
|
10.55
|
|
1000-kernel weight (g)
|
27-44
|
35.79
|
14.31
|
10.28
|
51.61
|
5.45
|
15.22
|
|
Grain yield (t/ha)
|
2.9-5.3
|
4.18
|
14.75
|
12.88
|
76.31
|
0.97
|
23.22
|
|
Biomass yield (kg/plot)
|
2.1-3.5
|
3.05
|
12.12
|
7.80
|
41.46
|
0.31
|
10.37
|
|
Harvest index (%)
|
21.9-42.1
|
34.61 2.87 2.87
|
15.81
|
13.59
|
73.85
|
8.34
|
24.09
|
PCV=Phenotypic
coefficient of variation, GCV=Genotypic coefficient of variation, H2b=
Broad sense heritability GA=Genetic advance and GAM= Genetic advance as % of
mean
5. SUMMARY AND CONCLUSIONS
The analysis of variance revealed highly
significant differences among the genotypes for all characters. Phenotypic
coefficients of variation were generally higher than genotypic coefficients of
variation for all characters studied, implying the influence of growing
environment. Moderate GCV coupled with moderate PCV (10 to
20%) was observed for number of productive tillers per plant, thousand-kernel
weight, grain yield, and harvest index, indicating the effectiveness of selection
based on the phenotypic performance of the genotypes. High heritability values were observed for
days to heading, days to maturity, harvest index, grain yield, number of spikelets per spike and spike length. Genetic progress as a percentage of the mean
was high for harvest index, grain yield and number of fertile tillers per
plant, and it was moderate for spike length, number of spikelets
per spike, days to heading, days to maturity, grain filling period,
thousand-kernel weight, number of kernels per spike and biomass yield were
showed moderate genetic advance as percent of mean. High heritability coupled
with high genetic advance as percent of mean were found for grain yield and
harvest index; while high heritability coupled with moderate genetic advance as
percent of mean were observed days to heading, days to maturity, number of spikelets per spike and spike length. Moderate heritability
coupled with high genetic advance was observed for number of fertile tillers
per plant, whereas moderate heritability coupled with moderate genetic advance
as percent of mean was observed for grain filling period, number of kernels per
spike, thousand-kernel weight and biomass yield. This implies that the
variation observed was mainly under genetic control and the possibility of progress
from selection. In general, in the context of plant breeding, traits that
exhibited medium GCV, H2b and GAM would be useful criteria for
selection; as a result, number of productive tillers per plant, thousand-kernel
weight, grain yield, and harvest index, were identified as the major
contributors. Therefore,
depending on the
mean performances, genotypes such as QAFZAH-2/FERRIUG-2 (5.33 t ha-1), KAUZ'S'/FLORKWA1//GOUMRIA-3 (5.16 t ha-1), SERI
82/SHUHA'S'//PASTOR-2 (5.15 t ha-1)
and ETBW5957HUBARA-3*2/SHUHA-4 (5.11
t ha-1) had mean performances higher than the highest performing
check variety (Gambo=4.75 t ha-1) for
grain yield (t ha-1) to improve the next bread wheat breeding programme to increase the farmer’s productivity. However, since this is a one-year
result, it is necessary to repeat the field experiment and evaluate the
genotypes over several locations and years in order to make conclusive and
comprehensive conclusions and recommendations.
6. REFERENCES
.
Adhiena
Mesele, Wassu Mohammed and Tadesse Dessalegn. 2016.
Estimation of Heritability and Genetic Advance of Yield and Yield Related
Traits in Bread Wheat (Triticum aestivum L.) Genotypes at Ofla District, Northern
Ethiopia. International Journal of
Alemu Dabi
Borena. 2016. Genetic Variability and Association
among Grain Yield and Yield Related Traits of Bread Wheat (Triticum aestivum L.) Genotypes. MSc Thesis Postgraduate
Program Directorate, Haramaya University, Ethiopia.
Ali, Y., Manzoor A. B., Akhter J., Monneveux P. And Lateef
Z. 2008. Genetic Variability, Association and
Diversity Studies in Wheat (Triticum Aestivum L.) Germplasm. Pakistan Journal of Botany. 40(5): 2087-2097.
Allard,
RW. 1960. Principles of Plant Breeding. John Wiley and Sons.
Inc. New York. P430.
Berhanu Mamo Andarge. 2004. Genetic
variability and character associations in bread wheat (Triticum
aestivum L.) genotypes developed for semiarid
areas. MSc Thesis Presented to the School of Graduate Studies of Alemaya University, Ethiopia.
Berhanu
Meles, Wassu Mohammed and Yemane Tsehaye. 2017.
Genetic variability, correlation and path analysis of yield and grain quality
traits in bread wheat (Tritium aestivum L.) genotypes at Axum, Northern Ethiopia. Journal of Plant Breeding and Crop Science 9(10):175-185.
Bisne,
R, Sarawgi, AK and Verulkar,
SB. 2009. Study of heritability, genetic
advance, and variability for yield contributing characters in rice. Bangladesh Journal of Agriculture Research,
34(2): 175-179.
CSA (Central
Statistical Agency). 2017. Report on Area and Production of Major
Crops (Private Peasant Holdings, Meher Season). Agricultural Sample Survey 2016/2017. Central
Statistics Agency, Addis Ababa, Ethiopia.
Dawit Tsegaye, Tadesse Dessalegn, Yigzaw Dessalegn and Getnet Share. 2012. Genetic variability, correlation and path analysis in durum wheat germplasm (Triticum durum
Desf). Wudpecker
Research Journals, 1(4):107 -112.
Dergicho
Dutamo, Sentayehu Alamerew, Firdisa Eticha and Gezahegn Fikre. 2015a. Genetic Variability in Bread Wheat (Triticum
aestivum L.) Germplasm for Yield and Yield
Component Traits. Journal of Biology, Agriculture and Healthcare 5(13).
Desheva, G., Cholakov, T. 2014. Variability, heritability and genetic
progress for some yield components in common winter wheat genotypes (Triticum aestivum L.).
Genetics and Plant Physiology, Conference “Plant Physiology and
Genetics-Achievements and Challenges”, Sofia, Bulgaria, 4(3-4): 191-200.
Falconer, D.S. and Trudy, F.C. Mackay. 1996. Introduction to Quantitative Genetics. 4th
ed. Longman Group Limited, Malaysia.
FAO. 2017.
Food and Agricultural Organization. CROP PROSPECTS and
FOOD SITUATION. Quarterly Global Report.
March 2018.
Foulkes, Slafer, MJ., Davies, GA., Berry,
WJ., Sylvester-Bradley, Martre, PM., R., Calderini P., DF., Griffiths, S. and Reynolds, MP. 2011.
Raising yield potential of wheat. III. Optimizing partitioning to grain while
maintaining lodging resistance. Journal of Experimental Botany, 62,
469-486.
Gezahegn Fikre, Sentayehu Alamerew, Zerihun Tadesse. 2015. Genetic Variability Studies in Bread Wheat (Triticum aestivum L.) Genotypes
at Kulumsa Agricultural Research Center, South East
Ethiopia. Journal of Biology, Agriculture and
Healthcare. 5(7) 2224-3208.
Gomez, K.A. and Gomez, A.A. 1984. Statistical Procedures for Agricultural Research, 2nd.
Haileslassie, Gebremeskel, Haile Abebe, Wakuma Biratu, Kedir Jalato .2015. Performance evaluation of hot pepper (Capsicum annum L.)
varieties for productivity under irrigation at Raya Valley, Northern, Ethiopia.
Basic Research Journal
Agricultural Science. Rev. 4(7):211-216.
Hasna, D., Ferdous, M. F., Mia, M. S., and Shamsuddin,
A., 2011. Study on genetic divergence and relationship between yield and yield
contributing characters in spring wheat. Journal of
Agroforestry. Environ. 5 (1): 121-124.
Idrees, N. and Khan,
M.I., 2009. Design improvement using uniformity trials experimental data. Pak. J. Agri. Sci, 46(4),
pp.315-320. Jaynes,
DB, Kaspar, TC, Colvin, TS, James, DE. 2003.
Cluster analysis of spatiotemporal corn yield patterns in an Iowa field. Agronomy Journal.95:574–586.
Johnson, H. W,
Robinson, H. F. and Comstock, R E. 1955. Estimate of genetic
and environmental variability in soya bean. Agronomy Journal, 47:314-8.
Khan, A.S., Ashfaq, M. and Asad, M.A., 2003. A
correlation and path coefficient analysis for some yield components in bread
wheat. Asian Journal of Plant Science, 2(8):582-584.
Kolakar,
S., Shashikala, S., Hanchinal,
R.R. and Nadukeri, Sadashiv. 2012.
Assessment of genetic variability in wheat genotypes, Advance Research Journal Crop Improvement, 3 (2):
114-117.
Maqbool,
R., Sajjad, M. Khaliq, I.
Aziz-ur-Rehman, Khan, A.S.
and Khan, S.H. 2010. Morphological diversity
and traits association in bread wheat (Triticum
aestivum L.). Am. Eurasian Journal of Agriculture Environ. Sci., 8:216-224.
Masood, M.A., Faroo, K., Mujahid,
Y. and Anwar, Z.M. 2008. Improvement in
precision of agricultural field experiments through design and analysis. Pakistan Journal of Life and Social Science. 6(2):
89-91.
Mohammed Abinasa1, Amsalu Ayana
and Geremew Bultosa.2011. Genetic variability, heritability and trait associations
in durum wheat (Triticum turgidum L. var. durum) genotypes. African Journal of Agricultural Research,
6(17)3972-3979.
Mollasadeghi,
V., Elyasi S., and Mirzamasoumzadeh,
B. 2012. Genetic variation of 12 bread wheat genotypes based on
number of phonological and morphological traits. Annals of Biological
Research, 3 (10):4734-4740.
Obsa Chimdesa
Bekana. 2014. Genetic Variability among Bread Wheat (Triticum Aestivum L.)
Genotypes For Growth Characters, Yield
And Yield Components In Bore
District, Oromia Regional State. MSc
thesis Postgraduate Program
Directorate, Haramaya University, Ethiopia.
Sleper,
D.A. and Poehlman, J.M. 2006. Breeding Field Crops. 5th edition.
Blackwell Publishing, Professional, Ames, Iowa.
Rehman, S. Ur, Abid,
M. A., Bilal, M., Ashra, J., Liaqat,
S., Ahmed, R. I. and Qanmber G. 2015. Genotype by trait analysis and estimates of heritability of wheat (Triticum aestivum L.)
under drought and control conditions. Basic Research Journal of Agricultural Science and Review, 4(4):127-134.
Reynolds, M., Bonnett, D., Chapman, SC., Furbank,
RT., Manès, Y., Mather, DE. and Parry, MAJ. 2012. Raising yield
potential of wheat. I. Overview of a consortium approach and breeding
strategies. Journal of Experimental Botany, 62, 439-452.
Robinson H. F., J. H. W. and Comstock, R. E. 1955. Estimation of genetic and environmental
variability in soybeans. Agronomy Journal.
47, 314-318.
SAS. 2008.
Statistical Analysis System.Version 9.2, SAS
Institute Inc., Cary, NC., USA.
Shewry, PR.
2009.
Wheat. Journal of Experimental Botany 60, 1537-1553.
Singh, B.D. 1993. Plant
Breeding Principles and Methods. Kalyani Publishers. Ludhiana. New Delhi.
Sivasubramaniah, V. and Madhavamenon, P. 1973. Path analysis for
yield and yield components of rice. Madras Agricultural Journal, 60:1217-1221.
Waqar-Ul-Haq,
MF Malik, M Rashid, M Munir, Z Akram. 2008.
Evaluation and Estimation Of Heritability and Genetic Advancement for Yield
Related Attributes in Wheat Lines. Pak J Bot, 40(4): 1699–1702.
Welsh, J. R. 1981. Fundamentals
of plant genetics and breeding, John willey
and Sons, Inc. Newyork. P
290.
Yadawad
Arati, R. R. Hanchinal, H.
L. Nadaf, S. A. Desai, Suma Biradar
and V. Rudra Naik. 2015.
Genetic variability for yield parameters and rust resistance in f2 population
of wheat (Triticum aestivum
L.) Karnataka, India. The
Bioscan. 10(2): 707-710.
|
Cite this Article: Degife
G; Mohammed W; Assefa k (2019). Genetic Variability
Analysis of Agro-Morphological Traits among Bread Wheat (Triticum aestivum L.) Genotypes at Raya Valley
of Southern Tigray, Ethiopia. Greener Journal of Agricultural Sciences 9(4): 382-395, https://doi.org/10.15580/GJAS.2019.4.090219165.
|
