
GREENER JOURNAL OF ENVIRONMENTAL MANAGEMENT AND PUBLIC SAFETY
ISSN: 2354-2276
Submitted: 13/01/2016 Accepted: 03/01/2016 Published: 06/04/2016
Research Article (DOI: http://doi.org/10.15580/GJEMPS.2016.2.011316005)
Flood Vulnerability Assessment in Lagos City Using Multi – Criteria Analysis
Gelleh I. Daniel1, Ibidun O. Adelekan2, Okeke U. Henry1
1Cooperative Information Network, National Space Research and Development Agency, Obafemi Awolowo University Campus Ile-Ife Osun State, Nigeria.
2Department of Geography, University of Ibadan, Ibadan Nigeria.
gellehdaniels @yahoo .com
ABSTRACT
Flood disaster is considered as a major natural hazard due to its devastating effects on the affected area. Geographical Information System (GIS) is integrated with Multi-Criteria Decision Analysis (MCDA) method and is used to analyse the flood vulnerable areas. The actual aim of this is to provide a more flexible and accurate decisions to the decision makers in order to examine the effective factors causing flood. The study considers eight factors that contribute to flood within the Oke-Afa water catchment in Lagos State, Nigeria which include rainfall, stream order, distance from stream, elevation, land use, slope, soil, and geology. Multi-criteria evaluation approach which involves ranking method and pair-wise comparison method (Analytical Hierarchical Process-AHP) was used to calculate the weights of each factor. Using AHP the weightage derived for the factors are 0.38%, 0.21%, 0.16%, 0.10%, 0.06%, 0.04%, 0.03%, 0.02% respectively for rainfall, stream order, distance from stream, elevation, land use, slope, soil, and geology. The study also made use of Landsat satellite image of 2014 and topographic map of Lagos state to classify the different land use types within the area. The digitized topographic map covering the study area was used to generate the Digital Elevation Model (DEM) and contour map respectively. At the end of the study a flood vulnerability Map of the vulnerable areas within Oke-Afa was generated with a view to assisting decision makers on the menace posed by the disaster.
Keywords: Geographical Information System, Multi-Criteria Evaluation, Vulnerability, Flood, Analytical Hierarchy Process.
1. INTRODUCTION
Adverse effects that are caused by floods on a global scale have been substantial in recent decades (Jonkman and Vrijling 2008). Inthe past few decades, public policy makers and land users have become so conscious of the need to manage risks in order to lessen or adapt to their causes or consequences. The 2012 floods in Lagos are examples of some cumulative hazards; hundreds of lives and property worth millions of naira have been directly and indirectly lost through flood every year in Lagos. The human population in the city has increased and drainages obstructed due to bad waste disposed habits (Olusegun,2004) all of these translate to increase in vulnerability to flood and call for flood disaster management, early warning and vulnerability modelling.
In this study, Multi-Criteria Evaluation method was integrated in a GIS in order to produce a flood vulnerability map of the area. This map was however produced and re-classified into three different levels of vulnerability namely highly vulnerable, moderately vulnerable, and slightly vulnerable. This kind of approach was also used to analyze and find the flood vulnerable areas in west of black sea of northern Turkey (Yalcin, G. 2002). The study used seven spatial criteria each was presented and stored in layer by using Arc View 8.2 and the criterion values were generated. The maps were converted into grids and the mathematical process was applied to the criteria with Map Calculator. Ranking Method was also used to rank every criterion under consideration in the order of the decision maker’s preference and Pairwise Comparison Method (PCM) was used to compare each criteria. At the end of the application, composite maps were created using Boolean Approach, Ranking Method, and Pairwise Method. This method used by Yalcin and Akyurek (2004) to link the weights into raster based GIS data and produce a vulnerability map was also replicated by Yahaya and Abdalla (2010).
2. STUDY AREA
The study area basically covers Oke-Afa canal and it cuts across other LGAs like Agege, Ikeja, Ifako/Ijaye, Mushin, Surulere, Amuwo Odofin, Apapa, Ikoyi and Lagos island. Oke - Afacanal is located in Ejigbo local government area of Lagos State. The canal is about 3.5km long and it drains Isolo in Lagos metropolis, South-Western Nigeria. The study area lies between latitude 6° 37' 30"ᴺ - 6° 28' 30"ᴱ and longitude 3° 16' 30" - 3° 22' 30"ᴱ. This canal is located around residential area and was initially a swampy area, but with the significant increase in population size in the state, the area is now a newly developing residential area with over two hundred and fifty houses and fifteen streets built around and along the canal. Most of the houses built along the canal course drain their waste directly into the canal water thereby altering the flow of water along the course, and close to this canal we have the Isolo open dump site, a cattle ranch and the oke-afa plank market.
Figure 1 shows map of Nigeria showing Lagos State and Lagos State showing the study area.
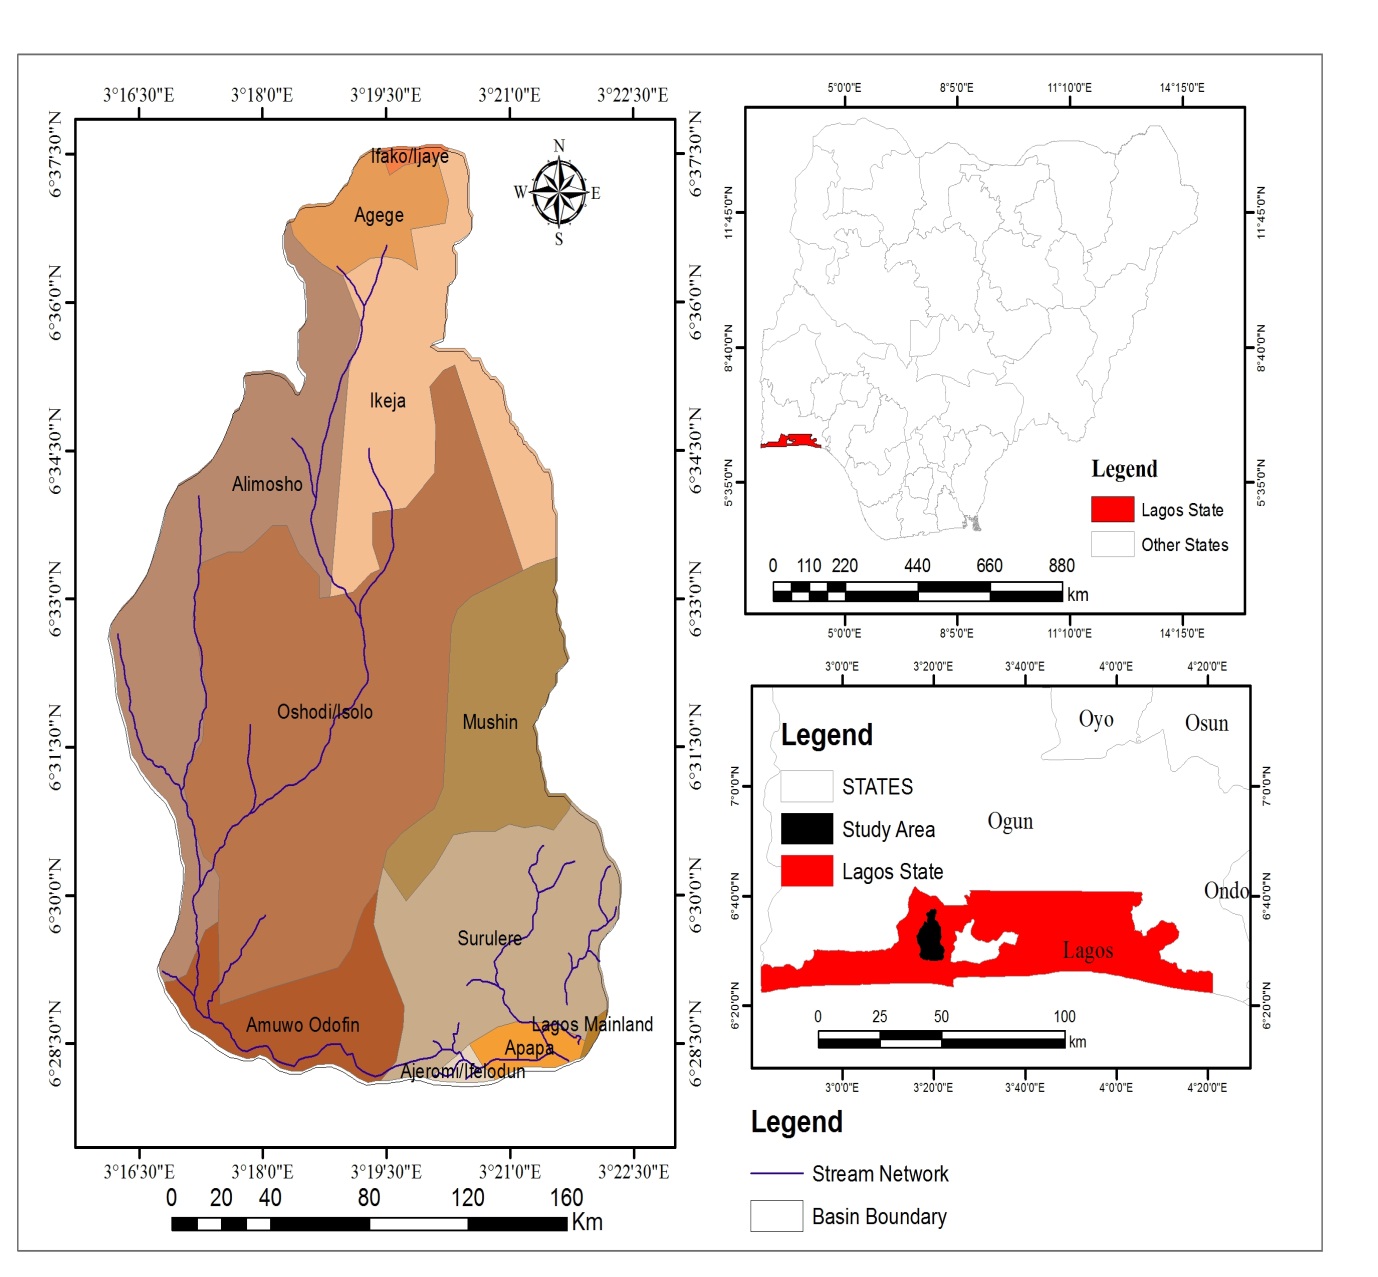
Figure 1: Oke-Afa water Catchment
3 MATERIALS AND METHOD
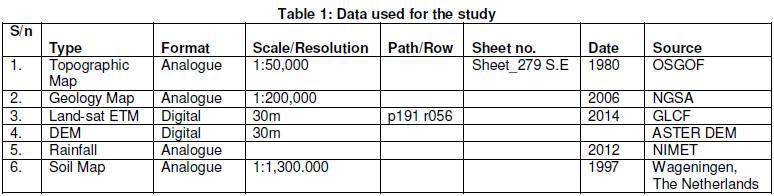
Primary and secondary data which contain both spatial and non-spatial attributes were used. The primary data included Ground Control Point (GCP) acquired using GPS with ± 3 m accuracy, LandSat image of 2014 covering the study area, and ground truth information which aided the supervise classification of the satellite image and validation of other thematic datasets. Secondary data used include topographic map of Lagos State at the scale of 1:50,000, soil map, geology map, mean annual rainfall data for 2012, and Digital Elevation Model (DEM) covering the study area.
The satellite image was imported into Envi 4.3 image processing software in Geo-tiff format from where a False Colour Composite (FCC) of band 5, 4 and 3 was generated. Classification scheme was developed comprising of built up areas, wetland, riparian vegetation, bare surface, and water body. The satellite image was classified using this scheme while the onscreen pixel training was guided by information acquired from the field and subsequently classified using maximum likelihood algorithm with average kappa coefficient and overall accuracy of 0.927 and 93.68 % respectively.
3.1 DEM, Slope and other Thematic Datasets
The Digital Elevation Model (DEM) (Fig 3.5) was developed from the digitized contour lines of the topographic maps covering the study area with a scale of 1:50,000. From the DEM, slope (Fig 3.4) and other terrain characteristic of the study area was derived. The other thematic maps which include soil and geology were also digitized using auto complete polygon in ArcGis10.1
3.2 River Basin Area Delineation
The study area (Oke-Afa basin) was delineated using the hydro basin divide identifiable from the scanned, geo-referenced and digitized 1:50,000 topographic maps covering the study area. From the topographic map the contour and drainage networks were extracted and populated with their various z and ordering values respectively using onscreen digitization process and saved into the work geo-database. Digitally, the contour with the highest z-value which divides the drainage of the lowest order of two adjacent river basins marking the stream divide was identified and converted to polygon and subsequently used to clip (sub-map) the basin area (Figure 2). The basin area polygon was also used to clip other thematic dataset used for the multi-criteria analysis.
Ranking and pair-wise comparison methods were used to examine the flood vulnerable areas. The flood factors were comparatively evaluated and ranked using pair wise analysis. Subsequently weights were assigned to each factor according to their significance influence on the cause, magnitude, and distribution of flood within the area. And then each factor was weighed on a scale range of 1 to 9. The scale rank of each layers are multiplied by the appropriate multiplier, and for each cell, the resulting values are added together such that they equal up to 100 percent of which 10 to 30 and 40 to 60 percent are regarded as less and marginally vulnerable respectively while areas within the range of 70 to 100 percent are categorise as highly vulnerable.
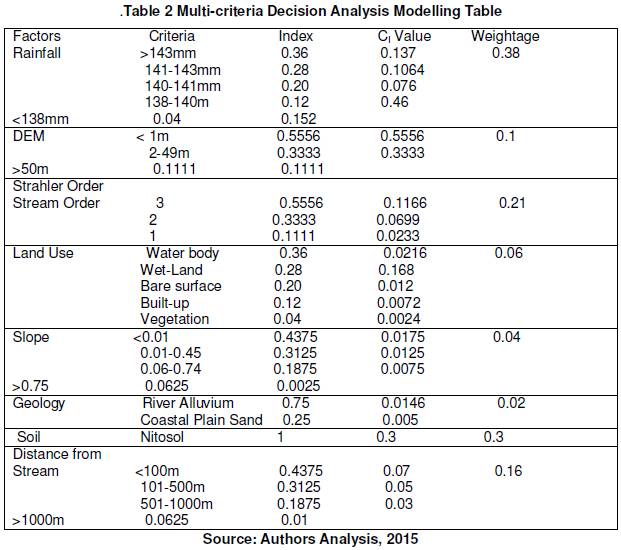
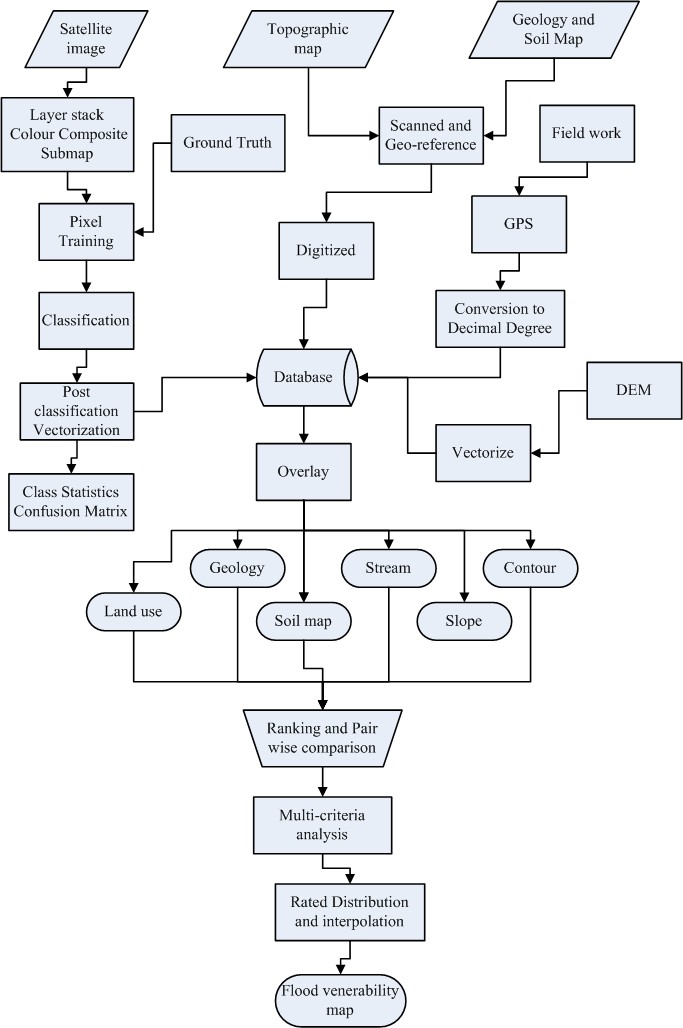
Figure 2: Methodology Flow Chart
4. RESULT AND DISCUSSION
The factors under consideration causing flood in the study area which includes Rainfall, Stream Order, Distance from stream, Elevation, Slope, Soil and Geology were assigned percentages according to their different levels of contribution to flood. Rainfall was assigned 20%, stream order 17%, distance from stream 15%, elevation 13%, land use 11%, slope 9%, soil 8%, and geology 7% after which pair-wise comparison method was used to compare the factors in order to compute weightage for each factor. Land use was classified to determine the land use category that contributes more to flood within the study area.
4.1 Analysis of Land Use/Land Cover of the Study Area
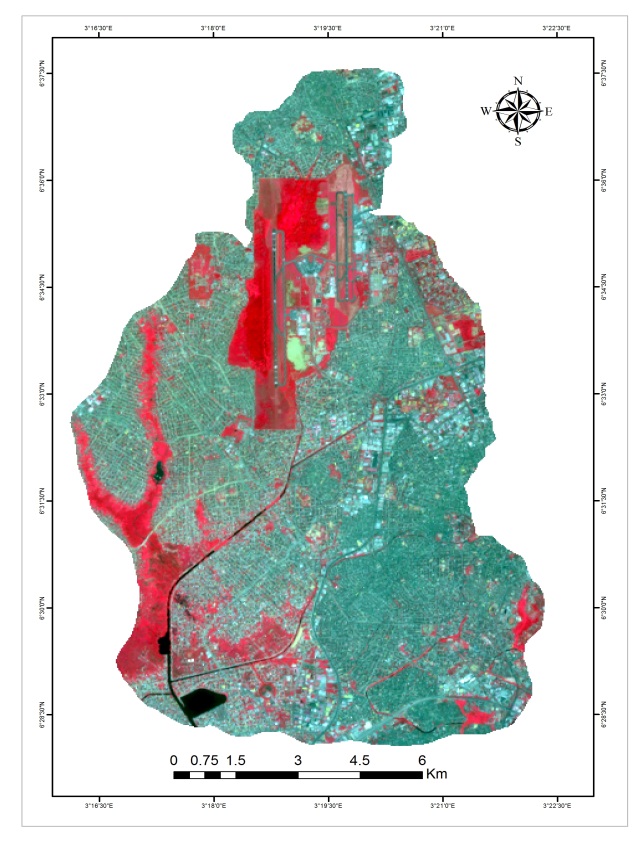
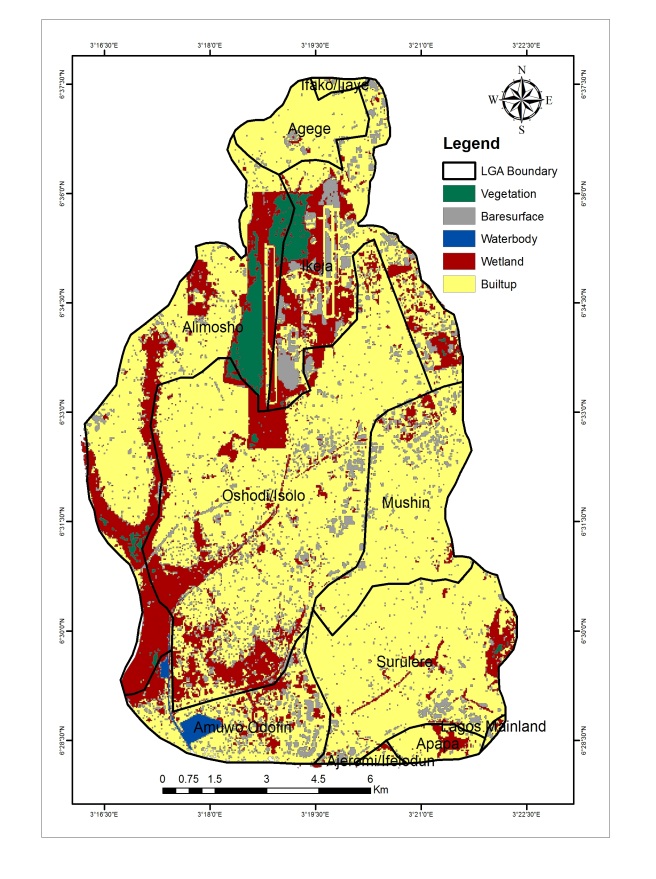
Figure 3: 2014 Land-Sat Image of Study Area Figure 3.1: Classified Satellite Image of Study
Area.
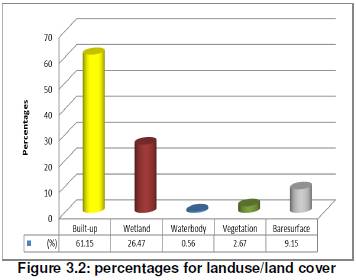
The analysis shows that built-up within the study area covers an area of about 79.738 km2 and a percentage of 61.15%, followed by wetland and water-body which covers 34.4934km2, 26.47% and 0.7263km2 and 0.56% respectively. Vegetation covers 3.4857km2, 2.67% while Bare-surface covers 11.9349km2 and 9.15% of the entire study area which is 130.3783km2. This implies that the built up areas contribute more to flooding as a result of too many people building on flood plains which results to the alteration of natural drainage channel and also dumping of refuse indiscriminately in drainage channels, which results to blockage of the existing drainage channels.
4.1.1 Analysis of Flood Vulnerability Assessment.
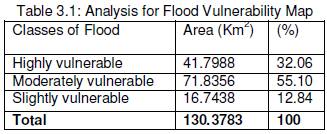
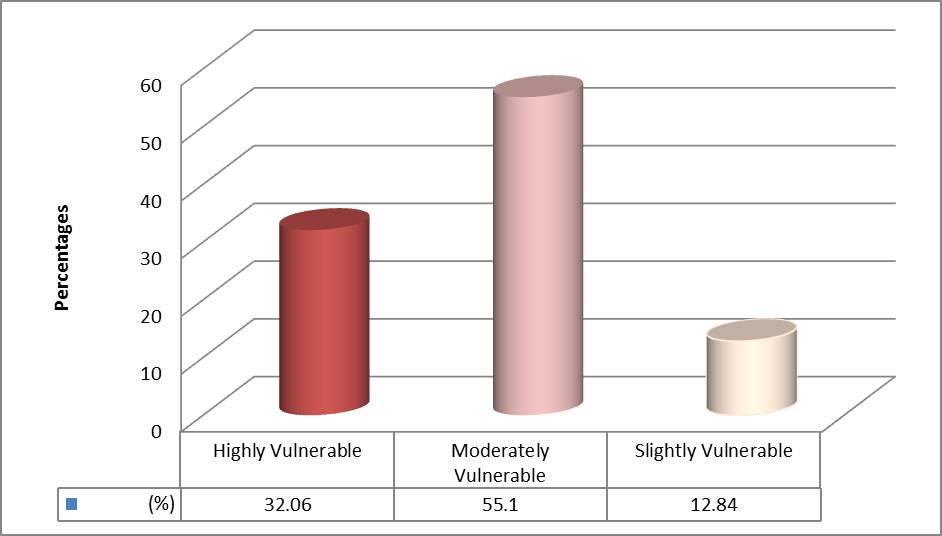
Figure 3.3: percentage for Flood Vulnerability Map
This analysis shows that highly vulnerable area to flood within the study area covers an area of 41.7988km2 and a percentage of 32.06%. the portion clearly shows towns that are at risk of a high vulnerability to flooding within the study area and these towns includes ObeleLafia, Itire, Surulere, Mushin Halt, Ijesa-Tedo, Akanba, New Lagos, Osho, Aganni, Iponri, Iganmu and Alagbede. These towns are at high risk of flooding basically because of the nature of the slope within the area. Slope map of the study area was also produced and classified into three different classes namely, Highly Vulnerable, Moderately Vulnerable and Slightly Vulnerable.
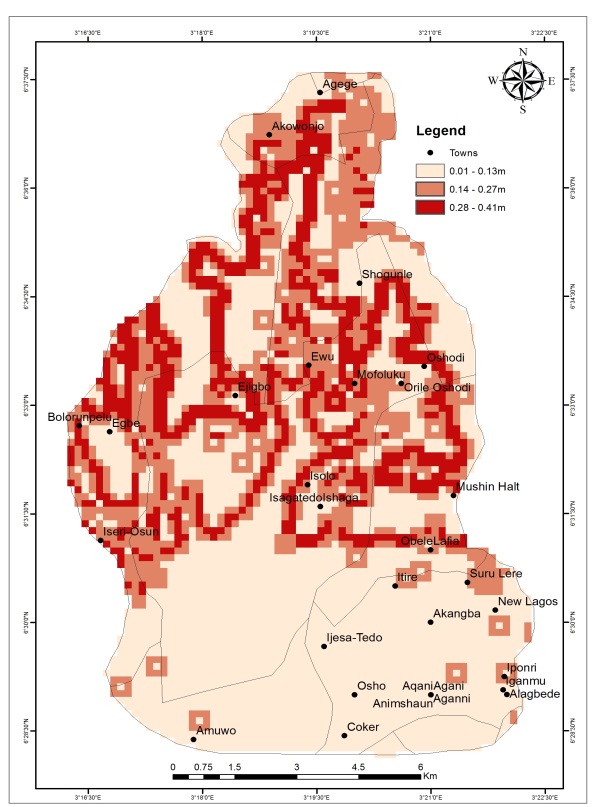
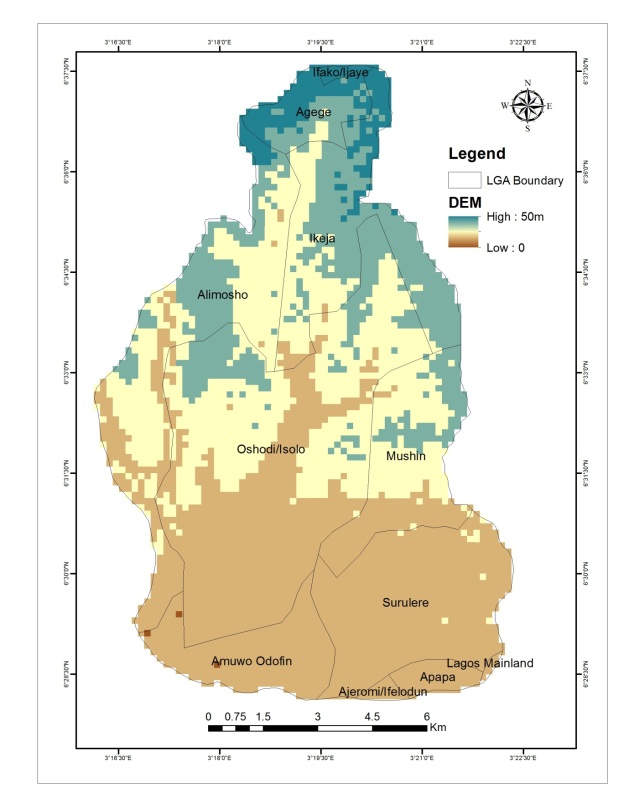
Figure 3.4: Slope of Study Area. Fig 3.5: DEM of Study Area
This shows that the gradient at the bottom of the study area map is low and that, accumulation of water is more within this area, and this however implies that towns within this area are prone to high level of flood given the nature of the slope within the area.
Moderately vulnerable areas cover 71.8356km2 and a percentage of 55.10% of the entire study area which indicates that the area is not really prone to high level of flood vulnerable. The towns located within this area include; Bolorunpelu, Egbe, Iseri-Osun, Isolo, Ejigbo, Mafoluku, Oshodi, Orile-Oshodi, Shogunle, Agege, Coker, Amuwo and part of Isagatedolshaga. People living within these towns are also at the risk of flooding but not as those living within the highly vulnerable areas.
Slightly vulnerable portion covers an area of 16.7438 km2 and a percentage of 12.84% of the entire study area map showing the towns and places that are slightly vulnerable to flooding. These places are slightly vulnerable to flooding because they are basically located at a higher elevation. This shows that at higher elevation water will really not infiltrate the ground and accumulate but it will rather flow downwards to low elevated areas and accumulate. People living within these high elevated areas are not really at high risk of flooding. These towns include parts of Akowonjo and Ewu.
4.1.2 Flood Vulnerability Map.
To produce the flood vulnerability map of the area, the critical index values that was generated from multi-criteria decision modelling table was used. A grid map of the study area was produced in ArcGIS and overlaid on each of the eight map layers. After the grid map was overlaid on a map layer, the critical (CI) index values for that map layer was now entered into each of the grids. This process was done for all the other map layers, after this was done, the values of all the whole map layers was summed up and converted to point features and then interpolated using Inverse Distance Weightage (IDW) to produce the flood vulnerability map. (Fig 3.6).
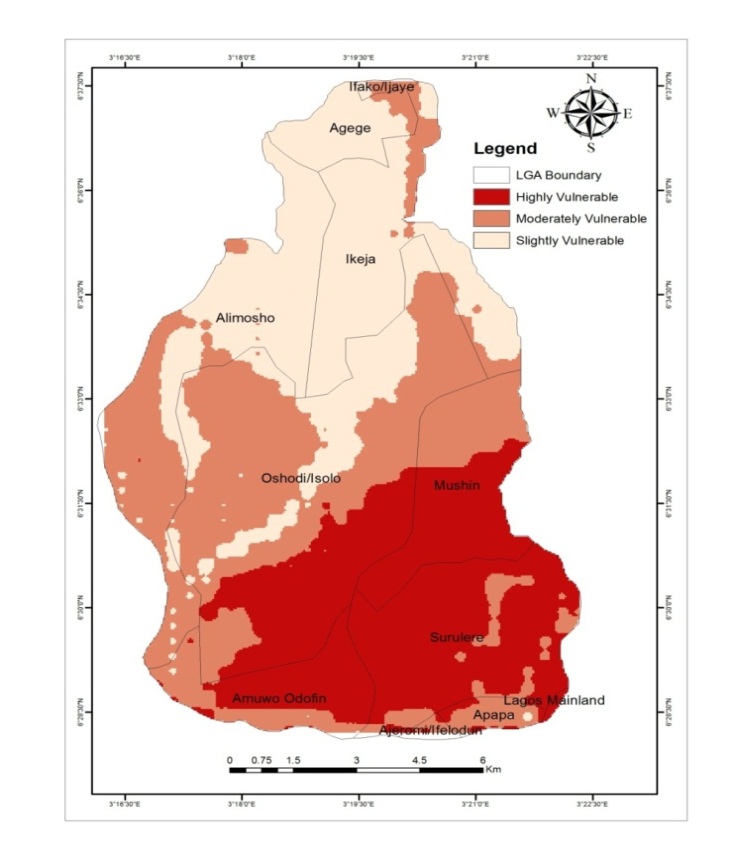
Figure 3.6: Flood vulnerability Map of Study Area
5. CONCLUSION AND RECOMMENDATION
The study clearly mapped out vulnerable areas to flooding in three different classes namely, highly vulnerable, moderately vulnerable and slightly vulnerable with the aid of MCE approach (AHP) and GIS technique and the result showed that 32.06% of the entire study area is highly vulnerable, 55.1% moderately vulnerable and 12.84 is slightly vulnerable. The study critically examined the role of GIS in decision-making and also outlined the evaluation approach for many criteria in decision process. The flood vulnerability map produced can assist planners, policy makers and emergency service providers as a valuable tool for assessing flood risk zones.
6. RECOMMENDATION
Flooding occurs both naturally and artificially and as a result, it can hardly stop as long as there is always heavy rainfall. But with proper management and planning it can be directed in a desirable and sustainable way. Therefore it is recommended that adequate and operational regulation/policies should be enacted and enforced to manage and mitigate against flooding activities such as afforestation on areas prone to flood and proper orientation and environment education/awareness should be given to the populace on the dangers associated with building and settling in flood plain areas.
REFERENCES
Jonkman, S. N. and Vrijling, J. K. (2008): Loss of Life Due to Floods, Journal of Flood Risk Management, Vol. 1, pp. 43-56.
Olusegun E, (2004) Towards Comprehensive, Long-Term Approaches to Disaster Management in Nigeria, ISDR INFORMS, Issue 4, 2004.
Yahaya, S, Ahmad, N. and Abdalla, R. F (2010): Multi-criteria analysis for flood vulnerable areas in Hadejia-Jama’are River basin, Nigeria. Journal of Scientific Research, Vol. 42, No. 1, pp. 71–83.
Yalcin, G., (2002): Analyzing flood vulnerable areas with Multi-criteria evaluation, Unpublished MS Thesis in GGIT METU, Ankara. http://www.isprs.org/istanbul2004/comm2/papers/154.pdf
Cite this Article: Gelleh I. Daniel, Ibidun O. Adelekan, Okeke U. Henry (2016). Flood Vulnerability Assessment in Lagos City Using Multi – Criteria Analysis. Greener Journal of Environmental Management and Public Safety, 5(2): 024-032, http://doi.org/10.15580/GJEMPS.2016.2.011316005