|
Greener Journal of Environmental Management and
Public Safety
Vol. 8(1), pp. 25-39, 2019
ISSN: 2354-2276
Copyright ©2019, the copyright of this article is
retained by the author(s)
https://gjournals.org/GJEMPS
|

|
A
Study to Assess the Status and Challenges of Medical Waste Management
Practices in a University Health Institution, Southern Nigeria
1Charity
O. CHUKUMAH; 1Gabriel C. C. NDINWA; 2Solomon AKPAFUN
1Department of
Industrial Safety & Environmental Management Technology
School of Environmental
Studies, Delta State School of Marine Technology, Burutu
2Department of Urban
& Regional Planning, School of Environmental Studies
Delta State School of
Marine Technology, Burutu
|
ARTICLE INFO
|
ABSTRACT
|
|
Article No.: 01202011
Type: Research
|
Introduction: Medical waste includes all types
of waste with potential characteristics to spread diseases, generated from
healthcare institutions. Objective: The study was carried out to assess the
status and challenges of medical waste management practices in Delta State
University Teaching Health Institution. Methodology: A cross-sectional
survey was carried out between March and August 2019. Multistage sampling
approach comprising of purposive sampling and case study approach was
employed for the study. The approach involved estimating the quantity of
medical waste generated and the evaluation of waste management strategy used
by the healthcare institution. A total of 240 respondents were sampled.
Collected data were subjected to statistical analysis using SPSS version 21.
Result and discussion: Average total weight of waste generated from the
departments was estimated to be 948.366 kg/day. Medical waste generation
rate was 13.598 kg/patient/day with an average bed per day generation rate
of 1.133 kg/bed/day. Kitchen department had the highest generation rate of
(254.448 kg/day) whereas the least generation rate was from NET (9.11
kg/day). It was observed that segregation of waste at source exist but
poorly implemented and monitored as medical waste was still being mixed and
dumped with general wastes that were collected, transported and disposed.
Segregation was not carried out in line with NHCWMP standards. Waste
generated were collected on a daily base and transported to a designated
place for temporary storage. Lidded plastic container, storage house, hand
cart, waste skip and wheeled trolley were mainly used to store and transport
waste. The institution lack sufficient waste containers to handle volumes of
medical waste. The result revealed that higher percentage
of waste handlers were poorly educated and irrespective of the
availability of PPE; they were observed to be wrongly used by waste
handlers. Land fill was revealed to be the most preferred final disposal
option but occasionally incineration and open pit burning were also adopted.
Conclusion: This study has helped to establish a baseline data on medical
waste management strategy in Delta State University Teaching Health
Institution.
|
|
*Corresponding Author
Gabriel C. C. Ndinwa
E-mail: gndinwa@
gmail.com
|
|
Keywords: Medical waste generation; Disposal facilities; Segregation;
Teaching health institution; Oghara
|
|
|
|
INTRODUCTION
The challenges of
medical waste management and its final disposal practices including other toxic
hazardous wastes has become a rapidly growing global concern recently dived
into my researchers in order to proffer solution to the potential risks posed
to the general public. Advancement in health programs has increased the
challenges of medical waste management globally, particularly in the developing
countries (DaSilva et al., 2005; Al Emad 2011). Generally,
waste from the medical sector has been defined by several scholars to include
materials that are generated in the course of health protection, medical
diagnosis, treatment and scientific research, immunization of humans and
testing of biological specimen (Ramokate and Basu, 2009; Mbu, 2015). Medical
wastes are classified as a potential reservoir of pathogenic organisms that
requires reliable, safe and appropriate handling techniques (Abor and Anton, 2008). It is an environmental and public
health issue that requires immediate attention in both industrialized and
developing countries.
Poor management of
medical wastes result in adverse impacts on the health of the public as well as
deteriorating the quality of the environment with the most common reoccurring
issues on its management to include the occupational safety of the workers
handling the waste and safe disposal of the materials generated (Ananth et al.,
2010). Persons most exposed to the potential risk from the improper handling
and management of medical wastes include professional and non-professional
staff of the medical centres, waste handlers,
hospital patients and their visitors (Arab et
al., 2008). A reasonable number of researchers have reported that the
inappropriate handling and disposal of medical waste poses potential risks to
health workers who may be directly exposed to the health facilities as well as
people who reside close to the facilities, especially children and scavengers
who may become severely exposed to infectious waste materials and life
threatening diseases such as HIV/AIDs, hepatitis B and C (WHO, 2002, 1999; Oke, 2008; Coker et
al., 2009; Path, 2009; Adegbita et al., 2010). In addition to health
risk from medical wastes, threat to the environment equally needs to be
considered; this includes contamination of soil, water sources and poisonous emissions
from improper burning. In the long run, waste from medical facilities does not
only impair the quality of life but as well affect the welfare of the entire
people where the facilities are sited (Bathma et al., 2012; Nwachukwu
et al., 2013 ).
The disposal of medical
waste in uncontrolled sites has been reported by scholars from other countries
to have a direct environmental impact by contaminating the soil and ground
waters (Ananth et
al., 2010). Chemical residues discharged from medical establishments into
sewerage system have been reported to adversely affect the operations of
biological sewage treatment plants as well as the natural ecosystem of the
receiving water bodies (Omofunmi et al., 2016). Similar challenges have equally been acknowledged from
pharmaceutical residues like antibiotics and other drugs, phenol and
derivatives, disinfectants and antiseptics. Chemical materials stored in torn
bags and containers, directly impact negatively on the health of workers whom
comes in direct contact with them (Mbu, 2015).
Improper management of
medical waste can create serious health threatening challenges especially
threats to the health and safety of the workers and the environment where the
facilities are sited (Ali and Kuroiwan, 2009). In
countries like Nigeria, where many health concerns are competing for limited
resources, it is not surprising that medical waste management has received less
attention and priority it deserves from stakeholders and government (Abah and Ohimain, 2011).
Although, reliable quantitative data on the nature and quantity of waste from
medical facilities and the appropriate management techniques to adequately
dispose of these wastes has remain a challenge in many developing countries
around the world. It is believed that several hundreds of tons of waste from
the health sector are deposited openly in waste dumps and surrounding
environments, often alongside with other solid waste materials (Alagoz and Kocasay, 2007; Abah and Ohimain, 2010). In
Nigeria, there is neither available database nor records on the quantity and
nature of waste generated from the health sector. Waste from this sector which
poses serious life threatening potential risk on environmental health has been
reported to be at the ground floor on issues with priority from the government.
Available evidence revealed that medical waste are handled and managed in line
with other solid wastes that are generated on a daily base (Edmund, 2012).
Several hospitals are seemed to dispose their waste in dustbins, drains and canals
as well as dumping on the outskirts of the towns. Such disregard to protecting
the general health of the public occurs as a result to lack of awareness, low
waste management skill, lack of waste treatment facilities and systems,
nonchalant attitude of the coordinating ministries and agencies; bribery and
corruption among health inspectors. The challenge is getting worse on a daily
base with rapid spread in numbers of health centres,
government owned general hospitals, private clinics and diagnostic laboratories
across the country (Mokuolu, 2009).
The rapid increase of
healthcare institutions in Delta State exerts a tremendous impact on human
health ecology. Estimate suggests that there are more than 625 healthcare centres existing in the state (Ibekwe,
2015). These facilities generate hazardous and toxic wastes in hundreds of tons
on daily operations. Only a few have the necessary requisite and facilities to
safely manage the wastes. The current strategy reportedly used in handling
these wastes in Delta state is a player to positively contributing to the
spread of infectious diseases. The generated liquid and solid wastes contain
toxic and infectious materials that are simply disposed into the nearest drain
and garbage heap respectively; thereby posing risk to waste pickers and
scavengers that picks up scrap from these garbage dumps. Very few studies have
been carried out on medical waste in Nigeria particularly in Delta State and
presently, considerable gap exist in literature with regards to the assessment
of medical waste management practices in the state; hence the need for this
study. The main objective of this study is to assess the status and challenges
of medical waste management practices in Delta State using the State University
Teaching Health Institution as case study.
RESEARCH DESIGN AND
METHODOLOGY
Study Area
Delta State University
Teaching Hospital, Oghara with the acronym DELSUTH is a health institution visited by
people of different race, age group, gender and religion when medically unfit.
The health institution is located at Oghara main town
in Ethiope West Local Government Area of Delta State.
It lies at latitude 5°35'11.99" N and longitude 6°06'0.60" E (see
Figure 1). The health institution is 17 m above sea level and sited in a town
covering an area of 1,175 km2 within the tropical rain forest belt
of Nigeria (Ibekwe, 2015). The health institution is
a renowned and National University Commission (NUC) accredited University
Teaching Hospital owned by Delta State Government. It was built as an initial
180-bed capacity ultra-modern specialist hospital and upgraded to 250-bed
capacity. Other important close landmarks include: Nigerian Naval Logistics Headquarters, Mopol
51 Base of the Nigeria Police Force, Local Government Council headquarter, Pan
Ocean Flow Station and Gas Plant, Delta Polytechnic, Otefe
and Western Delta University. The health institution renders services to an
estimated adult population of 288,070 (Ibekwe,
2015) with over 2,064 staff strength comprising
of 230 medical doctors and 572 nurses (see Table 1).
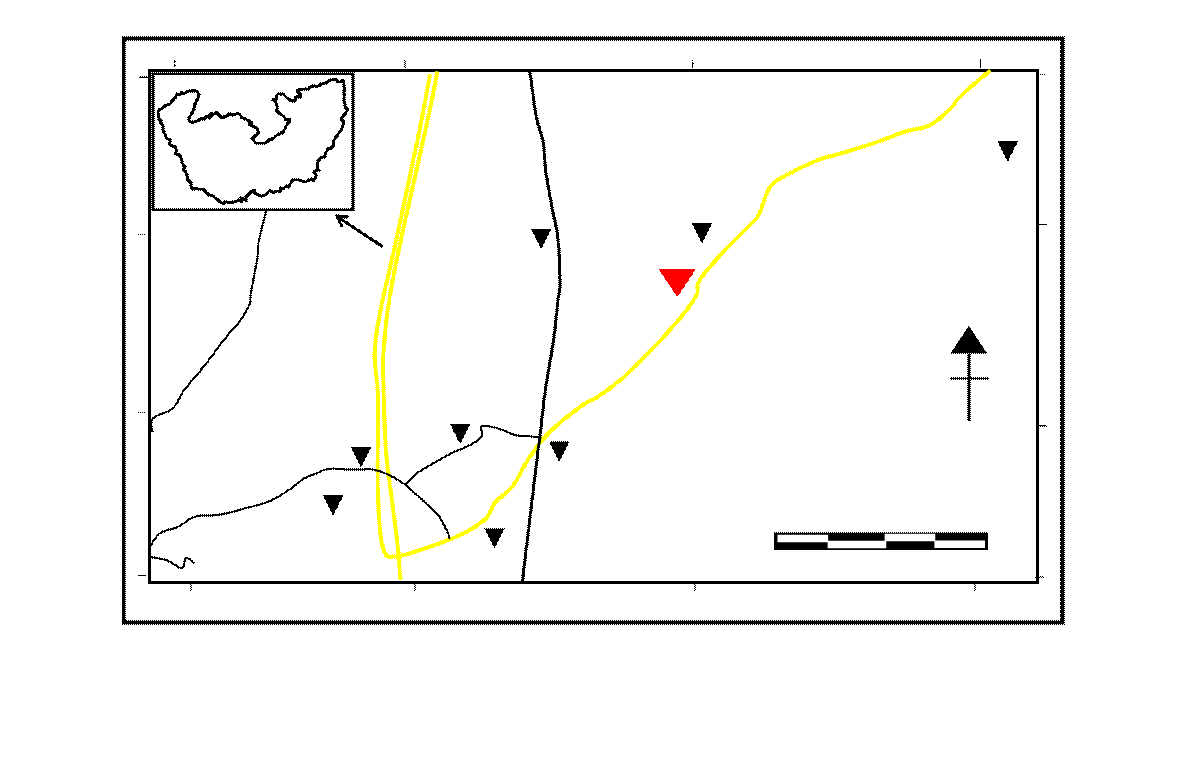
Fig.
1: Map of Oghara showing the Health Institution
Table
1: Characteristics of the health institution
|
Characteristic
|
Strength
|
|
Number of beds
|
250
|
|
Approximate number of health care
workers (post registration)
|
532
|
|
Consultant Clinicians
|
94
|
|
Doctors
|
230
|
|
Nurses
|
572
|
|
Pharmacists
|
23
|
|
Out-patient attendance in the
previous year (2018)
|
28,416
|
Source:
Fieldwork, 2019
Research
Design
The study adopted a
cross sectional survey to assess the status and challenges of medical waste
management practices in Delta State University Teaching Health Institution, Oghara from March to August 2019. It made use of a
multistage sampling approach. Firstly, a purposive sampling approach was
employed in selecting the respondents. Out of 240 respondents selected for the
study, 50% were health workers in different areas of specialty like doctor,
nurse; laboratory technologist and pathologist who are the primary generators
of these wastes during the course of carrying out their professional duties
(see Table 2). The balance 50% of respondents are
waste handlers, out-patients and residents in the community. Solid waste
sampling was performed once per day from each department within the health
institution; weighed daily for 60 days and quantity recorded according to its
classification (see Table 3) over a period of 6-months to determine the
generation rates. The methodology applied also consisted of questionnaire
survey and in-depth interview with the sampled respondents. The information was
collected using forms specifically developed for this purpose. Site visits was
conducted to support and supplement information gathered in the survey.
Interviews and site visits was helpful in obtaining information about common
practices in the management of wastes. Questionnaires were developed from
studying previous research on this area, so that they would cover all basic
requirements needed for the study. Self administered
questionnaire was adapted from WHO recommendation assessment tool. Pre-testing
of questionnaire was made to assess the validity of the questions out of the
study area. Spot-checks and review of the completed questionnaires were made
daily by the researchers to ensure completeness and consistency of the
information collected. Collected data were then subjected to further
statistical analysis.
Table 2: Breakdown of
respondents for the study
|
S/N
|
Profession
|
No
of questionnaire administered
|
Percentage
|
|
1
|
Doctor
|
30
|
12.5
|
|
2
|
Nurse
|
30
|
12.5
|
|
3
|
Laboratory Technologist
|
30
|
12.5
|
|
4
|
Pathologist
|
30
|
12.5
|
|
5
|
Waste Handler
|
40
|
16.7
|
|
6
|
Out Patients
|
40
|
16.7
|
|
7
|
Residents
|
40
|
16.7
|
|
|
Total
|
240
|
100
|
Source: Fieldwork, 2019
Ethical approval
Ethical approval was
obtained from the ethical approval committee of the Delta State University, Abraka. A formal letter of introduction collected from the
Department of Industrial Safety and Environmental Management, School of Marine
Technology, Burutu, Delta State was given to the
University and permission secured. To clear any misconceptions about the
intention of the study, participants were informed on the purpose of the study,
benefits and harms of participation. After verbal consent was obtained from
each participant, questionnaires were distributed to participants and filled in
the presence of the data collectors. Codes were given to participants instead
of names to keep their responses confidential.
Statistical Analysis
The questionnaires were
cleaned, coded and data were entered into Statistical Package for the Social
Sciences (SPSS) version 21 software and analyzed. Frequency count and
percentage table was used in analyzing the demographic and socioeconomic
characteristics of the respondents.
RESULTS AND DISCUSSION
This study was designed
to assess the status and challenges of medical waste management practices in
Delta State University Teaching Hospital in order to ascertain if the waste
management procedure applied meets WHO standard for healthcare waste
management. To achieve these set out objectives; respondents of varying
categories were engaged with typeset questionnaires and personal interview.
Data collected were subjected to descriptive and statistical analysis.
Presented in Table 3 is the categories of medical waste as outlined by WHO
(2004). Table 4 contains summary details of generated waste in the study area
from March to August 2019. The
demographic and socio-economic representation of the sampled
respondents are presented in Table 5, whereas Figure 2 displays working
experience between health workers and waste handlers. Perceived facilities for
the collection and segregation of medical waste are shown in Table 6. Table 7
displays facilities for storage and transportation of medical waste; so also is
Table 8 which revealed with details on the perceived facilities for the
treatment and disposal of waste. Table 9 revealed the conditions of facilities
for waste handler and Table 10 deals with details on the condition of waste
storage facilities. Respondents perceived categories of medical waste generated
in the study area are displayed in Table 11; and Table 12 shows the perceived
impact of medical waste on the respondents. Analysis on respondents’ perceived
preventive measures for medical waste management and health workers
satisfaction are shown in Tables 13 and 14.
Table 3: Categories of
medical waste
|
Waste category
|
Examples
|
|
Infectious
waste
|
Waste that may contain pathogens. This
includes used dressings, swabs and other materials or equipment that has been
in contact with infected patients or excreta. It also includes liquid waste
such as blood specimen, faeces, urine and other
body secretions.
|
|
Pathological
waste
|
Waste from human tissues like
placentas, blood, body parts and fetuses. Anatomical waste is a sub-group of
pathological waste and consists of recognizable body parts.
|
|
Waste
Sharps
|
Needles, scalpels, infusion sets,
blades and broken glass
|
|
Pharmaceutical
waste
|
This includes expired pharmaceuticals
and items contaminated by pharmaceuticals (bottles, boxes) which are no
longer needed.
|
|
Genotoxic waste
|
Include substances with genotoxic properties that has
the capacity to cause genetic damage such as certain drugs and genotoxic chemicals.
|
|
Chemical
waste
|
Waste containing chemical substances
like film developer, laboratory reagents, solvents and disinfectants that
have expired and no longer needed.
|
|
Waste
with high content of heavy metals
|
This category of waste includes broken
thermometers, gauges, batteries and blood-pressure.
|
|
Pressurized
containers
|
This includes gas cartridges, cylinders
and aerosol cans.
|
|
Radioactive
waste
|
Waste containing radioactive substances
from radiotherapy and laboratory research.
|
|
General
waste
|
Papers, packaging materials,
kitchen-waste, cardboard, debris, x-rays sheets, garden waste, tins,
food-leftovers, and plastic bags
|
Source: WHO (2004)
A. Generation of
medical waste per department for the period
The assessment of
medical waste is very important because it helps in organizing the flow chart
of waste, stage by stage; all through from the point of generation to collection,
treatment and final disposal (Uddin et al., 2014). The quantity of waste
generated by any health institution can only be established through an
assessment process carried out specifically for that particular healthcare
organization. This is because the quantity of waste generated during a
particular timeframe depends on several factors and can as well help to provide
detailed holistic management plan. It is therefore imperative to measure
medical waste in order to identify the categories, nature and types of waste
generated as well as to map out effective management plan to combat the likely
negative impacts on human health and the general environment (Kelly,
2012).
Average total weight
generated medical waste per kg/day in the departments studied was 948.366
kg/day. This consisted of infectious and non-infectious waste. Within the study
period, the health institution with a 250-bed capacity recorded an average
number of 174 patients. Medical waste generation rate was 13.598 kg/patient/day
with an average bed per day generation rate of 1.133 kg/bed/day. Kitchen
department had the highest generation rate of 254.448 kg/day followed by
internal department (151.31 kg/day), emergency (133.65 kg/day); outpatient
clinics (131.37 kg/day); general surgery (94.22 kg/day) and least generation
coming from NET (9.11 kg/day). The recorded average generation rate for kitchen
department could probably be due to the number of patients’ visitors
patronizing the kitchen and staff whose shifts necessitate that they stay late
at the hospital. The overall waste generated at the internal department (151.31
kg/day) was slightly higher than the generation rate from emergency unit
(133.65 kg/day) even with the emergency ward recording higher average number of
patients. Laboratory department had a generation rate (18.508 kg/day) close to
the rate from X-ray department (19.25 kg/day). On the spot observation,
revealed that majority of the waste generated from the laboratory and X-ray
departments are infectious and of high risk; therefore requiring all necessary
measures to keep infectious waste from non-infectious wastes. This finding
agrees with the assertion made by Yashpal and Poonam (2000), that there is an urgent need to ensure that
infectious waste are separated from non-infectious waste. Reason is because
infectious waste, which constitutes about 10-15% when mixed with non-infectious
waste, can render the entire waste infectious. Also, the observed quantity of
generated wastes at the laboratory unit depended on two major factors: number
of tests per day and nature of these tests. It was established in this study
that the quantity of generated wastes is proportional to the number of tests
per day. This finding conform the assertion by Bdour et al. (2007). The total average weight
generated waste per kg/day in the departments studied were lower than the rate
reported by Farzadika et al. (2009) in Iran University of Medical Sciences teaching
hospital; Tesfahun et al.
(2014) in some selected Ethiopian public and private hospitals but
higher than the rate reported by Madhukumar and
Ramesh (2012) in medical college hospital, Bangalore.
Table 4: Summary of
generated waste at DELSUTH (March – August 2019)
|
Department
|
Average
total weight generated (kg/d)
|
Average
number of patients
|
Generation
rate (kg/patient/day)
|
Percentage
by total weight
|
|
General surgery
|
94.22
|
62
|
1.519
|
9.93
|
|
Emergency
|
133.65
|
375
|
0.356
|
14.093
|
|
Internal department
|
151.31
|
58
|
2.608
|
15.955
|
|
Neurology
|
13.42
|
9
|
1.491
|
1.41
|
|
Orthopedic
|
18.64
|
17
|
1.096
|
1.96
|
|
NET
|
9.11
|
11
|
0.828
|
0.961
|
|
Outpatient clinics
|
131.37
|
826
|
0.159
|
13.852
|
|
Operating theatre
|
78.01
|
23
|
3.391
|
8.23
|
|
X-ray unit
|
19.25
|
367
|
0.052
|
2.03
|
|
Pharmacy and Disinfection
|
11.09
|
-
|
-
|
1.17
|
|
Laboratory
|
18.508
|
139a
|
0.133b
|
0.019
|
|
Blood bank
|
15.34
|
31
|
0.494
|
1.62
|
|
Kitchen
|
254.448
|
173
|
1.471
|
26.830
|
|
Total
|
948.366
|
174
|
13.598
|
100
|
Total average weight
generated = 948.366 kg/day; average number of patients = 174; total number of
beds = 250 beds; generation rate = 13.598 kg/patient/day; generation rate 1.133
kg/bed/day.
a Number
of tests per day
b Kg/test/day
B. Demographic and
socio-economic representation of respondents
A total of 240
respondents participated in the study. Half of these respondents (50%) were
health workers in this order: medical doctors (12.5%), nurses (12.5%), pathologists
(12.5%) and laboratory technologists (12.5%). This was followed by waste
handlers (16.7%), out patients (16.7%) and residents (16.7%) (see Table 2). Further analysis revealed that 50% were female
respondents whereas the other 50% were their male counterparts. However,
majority of these female respondents were from the health workers and waste
handler cadre. Also, the analysis for the male respondents revealed that male
from health workers and out patients constituted over 75% of the total male respondents.
Out of the 240 respondents, the result revealed that a higher percentage is
within the age range of 31-40 years; followed by age range of 41-50 years and
below 30 years. Those above 61 years of age constituted only 3.3% from the
total respondents. Uniquely revealed from the study is that 42.5% from the 120
health workers’ respondents sampled were predominantly within the age range of
41-50 years; followed by age range of 31-40 years which constituted 31.7% and
age range of 51-60 years with a percentage ratio of 22.5%.
Table 5: Demographic
and socio-economic characteristics of the respondents
|
Categories
of Respondents
|
|
Variables
|
Health workers
|
Waste handlers
|
Out patients
|
Residents
|
Total
|
|
Gender
|
F
|
%
|
F
|
%
|
F
|
%
|
F
|
%
|
F
|
%
|
|
Male
|
72
|
60
|
13
|
32.5
|
18
|
45
|
17
|
42.5
|
120
|
50
|
|
Female
|
48
|
20
|
27
|
67.5
|
22
|
55
|
23
|
57.5
|
120
|
50
|
|
Sub-Total
|
120
|
100
|
40
|
100
|
40
|
100
|
40
|
100
|
240
|
100
|
|
Age
group
|
F
|
%
|
F
|
%
|
F
|
%
|
F
|
%
|
F
|
%
|
|
below
30 yrs
|
4
|
3.3
|
10
|
25
|
3
|
7.5
|
7
|
17.5
|
24
|
10
|
|
31
- 40 yrs
|
38
|
31.7
|
21
|
52.5
|
9
|
22.5
|
14
|
35
|
82
|
34.2
|
|
41
- 50 yrs
|
51
|
42.5
|
7
|
17.5
|
11
|
27.5
|
12
|
30
|
81
|
33.7
|
|
51
- 60 yrs
|
27
|
22.5
|
2
|
5
|
11
|
27.5
|
5
|
12.5
|
45
|
18.8
|
|
61
& above
|
0
|
0
|
0
|
0
|
6
|
15
|
2
|
5
|
|
3.3
|
|
Sub-Total
|
120
|
100
|
40
|
100
|
40
|
100
|
40
|
100
|
240
|
100
|
|
Level
of education
|
F
|
%
|
F
|
%
|
F
|
%
|
F
|
%
|
F
|
%
|
|
No
formal education
|
0
|
0
|
0
|
0
|
2
|
5
|
0
|
0
|
2
|
0.8
|
|
Primary
school
|
0
|
0
|
7
|
17.5
|
8
|
20
|
10
|
25
|
25
|
10.4
|
|
Secondary
school
|
0
|
0
|
29
|
72.5
|
17
|
42.5
|
14
|
35
|
60
|
25
|
|
Tertiary
institution
|
120
|
100
|
4
|
10
|
13
|
32.5
|
16
|
40
|
153
|
63.8
|
|
Sub-Total
|
120
|
100
|
40
|
100
|
40
|
100
|
40
|
100
|
240
|
100
|
|
Level of income
|
F
|
%
|
F
|
%
|
F
|
%
|
F
|
%
|
F
|
%
|
|
below 25,000
|
0
|
0
|
0
|
0
|
5
|
12.5
|
8
|
20
|
13
|
32.5
|
|
26,000 - 55,000
|
0
|
0
|
36
|
90
|
15
|
37.5
|
12
|
30
|
63
|
26.3
|
|
56,000 - 105,000
|
56
|
46.7
|
4
|
10
|
14
|
35
|
16
|
40
|
90
|
37.5
|
|
105,000 & above
|
64
|
53.3
|
0
|
0
|
6
|
15
|
4
|
10
|
74
|
30.8
|
|
Sub-Total
|
120
|
100
|
40
|
100
|
40
|
100
|
40
|
100
|
240
|
100
|
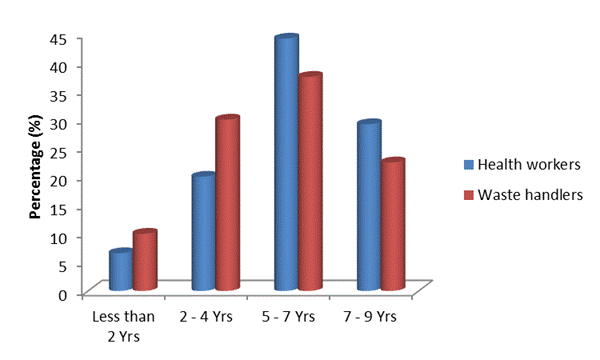
Figure
2: Chart showing working experience between health workers and waste handlers
Information as regard
the level of education attained by the respondents revealed that 0.8% had no
formal education; 10.4% had primary school certificates, 25% were secondary
school certificate holders and 63.8% had one form of degree or the other from a
tertiary institution. Overall average, revealed that majority of the
respondents are educated. This finding corroborated the submissions by Mokuolu (2009); Olubukola (2009)
and Awodele
(2016). Further finding revealed that 100% of the 120 respondents of health
workers sampled had one university degree or the other conforming that a
university degree is the minimum educational prerequisite to practice any major
medical profession in Nigeria. This results also supported the earlier
assertion made by Adegbita (2010) and Oli et al. (2016) in their research work
were they observed that health workers are among the most educated workforce in
developing countries. Outpatients with secondary school certificate outnumbered
other outpatient respondents with a percentage ratio of 42.5%; followed by
those who attended tertiary institutions (32.5%) and primary school certificate
holders (25%). Investigation on income of respondents revealed that respondents
with an income range of 56,000 – 105,000 had the highest percentage; followed by
those in the range of above 105,000 and below 25,000. Specifically, it was
revealed that a larger percentage of health workers constituted income wage of
56,000 – 105,000 and above 105,000. This was so because Nigeria is a country
where the level of education determines the monthly income of government
workers. Also revealed in the study was that all the respondents earned a
monthly income above the National Minimum wage which was pegged at 18,000
during this study.
Figure 2 revealed
details on working experience between health workers and waste handlers since
they are full time workers with the healthcare institution. 37.5% of the
sampled waste handlers have worked for 5-7 years, followed by 30% who have
worked for 2-4 years; 22.5% have worked for 7-9 years, whereas only 10% have
worked for less than 2 years. Among health workers, 44.2% were recorded for
those who have worked for 5-7 years; 29.2% for those with 7-9 years; 20% for
2-4 years and only 6.6% have worked for less than 2 years. Respondents in the
category of outpatients were asked the number of days stayed in the hospital
whereas respondents that were residents were asked to state the number of years
they have lived in the community where the healthcare institution operates. All
these criteria were read out to the respondents in order to ascertain how
knowledgeable the respondents were about the issue under study. Residents that
have lived between 1-2years and more than 2years recorded percentage ratio of
14.2% and 15.4% respectively. Among those that have resided in the study area
for a period of 1-10 years has a percentage score of 42.3%, whereas those that
have resided more than 10 years had 18.5% and less than a year had 9.6%. Among
the respondents that were outpatient, those that have been visiting the
healthcare institution for one medical challenge or another for the past one
year had a higher percentage of 48.1%.
B. Inventory of Medical
Waste Management Facilities
Handling and storage of
special medical waste consist of strategies for packaging at source and
packaging for transportation. For packaging at source, all categories of
medical waste are placed in leak-proof and disposable containers. Furthermore, Bdour et al.
(2007) noted in their study that the containers designed for sharp wastes
should be puncture proof. Glass containers generally are unsuitable based on
specific environmental protection reasons. Also, WHO (2004) recommended that
containers for pathological waste should be colour-coded
to indicate the level of risk. To ascertain and authenticate inventory of the
facilities used by the healthcare institution studied to segregate and collect
waste; the view of waste handlers and health workers were used as their
perception will provide a better reliable data to guide the researchers rather
than the perception of patients and residents, because they are more familiar
as well as major users of these facilities. Critical analysis as shown in Table
6, detailing the perception of waste handlers and health workers revealed
punctured proof containers to have the highest Waste Collection Index of 3.54
with a deviation of 0.28 from the mean. This was
followed by colour waste container having a WCI of
3.43 and deviation of 0.17 from the mean. It was also revealed that plastic bag
and colour coded bins had WCI that were slightly
below the mean with deviation of -0.03 and -0.04 respectively. Conveyor had Waste Collection Index value of 2.87 which was far below the mean and a deviation
of -0.39.
Table 6: Facilities for
the collection and segregation of medical waste
|
Facilities
|
Rating
|
F
|
SWV
|
WCI
|

|
(x-)
|
(x-)2
|
|
5
|
4
|
3
|
2
|
1
|
|
Puncture
proof containers
|
315
|
221
|
26
|
4
|
0
|
160
|
566
|
3.54
|
3.26
|
0.28
|
0.0784
|
|
Colour waste
container
|
340
|
125
|
53
|
31
|
0
|
160
|
549
|
3.43
|
0.17
|
0.0289
|
|
Plastic
bag
|
200
|
229
|
77
|
4
|
6
|
160
|
516
|
3.23
|
-0.03
|
0.0009
|
|
Colour coded bins
|
240
|
157
|
95
|
23
|
0
|
160
|
515
|
3.22
|
|
-0.04
|
0.0016
|
|
Conveyor
|
145
|
137
|
155
|
4
|
18
|
160
|
459
|
2.87
|
|
-0.39
|
0.1521
|
|
Total
|
|
16.29
|
|
|
0.2619
|
Lack of specific and
affordable transportation facilities in the management of healthcare
institution’s waste as well as lack of monitoring capacities have been reported
by several scholars in other parts of the world to hamper smooth medical waste
treatment and disposal options (Abor and Anton, 2008;
Ali and Kuroiwa, 2009; Path, 2009). Oke (2008) asserted
that to avoid waste accumulation, collection must be on a regular basis. Alagoz and Kocasoy (2007) noted
in their study that medical waste must be transported to a central storage area
within the healthcare institution before being treated and removed. According
to Yawson (2014), medical waste collection must
follow specific routes through the healthcare facilities to reduce the passage
of loaded carts from the wards and other clean areas. The carts should be easy
to load and unload as well have no sharp edges that can damage waste bags or
containers. Ananth et al. (2010) reported that transportation of medical waste has not
been given the attention needed. Results in Table 7 shows the
analysed rating difference on waste storage and transportation
facilities; which are mandatory for the smooth movement of medical waste from
on-site to off-site. The result revealed that lidded container has the
highest Waste Storing Index of 3.61 with deviation of 1.18 from the mean;
followed by storage house (WSI 3.41, deviation 0.98); hand cart (SWI 3.14,
deviation 0.71) and waste skip (SWI 2.99, deviation 0.56). It was also observed
that the mean was higher than the values of other facilities in descending
order: wheeled trolley (SWI 2.16, deviation -0.27); wheeled bin (SWI 1.84,
deviation -0.59); bin lorry (SWI 1.28, deviation -1.15) and wheelbarrow (SWI
1.01, deviation -1.42). This has also been reported by Ramokate and Basu (2009); Adegbita
et al. (2010) and Ananth et al. (2010), where in their various
studies they observed lidded containers, storage house and hand cart to be
among the majority of facilities needed for the storage and transportation of
special healthcare waste.
Table 7: Facilities for
storage and transportation of medical waste
|
Reasons
|
Rating
|
F
|
SWV
|
WSI
|
|
(x-)
|
(x-)2
|
|
5
|
4
|
3
|
2
|
1
|
|
Lidded
plastic container
|
350
|
189
|
29
|
10
|
0
|
160
|
578
|
3.61
|
2.43
|
1.18
|
1.3924
|
|
Storage
house
|
290
|
165
|
83
|
3
|
5
|
160
|
546
|
3.41
|
0.98
|
0.9604
|
|
Hand
cart
|
300
|
45
|
104
|
53
|
0
|
160
|
502
|
3.14
|
0.71
|
0.5041
|
|
Waste
skip
|
215
|
145
|
98
|
0
|
21
|
160
|
479
|
2.99
|
0.56
|
0.3136
|
|
Wheeled
trolley
|
0
|
165
|
113
|
51
|
16
|
160
|
345
|
2.16
|
|
-0.27
|
0.0729
|
|
Wheeled
bin
|
0
|
85
|
122
|
51
|
36
|
160
|
294
|
1.84
|
|
-0.59
|
0.3481
|
|
Bin
lorry
|
0
|
0
|
77
|
89
|
39
|
160
|
205
|
1.28
|
|
-1.15
|
1.3225
|
|
Wheelbarrow
|
45
|
0
|
0
|
31
|
86
|
160
|
162
|
1.01
|
|
-1.42
|
2.0164
|
|
Total
|
|
19.44
|
|
|
6.9304
|
Proper
selection of disposal sites is a prerequisite for efficient and effective
disposal of waste Bathma et al. (2012). Sites for treatment technology options must be located
far away from built environment and the disposal technology designed in such a
way that it meets standard to safeguard the environment. Results of facilities
for the treatment and disposal of medical waste as presented in Table 8
revealed landfill and incineration to have the highest values of WTI (waste
treatment index) of 3.63 and 3.61 respectively with 1.18 and 1.16 deviations
from the mean. Open pit dumping and composting also had positive WTI of 3.58
and 3.14. Other facilities according to the table hierarchy had values that
were less than the mean. The fact as represented in Table 8 revealed that
landfill and incineration are the most widely used means of disposing the
generated waste from the healthcare institution studied. This however disagree
with Madhukumar and Ramesh (2012), who reported
burial pit and landfill as the most commonly used measures to dispose medical
waste in medical college hospital, Bangalore.
Table 8: Facilities for
the treatment and disposal of medical waste
|
Reasons
|
Rating
|
F
|
SWV
|
WTI
|
|
(x-)
|
(x-)2
|
|
5
|
4
|
3
|
2
|
1
|
|
Land
fill
|
239
|
165
|
120
|
53
|
4
|
160
|
581
|
3.63
|
2.45
|
1.18
|
1.3924
|
|
Incineration
|
265
|
145
|
105
|
63
|
0
|
160
|
578
|
3.61
|
1.16
|
1.3456
|
|
Open pit burning
|
231
|
167
|
125
|
51
|
0
|
160
|
574
|
3.58
|
1.13
|
1.2769
|
|
Composting
|
190
|
143
|
105
|
62
|
3
|
160
|
503
|
3.14
|
0.69
|
0.4761
|
|
Steam
sterilization
|
45
|
122
|
68
|
53
|
24
|
160
|
312
|
1.95
|
-0.50
|
0.2500
|
|
Gas
disinfection
|
0
|
88
|
90
|
83
|
50
|
160
|
311
|
1.94
|
|
-0.51
|
0.2601
|
|
High-level
disinfection
|
0
|
0
|
113
|
79
|
56
|
160
|
248
|
1.55
|
|
-0.90
|
0.8100
|
|
Burial pits
|
0
|
0
|
0
|
145
|
73
|
160
|
218
|
1.36
|
|
-1.09
|
1.1881
|
|
Recycling
|
60
|
42
|
0
|
0
|
98
|
160
|
200
|
1.25
|
|
-1.20
|
1.4400
|
|
Total
|
|
22.01
|
|
|
8.4392
|
Considering the type of
waste segregation in view with the responses of waste handlers and health
workers sampled which accounted for 66.7% out of 240 respondents; 91.2% of them
revealed that there exist devisable means of segregating waste at source from
the point of generation in the study area; 48.6% of the respondents consented
that leak proof container is the major segregation facilities mainly used. The
observed finding in this study was consistent with the report by Mokuolu (2009) in another study in Nigeria. Furthermore,
27.4% of the sampled respondents affirmed coloured
coded bins as the facility used for segregating medical waste; whereas 9.6%
attested to coloured waste container as the major
segregation facilities used in the study area. Moreover, respondents who
affirmed plastic bag as the segregation devise accounted for 15.9%. Further
findings revealed that respondents who consented that
waste handlers went through the routine of waste management training in order
to equip them with detail background knowledge on risk associated with improper
medical waste handling were 75.2%.
Table 9: Conditions of
facilities for waste handler
|
Facilities for Handler
|
Rating
|
F
|
SWV
|
FCI
|
|
(x-)
|
(x-)2
|
|
5
|
4
|
3
|
2
|
1
|
|
Heavy duty gloves
|
390
|
129
|
102
|
23
|
0
|
160
|
644
|
4.03
|
2.39
|
1.64
|
2.6896
|
|
Protective
clothes
|
227
|
163
|
154
|
24
|
2
|
160
|
570
|
3.56
|
1.17
|
1.3689
|
|
Safety
shoes
|
215
|
165
|
120
|
16
|
0
|
160
|
516
|
3.23
|
0.84
|
0.7056
|
|
Goggles
|
128
|
65
|
115
|
35
|
0
|
160
|
343
|
2.14
|
-0.25
|
0.0625
|
|
Apron
|
48
|
72
|
66
|
29
|
13
|
160
|
228
|
1.43
|
|
-0.96
|
0.9216
|
|
Mask
|
55
|
0
|
135
|
11
|
7
|
160
|
208
|
1.30
|
|
-1.09
|
1.1881
|
|
Head
cap
|
0
|
0
|
98
|
45
|
22
|
160
|
165
|
1.03
|
|
-1.36
|
1.8496
|
|
Total
|
|
16.72
|
|
|
8.7859
|
Table 9 shows the
result on the assessment of health workers’ perceived condition of equipment
used by waste handlers in the study area for protection against possible health
risk associated with medical waste management. Result from the calculated
facility condition index (FCI) revealed heavy duty gloves which have the
highest value (FCI 4.03; deviation 1.64) top the equipment used by waste
handlers. This was followed by protective clothing (FCI 3.56; deviation 1.17)
and safety shoes (FCI 3.23; deviation 0.84). Other equipment in descending
order goggle (2.14); apron (1.43); mask (1.30) and head cap (1.03) were
observed to have recorded values that was below the mean with deviations
indicating negative sign.
Table 10: Condition of
waste storage facilities
|
Criteria for waste storage plant
|
Rating
|
F
|
SWV
|
SFI
|
|
(x-)
|
(x-)2
|
|
5
|
4
|
3
|
2
|
1
|
|
Good
accessibility
|
375
|
229
|
57
|
16
|
0
|
160
|
667
|
4.17
|
3.13
|
1.04
|
1.0816
|
|
Far from the hospital room
|
320
|
286
|
0
|
41
|
5
|
160
|
652
|
4.08
|
0.95
|
0.9025
|
|
Hygiene
and sanitation
|
240
|
130
|
180
|
43
|
0
|
160
|
593
|
3.71
|
0.58
|
0.3364
|
|
Exclusively
sited
|
82
|
282
|
81
|
25
|
0
|
160
|
470
|
2.94
|
|
-0.19
|
0.0361
|
|
Adequate
security
|
115
|
77
|
125
|
88
|
13
|
160
|
418
|
2.61
|
|
-0.52
|
0.2704
|
|
Close
to site door
|
0
|
0
|
77
|
70
|
58
|
160
|
205
|
1.28
|
|
-1.85
|
3.4225
|
|
Total
|
|
18.79
|
|
|
6.0495
|
The condition of waste
storage facilities were analysed in the study,
employing National Healthcare Waste Management standard guidelines for citing
waste storage plants. The opinion of respondents were sought in order to
ascertain if the criteria as stipulated in the National Healthcare Waste
Management Policy and National Healthcare Waste Management Plan (NHCWMP) were
met in citing the storage plants. From the results, good accessibility of
storage plant recorded the highest Storage Factor Index value (SFI) of 4.17.
Next indicator with a higher SFI value above the mean was far from the hospital
room (4.08); followed by hygiene and sanitation (3.71). Indicators like exclusively
sited (SFI 2.94), adequate security (SFI 2.61) and close to site door (SFI
1.28) had SFI values that were below the mean. Also observed from Table 10 is
that indicators in descending order from exclusively sited had negative
deviations (-0.19, -0.52 and -1.85) from the mean.
C. Respondents’
Perceived Medical Waste Generated
To determine the
appropriate waste disposal technology for medical waste, it is necessary to
estimate the quantities and compositions of waste generated per annual and
classify the waste based on their characteristics (Longe,
2012). Only after then can the different appropriate technologies
be selected, adopted and applied at different stages of medical waste
management. To ascertain the perceived view of respondents on the quantity of
waste generated in the study, the perception of all the entire categories of
respondents used were analysed in this section. Waste
generated from the study was categorized into eleven different types. This
categorization was in accordance with medical waste classification by WHO
(2014) and NHCWMP (2018). From the perceived view of respondents sampled during
the study period from March to August 2019; infectious waste was recorded as
the most generated waste in the study; having the highest Medical Waste Index
(MWI) value of 4.55 with deviation of 1.76 from the mean. Isolation waste was
observed to have the second highest MWI value of 4.53 and deviation of 1.74
(see Table 11). Other types of medical waste with recorded positive values from
the mean were waste sharps (3.58); pathological waste (3.30); chemotherapeutic
waste (3.18) and radioactive waste (2.94) respectively. Medical wastes like
general and pharmaceutical wastes; pressurized containers, chemical and genotoxic wastes had MWI values that were below the mean.
This lower MWI values recorded for these categories of medical waste reflects
low generation rate in the study.
Table 11: Respondents
perceived categories of medical waste generated
|
Categories of medical waste
|
MWI for the study area
|
MWI
|
MWI - *MWI
|
(MWI - *MWI)2
|
|
Health worker
|
Patients
|
Residents
|
|
Infectious
waste
|
4.54
|
4.68
|
4.43
|
4.55
|
1.76
|
3.09
|
|
Isolation
waste
|
4.57
|
4.34
|
4.69
|
4.53
|
1.74
|
3.03
|
|
Waste
sharps
|
3.91
|
3.72
|
3.11
|
3.58
|
0.79
|
0.62
|
|
Pathological
waste
|
3.30
|
3.49
|
3.12
|
3.30
|
0.51
|
0.26
|
|
Chemotherapeutic
waste
|
3.28
|
3.22
|
3.05
|
3.18
|
0.39
|
0.15
|
|
Radioactive
waste
|
3.14
|
3.01
|
2.68
|
2.94
|
0.15
|
0.02
|
|
General
waste
|
2.62
|
2.36
|
2.27
|
2.42
|
-0.37
|
0.14
|
|
Pharmaceutical
waste
|
2.03
|
2.45
|
2.00
|
2.16
|
-0.63
|
0.39
|
|
Pressurized
container
|
1.18
|
1.62
|
1.84
|
1.55
|
-1.24
|
1.54
|
|
Chemical
waste
|
1.06
|
1.37
|
1.16
|
1.19
|
-1.60
|
2.56
|
|
Genotoxic waste
|
1.01
|
1.22
|
1.58
|
1.27
|
-1.52
|
2.31
|
|
Total
|
30.64
|
31.48
|
29.93
|
30.67
|
|
|
|
*MWI
|
2.78
|
2.86
|
2.72
|
2.79
|
|
|
D. Effect of Medical
Waste to the Environment
Respondents’ perceived
impact of medical waste on the environment was analysed
and represented in Table 12. It is a known fact that the effects of medical
waste on human population and the environment varies in general. The major
impact of waste generated from the healthcare institution studied on the
environment was categorized and respondents’ opinion sought to ascertain the
most prevalent effect in the study area. The result revealed a recorded mean
Waste Effect Index (WEI) value of 3.49 in the study. Furthermore, it was
revealed that major effects such as offensive odour
had the highest WEI value of 4.72 and deviation of 1.23 from the mean. This was
followed by other effects like exposure to fugal and bacterial infection (4.28)
and airborne diseases (3.72) respectively. Two other effects (contaminated
groundwater -2.99 and radioactive diseases -1.76) had values that were lesser
than the mean in the study.
Table 12: Perceived
impact of medical waste on the respondents
|
Effects
|
WEI for the study area
|
WEI
|
WEI - *WEI
|
(WEI - *WEI)2
|
|
Health worker
|
Patients
|
Residents
|
|
Offensive
odour
|
4.97
|
4.52
|
4.69
|
4.72
|
1.23
|
1.51
|
|
Exposure
to fugal, bacterial and viral infection
|
4.43
|
4.06
|
4.36
|
4.28
|
0.79
|
0.62
|
|
Airborne
diseases
|
3.85
|
3.53
|
3.78
|
3.72
|
0.23
|
0.05
|
|
Contaminated
groundwater
|
3.32
|
2.66
|
3.01
|
2.99
|
-0.5
|
0.25
|
|
Radioactive
disease
|
1.87
|
1.89
|
1.52
|
1.76
|
-1.73
|
2.99
|
|
Total
|
18.44
|
16.66
|
17.36
|
17.47
|
|
|
|
*WEI
|
3.69
|
3.33
|
3.47
|
3.49
|
|
|
E. Preventive Measure
for Proper Medical Waste Management
Revealed in table 13
are respondents’ perceived preventive measures for medical waste management in
the study area. From the analysis, it was revealed that enforcement of
regulation had the highest Waste Preventive Index (WPI) value of 4.84 and
deviation of 1.15 from the mean. Respondents’ opinion as revealed in the result
further affirmed the finding that enforcing rules and regulations serve as
check and balance to stakeholders for strict adherence to standards in properly
managing medical waste. Other preventive measures as perceived by the
respondents are environmental management system (4.48); proper transportation
from on-site to off-site (3.94) and identification
of each hazardous waste (3.32)
respectively with deviations of 0.79; 0.25 and -0.37. Counting of total weight
of hazardous materials and recycling had the least WPI values of 3.15 and 2.39
respectively. This reveled that respondents do not consider these measures as
the best preventive measures from the effects of medical waste.
Table 13: Respondents’
perceived preventive measures for medical waste management
|
Preventive Measures
|
WPI for the study area
|
WPI
|
WPI - *WPI
|
(WPI - *WPI)2
|
|
Health worker
|
Patients
|
Residents
|
|
Enforcement
of regulation
|
4.97
|
4.59
|
4.97
|
4.84
|
1.15
|
1.32
|
|
Environmental
management system (EMS)
|
4.56
|
4.11
|
4.78
|
4.48
|
0.79
|
0.62
|
|
Proper
transportation from on-site to off-site
|
4.00
|
3.62
|
4.21
|
3.94
|
0.25
|
0.06
|
|
Identify
each hazardous waste
|
3.42
|
3.04
|
3.49
|
3.32
|
-0.37
|
0.14
|
|
Count
the total weight of hazardous materials
|
3.12
|
3.03
|
3.30
|
3.15
|
-0.54
|
0.29
|
|
Recycling
|
1.88
|
2.96
|
2.34
|
2.39
|
-1.30
|
1.69
|
|
Total
|
21.95
|
21.35
|
23.09
|
22.12
|
|
|
|
*WPI
|
3.66
|
3.56
|
3.85
|
3.69
|
|
|
F. Health Workers
Satisfaction
The perception of
health workers was used in this section to measure the criteria for staff
welfare that enhances their motivation to the job. Statistical analysis as
represented in Table 14, revealed workers’ welfare with Health Workers
Satisfaction Index (HIS) value of 3.14 as the most preferred option among the
listed criteria. This was followed by provision of equipment (HSI 3.13) with
deviation of 0.20 from the mean. Values of other criteria for staff welfare analysed were lower than the mean and had negative
deviation values from the mean. These are arranged in descending order in Table
14. This finding did not necessarily reflect that those criteria with negative
deviation values from the mean are not among the preferred options rather they
might not work effectively for health workers welfare in the study area.
Table 14: Health
workers satisfaction
|
Criteria for Welfare
|
Rating
|
F
|
SWV
|
HIS
|
|
(x-)
|
(x-)2
|
|
5
|
4
|
3
|
2
|
1
|
|
Workers
welfare
|
222
|
105
|
128
|
36
|
11
|
160
|
502
|
3.14
|
2.93
|
0.21
|
0.0441
|
|
Provision of equipment
|
215
|
173
|
59
|
38
|
16
|
160
|
501
|
3.13
|
0.20
|
0.0400
|
|
Training
for the handlers
|
220
|
109
|
59
|
58
|
21
|
160
|
467
|
2.92
|
-0.01
|
0.0001
|
|
Adequate
funding
|
205
|
117
|
71
|
52
|
19
|
160
|
464
|
2.90
|
-0.03
|
0.0009
|
|
Government
intervention
|
170
|
121
|
104
|
44
|
20
|
160
|
459
|
2.87
|
|
-0.06
|
0.0036
|
|
Adherence
to medical waste management procedure
|
135
|
97
|
125
|
24
|
36
|
160
|
417
|
2.61
|
|
-0.32
|
0.1024
|
|
Total
|
|
17.57
|
|
|
0.1911
|
CONCLUSION
Proper management of
medical waste generated is an integral aspect of public health and when
improperly managed can create conditions that may adversely impact on public
health and the environment. This study assessed the status and challenges of
medical waste management practices in Delta State University Teaching Health
Institution for a period of six months spanning from March to August 2019 in
order to ascertain the efficiencies of the managerial strategy adopted. The
study was sectionalized into two aspects; with the first covering analysis on
quantity of waste generated and the second, covering analysis on administered
questionnaires to the respondents. Average total weight generated waste from
all the departments studied was estimated to be 948.366 kg/day. This consisted
of infectious and non-infectious waste. Within the study period, the health
institution with 250-bed capacity recorded an average number of 174 patients.
Medical waste generation rate was 13.598 kg/patient/day with an average bed per
day generation rate of 1.133 kg/bed/day. Kitchen department had the highest
generation rate of 254.448 kg/day followed by internal department (151.31
kg/day), emergency (133.65 kg/day); outpatient clinics (131.37 kg/day); general
surgery (94.22 kg/day) and least generation rate coming from NET (9.11 kg/day).
The waste generation rate calculated in this study excluded seasonal variation.
It was observed that segregation of waste at source exist within the health
institution but poorly implemented and monitored as medical waste was still
being mixed and dumped with general wastes that are collected, transported and
disposed in a similar manner. Punctured proof containers, colour
waste containers and plastic bags were the most commonly used waste collection
and segregation equipment. It was observed that segregation was not conducted
according to NHCWMP standards. Waste generated within the institution were
collected on a daily basis and transported to a designated place for temporary
storage. Two waste handlers were assigned to each department to do collection
at different collection units. Lidded plastic container, storage house, hand
cart, waste skip and wheeled trolley were mainly used to store and transport
waste. A fundamental issue from the finding was insufficient waste containers
to handle volumes of medical waste. Analysis from the questionnaire
revealed that higher percentage of waste handlers were poorly educated.
Irrespective of the availability of personal protective equipments;
they were observed to be wrongly used by waste handlers. Land fill was revealed
to be the most preferred final disposal option used in the study area. However,
in some situation incineration and open pit burning were also adopted. This
study has helped to establish a baseline data and statistics on medical waste
management strategy in Delta State University Teaching Health Institution.
ACKNOWLEDGEMENTS
The authors gratefully appreciate the
permission granted by Delta State University Teaching Hospital to carry out
this research. The authors are highly indebted to research assistants used in
data collection. Staffs of Delta State Waste Management Board are also not left
out for their support.
Funding: No funding sources
Conflict of interest: None declared
REFERENCES
Abah,
S.O. and Ohimain, E.I. (2010). Assessment of Dumpsite
Rehabilitation Potential using the Integrated Risk Based Approach: A case study
of Eneka, Nigeria. World Appl. Sci. J., 8(4): 436-442.
Abah,
S.O. and Ohimain, E.I. (2011). Healthcare waste
management in Nigeria: A case study. Journal
of Public Health and Epidemiology, 3(3):99-110.
Abor,
P. A. and Anton, B. (2008). Medical Waste Management Practices in a
Southern African Hospital. International
Journal of Health Care Quality Assurance, 4:356-364.
Adegbita,
M.A., Nwafor, S.O., Afon,
A., Abegunde, A.A. and Bamise,
C.T. (2010).
Assessment of dental waste management in a Nigerian tertiary
hospital. Waste. manag.
Res., 28: 769-777.
Al Emad,
A.A. (2011). Assessment of medical waste management in the
main hospitals in Yemen. East Mediterr Health J., 17: 730-737.
Alagoz,
B.A.Z. and Kocasoy, G. (2007). Treatment and disposal
alternatives for health-care wastes in developing countries: A case study in
Istanbul, Turkey. Waste
Manag.
Res., 25: 83-89.
Ali,
M. and Kuroiwa, C. (2009). Status and Challenge
of Hospital Solid Waste Management: Case Studies from Thailand, Pakistan and
Mongolia. J Mater
Cycles Waste Management, 3:251-257.
Ananth,
A. P., Prshanthini, V. and Visvanathan,
C. (2010).
Healthcare Waste Management in Asia. Waste Management & Research,
30:154-161
Arab,
M., Baghbani, R.A., Tajvar,
M., Pourreza, A., Omrani,
G. and Mahmoudi, M. (2008). The Assessment of
Hospital Waste Management: A Case Study in Tehran. Waste Management & Research, 26:304-308.
Awodele, O., Adewoye, A.A. and Oparah, A.C.
(2016). Assessment
of medical waste management in seven hospitals in Lagos, Nigeria. BMC public health, 16(1):269-283.
Bathma, V., Likhar, S.K., Mishra, M.K., Athavale,
A.V. and Agarwal, S. (2012). Knowledge
assessment of Hospital Staff regarding Biomedical Waste Management in a
Tertiary Care Hospital. National
Journal of Community Medicine, 3: 197-200.
Bdour,
A., Altrabsheh, B., Hadadin,
N. and Al-Shareif, M. (2007). Assessment of medical
wastes management practice: A case study of the northern part of Jordan. Waste Management, 27:746–759
Coker,
A. (2009).
Medical waste management in Ibadan, Nigeria: Obstacles and Prospects. Waste Manag., 29(2): 804-811.
DaSilva,
C.E., Hoppe, A.E., Ravanello, M.M. and Mello, N.
(2005).
Medical wastes management in the south of Brazil. Waste Management, 25:600-605.
Draft
of the National Health Care Waste Management Policy in Nigeria (2018). Nigeria Basic Health
Care Provision Fund Project (BHCPFP). Prepared for the
Federal Ministry of Environment (FMENV). In collaboration
with John Snow Incorporation Nigeria (JSI). pp
22-36.
Edmund, J.J. (2012). Characterization and Analysis of Medical Solid Waste in Osun State, Nigeria. African Journal of Environmental Science and
Technology. 5(12):1027-1038.
Farzadika,
M., Moradi, A. and Mohammadi,
M.S. (2009).
Hospital Waste Management status in Iran: A case study in the teaching
hospitals of Iran University of Medical Sciences. Waste Manage. Res., 27: 384-389.
Ibekwe, R.U. (2015). Modifiable Risk factors of Hypertension and Socio‑demographic
Profile in Oghara, Delta State; Prevalence and
Correlates. Annals of Medical and
Health Sciences Research, 5(1):71-77
Kelly,
I. J. (2012).
Assessment of medical Waste Management practices in Selected Hospitals in
Kenya. Applied Journal of Environment
Research, 2(1):72-84
Longe, E.O. (2012). Healthcare waste
management status in Lagos State, Nigeria: A case study from selected
healthcare facilities in Ikorodu and Lagos
metropolis. Waste Management &
Research, 30(6): 562-571.
Madhukumar,
S. and Ramesh, G. (2012). Study about Awareness and Practices about Health Care Wastes
Management among Hospital Staff in a Medical College Hospital, Bangalore. International Journal of Basic Medical
Science, 3: 7-11.
Mbu, A.D. (2015). The Influence of Environmental Awareness on Human Attitude to Solid
Waste Management in Boki Local Government Area of
Cross River State. J. Pollut. Eff. Cont. 3:14-24.
doi:10.4172/2375-4397.1000144
Mokuolu, M.O. (2009). Improving the Management of Solid Hospital Waste in a Nigerian
Tertiary Hospital. The Free Library.
(September, 25). http://www.thefreelibrary.com
/Improving+the+Management+of+Solid+Hospital+Waste+in+A+Nigerian...-a01073990
679. Retrieved 29/1/2011.
Nwachukwu,
N.C., Chuks, N., Orji, F.A. and Ugbogu,
O.C. (2013).
Health Care Waste Management: Public Health Benefits and the Need for Effective
Environmental Regulatory Surveillance in Federal Republic of Nigeria. Available
from: http://www.intechopen.com/books/current‑topics‑in‑public‑health. Retrieved 31/5/
2017.
Oke, I.A. (2008). Management of immunization solid wastes in Kano state, Nigeria.
Waste Manage., 28: 2512-2521.
Oli, A. N., Ekejindu,
C. C., Adje, D. U., Ezeobi,
I., Ejiofor, O. S., Ibeh,
C. C., and Ubajaka, C. F. (2016). Healthcare
waste management in selected government and private hospitals in Southeast
Nigeria. Asian Pacific Journal of
Tropical Biomedicine, 6(1):84-89.
Olubukola, B.O. (2009). Comparative Analysis of Health Care Waste Management Practice in
Two General Hospitals in Nigeria. Available at http://www.eco-web.com/edi/index.htm.
Retrieved 28/1/2011.
Omofunmi,
O. E., Agwagu, H. C. and Atuche,
A. L. (2016).
Assessment of Medical Waste Management in Private Hospitals. FUOYE
Journal of Engineering and Technology, 1(1):100-104
Path,
I.A. (2009).
Achieving effective sharps waste management in GAVI host
countries. A proposed approach with estimates of cost.
Available at http://.www.path.org/files/TS _ach_eff_swm.pdf.
Retrieved 27/1/2009
Ramokate,
T. and Basu, D. (2009). Health care waste
management at an academic hospital: Knowledge and practices of doctors and
nurses. South African Medical Journal
99: 444-445.
Tesfahun, E., Kumie,
A., Legesse, W., Kloos, H.
and Beyene, A. (2014). Assessment of composition and
generation rate of healthcare wastes in selected public and private hospitals
of Ethiopia. Waste Management &
Research, 2(1)38-49.
Uddin,
M.N., Islam, M.R. and Yesmin, K. (2014). Knowledge
on Hospital Waste Management among Senior Staff Nurses Working in a Selected Medical
College and Hospitals in Bangladesh. Journal
of Waste Management, 1:1-5. http://dx.doi.org/10.1155/20
14/573 069.
World
Health Organization, (1999). Unsafe injection practices and transmission
of blood borne patogens. Bull. World Health Org., 77:787-819.
World
Health Organization, (2002). Wastes from healthcare activities. Fact sheet no 231, April 2002. Available
at http://www.who.int/mediacentre/factsheets/fs231/en/. Retrieved
12/9/2009.
World
Health Organization, (2014). Safe management of wastes from health-care
activities. Chartier, Y., Emmanuel, J.,
Pieper, U., Prüss, A., Rushbrook,
P., Stringer, R,. Townend,
W., Wilburn, S. and Zghondi, R. (eds). 2nd edition. pp 103.
Yashpal,
S. and Poonam, M. (2000). Hospital waste
management: An insight approach. http://www.janani.org/sops/surya
- clinic/hospital–waste–mgt.pdf. Retrieved 14/6/ 2015
Yawson, P. (2014). Assessment of Solid Waste Management in Healthcare Facilities in Offinso Municipality. M.Sc Thesis in Environmental
Science. Department of Environment Science, Kwame
Nkrumah University of Science and Technology. Unpublished.
pp 42-46.
|
Cite this Article: Chukumah CO; Ndinwa GCC; Akpafun S (2019). A
Study to Assess the Status and Challenges of Medical Waste Management
Practices in a University Health Institution, Southern Nigeria. Greener Journal of Environmental
Management and Public Safety, 8(1):25-39.
|