INTRODUCTION
The two distinct phenomena;
salt stress and salt shock are both triggered by the application of salt.
However, the terminologies ‘salt shock’ and ‘salt stress’ are used
interchangeably, the salt stress is the exposure of plants to salinity, the
main component has been the NaCl in two ways either by gradual exposure to
increasing levels of NaCl or by exposure to low levels of salinity, and could
be both ways (Yuri, 2013). On the other hand, a salt shock is an extreme form
of salt stress, where the plants are exposed suddenly to a high level of
salinity. The two main components of salt stress/shock are mechanisms
responsible for salinity tolerance in plants involving both tolerances to
osmotic and ionic stresses (Munns and Tester, 2008). Induction of salt shock
leads to the immediate response of osmotic shock due to large differences in
osmolarity (osmotic pressure) between external solutes with a high
concentration of NaCl and internal in the cell cytoplasm. The osmotic phase causes inhibition of water
uptakes as a result of increased salt content in the soil around the roots
(Munns and Tester, 2008). The mechanism to reduce the effect of osmotic stress
has been attributed to osmotic adjustment, in which the plants accumulate more
both inorganic and organic solutes (Munns et al., 2020). Other important
mechanisms to confront osmotic stress have been directed to reduce
transpiration leading to water loss, which depends on stomatal closure and
stomatal density (Flowers et al., 2010; Albaladejo, 2017). In addition, ionic stress is the specific
component of salt stress that the plants experience when growing in saline
soils. Halophytes in this regard are considered as Na+ - includers
that is, their tolerance is associated with high Na+ accumulation in
the leaves (Flowers et al., 2010). The mechanisms also involved either removing
the added Na+ from cells through membrane-bound Na+/H+
antiporters or via sequestration of excess Na+ and K+
into the leaf vacuoles through the antiporters in the membrane such as proton
exchangers Na+/H+ (Blumwald and Pool, 1985; Zhu, 2000;
Bassil et al., 2012). Additionally, ion homeostasis is ubiquitous to membrane
proteins that catalyzed the electroneutral exchange of Na+ and or H+
across the membrane, thereby playing an essential role in cellular Na+/K+
and pH homeostasis (Rodriguez-Rosales et al., 2009; Leidi et al., 2010;
Barragán et al., 2012). The calcium-permeable non-selective cation channels
(NSCC) contribute both directly and indirectly to the Na+ entry into
the cell. The influx of Na+ through these channels stimulates
depolarization of the plasma membrane, activating K+
outward-rectifying channels (KOR) thereby reducing the net passive K+
uptake through the inward-rectifying K+ channels (KIR) (Demidchik et
al., 2003; Demidchik et al., 2014; Albaladejo, 2017). Accumulation of cGMP
suppressed the influx of Na+ by deactivation process via NSCC and
allow the apoplastic Ca2+ into the cell cytoplasm through cyclic
nucleotide-gated channels (CNGC). Increase cytoplasmic Ca2+ indicates
abiotic stress, and consequently, triggers cascade reactions via the activation
of cytosolic calcium induces calmodulin (CaM)-dependent kinases leading to the
activation of other plasma membranes H+-ATPases (Bose et al.,
2014a). Restoring membrane voltage and inhibiting depolarisation-activated NSCC
and processes that lead to the reduction of Na+ influx into the cell
and efflux of K+, improve plant tolerance to salt stress have been
considered to be important response mechanisms (Yadav et al., 2012; Shabala,
2003; Bose et al., 2014a; Mostofa et al., 2015).
Investigation
of these membrane transporters like SOS1 (Salt Overly Sensitive 1), which
excludes Na+ out of the root and facilitates its loading into the
xylem, High-Affinity Potassium Transporters 1 (HKT1s), which involved in Na+
retrieval from the xylem under salt stress, as well as NHX1 (Na+/H+
exchanger 1) to develop salt-tolerant plants has been reported (Munns et al.,
2012; Nieves-Cordones et al., 2016; Jaime-Pérez et al., 2017). For example,
High-Affinity Potassium Transporters (HKTs), which perform functions of Na+/K+
symporter and Na+ uniporter present in the plasma membrane of
different plant crops including wheat, rice, and Arabidopsis have been
shown to improve cytoplasmic K+ and salt-tolerant (Waters et al.,
2013). Research by Berthomieu et al. (2003) reported the critical role of HKTs
in sodium recirculation in Arabidopsis from the shoots to the roots by
carrying Na+ from the shoot into the phloem and subsequently
releasing it back into the roots. Different isoforms of HKT genes, HKT1;4
isolated from salt-tolerant durum wheat cultivars expressed in Xenopus oocytes
have been shown to exhibit higher Na+ selectivity (Daldoul et al.,
2014). Also, Sunarpi et al. (Sunarpi et al., 2005) have reported the
localization of HKTs proteins to the membrane of xylems' parenchyma cells and
linked it to salt tolerance in Arabidopsis. They also reported that the
overexpression of HKT in Arabidopsis HKT1; 1 in the root stele causes
improvement by 37-64% in resilient phenotype. In addition, Salt Overly
Sensitive transporters such as (SOS1) have been reported to involve in the
transportation of Na+ as indicated by studies carried out on mutant
yeast that lacks Na+-ATPases and Na+/H+
antiporter activity (Kinclova-Zimmermannova et al., 2004). Further studies
indicated that AtSOS1 transporters work as anti-porters in Na+
transport in Arabidopsis plants (Shi et al., 2003;
Kinclova-Zimmermannova et al., 2004). Overexpression of SOS1 genes isolated
from a halophyte Salicornia brachiate has been shown to improve salt tolerance
in tobacco (Yadav et al., 2011). An excess Na+ accumulation distorts
by altering the K+ homeostasis, in such a manner that the Na+/K+
ratio has been considered as an indicator of salt tolerance index not only in glycophytes
but also in halophytes (Cai and Gao, 2020; Kiani-Pouya et al., 2020).
Therefore, K+ transporters could be key determinants of salt
tolerance, which include KT, and KUP (KT/HAK/KUP family).
Different
forms of B. oleracea have been
selected by farmers for domestication to
produce crops with distinct uses and characteristics such as broccoli, Brussels
sprouts, cabbage, cauliflower, and kale, among others. The diversification of B. oleracea, caused by selection
processes, leads to a differentiation of several botanical varieties or groups,
such as Italica, gemmifera, capitata, botrytis, and acephala, corresponding,
respectively, to the above-mentioned crops (Branca et al., 2011). The wild B. oleracea are adaptive to many
environmental conditions and show a level of tolerance against abiotic factors,
including temperature, salinity, and water stresses (Ashraf et al., 1999;
Ashraf et al., 2008; Cuartero et al., 2006). The cultivated B. oleracea and its wild species are
included in the primary gene pool (Thampson et al., 2010; Peter et al., 2012).
Higher allelic diversity found in the wild species is rich in variability than
in the cultivated one (Thampson et al., 2010; Peter et al., 2012).
Characterization and exploitation of such variability in the wild B. oleracea C – genome would pave a way
for improving brassica oleracea vegetables and facilitate crop breeding and
conservation strategies (Peter et al., 2012). The use of doubled haploid lines
in hybrid production helps to reduce the time for plant breeding (Thampson et
al., 2010; Peter et al., 2012). The advantages of using DH lines include the
elimination of residual heterozygosity and heterogeneity and also help in the
assessment of quantitative traits (Peter et al., 2012). Accurate assessment of the
levels and patterns of genetic
diversity can be useful in
crop breeding for diverse
applications which include; analysis of genetic variability in cultivars (Smith and Dinnen-Zopfy, 1984; Cox et al.,
1988), identifying diverse parental combinations to
create segregating progenies with maximum
genetic variability for further
selection (Barrett and Kidwell,
1998), and introgression of desirable genes from diverse germplasm into the available genetic base (Thompson et al., 2010). In this research work, homozygous DH
lines “Diversity Fixed Foundation Sets” (DFFS) developed from the F1 materials
derived from crosses between the wild parent Brassica oleracea S1
lines and the founder lines (DHSL150) of the core collections using microspore
culture was utilized (Pink et al., 2008).
Therefore,
in the present study, we aimed to examine the effects of sudden salt shock,
exposure to 250 mM NaCl and monitor the early response of the parent lines; the
wild Brassica oleracea, and cultivated rapid-cycle DHLS150 and DH lines.
At the same time, we have taken physiological and gene expression approaches to
get an insight into the initial salt response mechanisms by assessing
parameters like mineral homeostasis and qRT-PCR analysis of the expressed genes,
and by comparing the early response between the parent and DH lines would
establish and unravel the mechanism employed by B. oleracea, and show the
effect of traits introgression between the parent and DH lines.
MATERIALS AND METHODS
Seed Collections
The seeds were from Gene Bank, Warwick Crop Centre, Wellesbourne Campus,
the University of Warwick, UK. The six accession lines of wild S1 parent lines,
rapid-cycle founder line (DHLS150), and seven accession lines of doubled
haploids (DHs) were collected and sowed in 4 x 10 tray filled with M2 Compost
soil and kept under a controlled environment Glasshouse, Phytobiology Unit,
University of Warwick.
Growth
Chamber Condition, Soil Compositions, and Seeds
Sowing
The growth chamber was a controlled glasshouse
with an average temperature between 200 C day and 180 C night. It was supplemented with available light (400 W SONT
lamps), photoperiod, which was set at 03:00 – 19:00 hrs to ensure photosynthesis. The growth chamber was also
maintained under a reliable controlled internal environment, containing air
handling and drainage for the enhancement of natural light penetration, and pest
control combined with alternative energy solutions to reduce the carbon
footprint. An
M2 soil compost used was designed to suit the growth of a wide variety of
bedding plants. It provides a good quality nutrient supply, and its
physicochemical constituents include; pH = 5.3 – 6.0, nitrogen (N) = 192 mg/L,
phosphorus (P) = 98 mg/L, and potassium (K) = 319 mg/L and finally, the size of
the soil particle is between 0 – 10 mm respectively. The seeds were sown using
two seeds per hole in a 20 x 10 plastic tray filled with M2 compost soil. Germination was monitored between 6 – 7 days after seeds were sown and
then daily for a period of three weeks. As described, fully germinated seeds
were when radicles had fully emerged from the seed coat and out of the soil
compost. They were regularly watered twice per week for a period of four weeks
(28 days) and re-transplanted into the bigger pots (7 cm x 10 cm) at week six
before set-out into a completely randomized experimental design.
Salt Shock Recruitment
Experiment 1
In the first screening experiment for salt shock
stress, two (2) accessions of the wild B. oleracea: B. oleracea (C07079A-S1) and B.
bourgaei (C07007-S1), and a founder
rapid-cycle line DHSL150 (C04099) and four accessions of doubled haploid
(DH) lines: C10025-DH, C13001-DH, C10121-DH, and C10128-DH were recruited.
Experiment 2
In the second salt shock experiment, related
accession lines, not in experiment one (1) were further selected and the DH
lines derived from the F1 materials of those wild accessions based on the
outcome of the first screening experiment were selected to further study their response mechanisms to salt shock stress. These include the main founder line (DHLS150), B.
bourgaei (C07007-S1), B. oleracea (C07060-S1), and B. oleracea
(C07079A-S1), and the DH lines: C10025-DH, C13013-DH, C13001-DH, C10128-DH, and
C10121-DH, respectively.
Salt Shock Stress Inducement and Sample Collections
The salt shock was induced when the plants were at 42 days old (6
weeks) using a single dose of freshly prepared 250 mM NaCl on the treated plants while untreated plants (control) were administered
only tap water. Salt leakages through an opening beneath the plants were
blocked using a plastic cover throughout the experimental period to ensured
maximum treatment. Twenty-four hours post-treatment (24 hr pt), samples from
leaf-four (#4) were collected in an Eppendorf, quickly flash-frozen in liquid
nitrogen, and 50 mL test tubes of both treated and non-treated plants for both
RNA and mineral analyses. The plants were watered 24 hr pt after samples were
collected with non-salty water and on day 14 post-treatment (2 weeks pt),
another set of samples from leaf five (#5) as described, and all samples were kept at -800 C for RNA
analysis until used.
ICP-MS Analysis of Mineral Content
A
0.5g of the harvested leaves material (oven-dried at 80 0C
for 12 hr) was finely grounded using
pestle and mortar, to expose more surface area that ensures complete
digestion efficiency was placed into a standard 50 mL PTFE digestion
tubes. 2 mL of 69% ICP-MS grade nitric acid was added, and
loaded into the microwave digestion system (MARSX
5 CEM Corporation, USA), for 34 minutes. The concentrations of Na+,
K+, and Ca2+ were determined using ICP – MS (Agilent 7500
series) in the Department of Chemistry, University of Warwick.
Gene Expression Analysis
RNA
Isolation and Reverse transcription
RNA isolation was
carried out strictly as according to the manufacturer's guidelines using an
RNeasy Plant mini kit (QIAGEN) and the quality and quantity of the RNA were checked
using a Nanodrop spectrophotometer (Thermo Fisher Scientific; Waltham, USA) and
the RNA integrity was verified on a 1.5% agarose gel. The cDNA, briefly, was
synthesized by using an equivalent volume representing 2.5μg of the
extracted RNA. Two masters mixed were prepared; the first one was made in a 1.5
ml Eppendorf tube which contained an equivalent of 2.5μg total RNA,
1μl oligo (dT) primer (20 mM) and DEPC-treated used to make up the volume
to 20μl. The content was mixed and centrifuged briefly and incubated at 650 C for 5 min.
The second master-mixed was prepared using 10.0μl 5xRT buffer, 5.0μl
DTT (20 mM), 1.0μl of premixed dNTPs, and 0.5μl RT Superscript II
respectively. The tubes were placed on ice for 2 min before being placed in the
water bath at 650
C. A 16.5μl of the second prepared master-mixed was pipetted into
each tube, and the final volume was brought up to 50μl with molecular
water and mixed. The tubes were then incubated at 420 C for 1 hr after which the
synthesized cDNA was diluted with 200μl of molecular water and the quality
of each synthesized cDNA was tested using a Nanodrop spectrophotometer (Thermo
Fisher Scientific; Waltham, USA) and kept at -20 0C until required.
qRT-PCR
Assay of Stress Responsive Genes
Changes in the
expression of ten stress-responsive genes involved were quantified using
quantitative real-time PCR analysis. These are selected membrane ion
transporter transcripts that showed significant variation in both tolerant and
susceptible lines obtained from RNA-Seq (data not shown) exposed to salt shock
were chosen for qPCR validation (Table
1.0). Transcript-specific primers were designed to amplify a specific
cDNA sequence of the transcripts in our samples. The sequences of mRNAs of the
transcripts of interest were obtained by using their individual transcripts IDs
and downloaded from
(https://plants.ensembl.org/Brassica_oleracea/) were blasted at
(https://www.ncbi.nlm.nih.gov/blast/). The primers were designed using
DNASTAR (Lasergene 14) software. The parameters used are as follows: Tm,
550C to
620C,
differences not >20C between the primers in a pair was insured; primer length, 19-
24 bp; GC content, 45-55%; amplicon length, 100-150 bp. Whenever possible,
primers were designed to span introns and caution was made to insured that only
primer (forward and reverse) yielding a single product in conventional PCR and
qPCR was used in the validation. Quantitative PCR (qPCR) was performed using an
Mx3005P multiplex quantitative PCR system (Agilent Stratagene). 5.0μl cDNA
samples prepared from the total RNA extracted from three biological replicates
of the experimental plants were used. A master-mixed was prepared using
10.0μl SYBGREEN as a detection probe and 2.5μl each of primer pair
(Forward and Reverse). Plate set-up was prepared using a randomized design
using a color code that represents treated and the control samples in three
replicates randomly, each sample was included three times per pair primer and
with the housekeeping primer genes (b-Tubulin).
The qPCR thermocycler was set using the parameters; denatured
temperature, 95 0C
for 5 min; annealing temperatures, 62 – 55 0C for 1.0 min, and 720 C for 30 sec and 45 cycles.
DISCUSSION
Plants exposed to higher salt experience stress due to the
accumulation of Na+ and Cl- ions, which cause membrane damage, nutrient imbalance,
enzymatic inhibition, and metabolic dysfunction (Munns and Tester, 2008). The
basic response of plants exposed to higher salt has been K+ efflux from
the cells caused by excess Na+ (Nedjimi
and Daoud, 2009). The huge Na+ influx in the plant growth medium would create a
plasma membrane depolarisation which further activates membrane-bound cation
channels, the guard cell outward rectifying potassium channels (GORK), which
stimulate Na+ diffusion
into the cell, and K+ efflux thereby increasing Na+ content (Blumwald et al., 2000;
Demidchik et al., 2002). Salt-induced stress disrupts the K+/Na+ ratio and
interferes with K+
homeostasis (Siaei et al., 2012; Tuncturk et al., 2008).
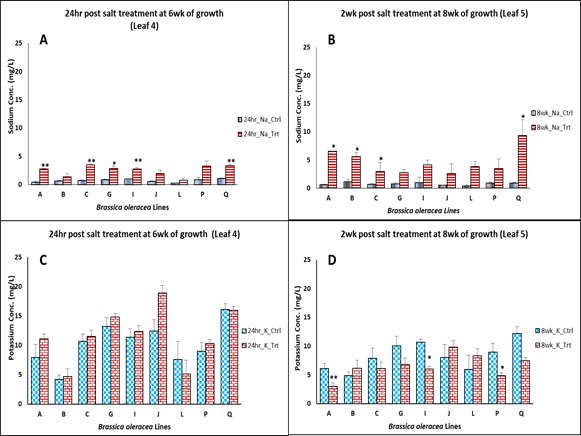
From the results, it was observed that salt stress-induced
causes an increase in leaf Na+ content twenty-four hours post-treatment in all
the B. oleracea lines. An increase in Na+ leaf content following salt stress
has been reported in many studies (Essah, 2002; Yasar et al., 2002; Kusvuran et
al., 2007) and that of canola genotypes (Tuncturk et al., 2011). The level of
potassium was affected two weeks post-treatment. Reduction in potassium level due
to salt stress was widely reported e.g., studies by (Ashraf et al., 2008;
Essah, 2002; Yasar et al., 2006; Li et al., 2006; Badeh-Hagh et al., 2008).
Potassium plays a critical role in the neutralization reactions of anion and
regulates cell membrane polarisation, osmoregulation, likewise being an
important factor in the activity of some enzymes that are involved in many
metabolic pathways (Very et al., 2014). The reduction of potassium level was
attributed to the entry of the higher amount of Na+ into plant roots
cell by non-selective cation channels (NSCC) that cause K+ efflux or
leakage through guard cell outward rectifying potassium channel (GORK) and
stellar K+ outward
rectifying channel (SKOR) (Rahman et al., 2017). Other potassium transporters
that might be implicated are membrane-bound protein channels actively involved
in the transportation of potassium like Shaker K+ channel, High-affinity potassium
(HAK), potassium uptake (KUP), potassium transporter (KT), and high-affinity
potassium transporter (HKT) amongst others (Very et al., 2014; Wang and Wu,
2013; Shabala and Pottosin, 2014).
Higher Na+ accumulation was observed two-week post-treatment leading to a
reduction of K+/Na+ ratio, which
might be a result of disruption of ion homeostasis. The Na+ influx and K+ efflux have
been associated with increased ROS production that could lead to the activation
of NSCC (Maathuis, 2009). A similar report has shown that higher Na+
could lead to disruption of ion homeostasis under salt stress conditions (Tuncturk
et al., 2008; Wu and Wang, 2012). From the results, the Ca2+ level has
been relatively unaffected in all the B. oleracea genotypes despite
higher Na+ in
the growth medium. Research has shown that the addition of exogenous calcium in
salt medium promotes membrane stability, thus ameliorating salt toxicity by
decreasing Na+ influx
through NSCC and indirectly inhibiting K+ efflux through the GORK channel in
plants (Nedjimi and Daoud, 2009; Shabala and Posttosin, 2014; Essah et al.,
2003; Shabala et al., 2006). More so, exogenous calcium has been shown to cause
a reduction in the uptake and transport of Na+ and further prevent it from binding
to the cell wall (Kurth et al., 1986; Rubio et al., 2003). Other functions of
cellular and vacuolar calcium include blockage of the fast vacuole (FV) channel
in a voltage-dependent and independent reaction preventing Na+ from being
leaked back into the vacuole and ultimately their transport into the cell
(Albaladejo, 2017; Tikhonova et al., 1997). Improved Ca2+ level observed in B.
oleracea genotypes might be attributed to the improved K+ level
observed thus, leading to a higher K+/Na+ ratio. Although an increase in Na+ leaf content
was observed, the B. oleracea lines were able to improve and retain
their Ca2+ level.
This could be a plus to the wild S1 and DH lines because optimum concentrations
of Ca2+ have been shown to play a crucial role in both
physiological processes of plants and increase plant resistance to abiotic
stresses and a higher extracellular Ca2+/Na+ ratio causes a reduction in Na+ influx
(Rengel, 2006). In addition, Ca2+ participates in the regulatory mechanism
thereby enabling the plants to adjust to adverse conditions; high temperature,
cold injury, drought stress, and salt stress (Arora et al., 2000; Bowler and
Fluhr, 2000; Mozafari et al., 2008; Joshi et al., 2012).
The voltage-gated dependant chloride channels were reported
to be located in the thylakoids membrane in Arabidopsis which function
in fine-tuning the proton motive force (PMF) and enable plants to adjust the
variability of light during photosynthesis (Andrei et al., 2015). Under salt
stress conditions, excess Cl- anions tend to affect membrane polarisation and
the electrochemical gradient thus, affecting the cytoplasmic pH. Most of the critical
enzymes present in thylakoids are of photosynthetic importance, for example,
ribulose -1, 5- bisphosphate carboxylase/oxygenase (Rubisco), an important
regulatory enzyme in Calvin Cycle, which was reported to be affected by
salinity stress (Bose et al., 2017). Our result shows that the relative
expression of V-CLC was higher in some B. oleracea genotypes 24
hr pt and showed reduced expression 14 ds post-treatment. This could suggest
its significance in safeguarding the chloroplasts from deleterious effects of
excess Cl- ion
under salt stress but not necessarily reducing the excess cytoplasmic sodium,
because these B. oleracea genotypes have shown higher sodium leaf
content 24 hr post-treatment (Figure 4).
High-affinity
potassium transporter family are proteins that act both as Na+/K+ symporter
and or uniporter. Studies have proven their presence in the plasma membrane in
the different plant's cell membranes, viz.
include; wheat, rice, and Arabidopsis, and their role in salinity
tolerance (Waters et al., 2013). Analysis of our result has shown that KT9 and
KUP11 were both expressed 24 hr post-treatment in some B. oleracea genotypes.
Potassium transporter genes are of a three-member family in plants, namely;
Shakers K+ channel,
HAK (High-Affinity K)/KUP (K Uptake)/KT (K Transporter), and HKT
(High- affinity K Transporter) and are active at the plasma membrane (Wang and
Wu, 2013; Shabala and Pottosin, 2013; Very et al., 2014). Under salt stress
conditions, plants struggle to maintain a certain level of potassium
concentrations to counterbalance the effects of excess sodium to ensure their
osmotic potential (Shabala and Pottosin, 2014; Su et al., 2002). Potassium
plays a critical role in enzymes activities as a cofactor and in the regulation
of water movement into the cell to maintain cell turgor. Positive expression of
KT and KUP11 in some B. oleracea genotypes can be a
counter mechanism to reduce the effects of excess sodium, particularly in K+-Na+ homeostasis.
Studies indicate that AKT1 in P. tenuiflora (PutAKT1) was
up-regulated under both excess/deficient potassium conditions and under salt
conditions, which signifies its role in potassium homeostasis (Ardie et al.,
2010). Also, its overexpression has been shown to improve salt tolerance in Arabidopsis
through an increased K+ uptake (Ardie et al., 2010). The expression of these genes by B.
oleracea genotypes could be the reason for their improved Na+/K+ ratio
two-week post-treatment (Figure 5).
Plants Ca2+ - ATPases are of two classes; IIA and IIB:
i.e., Type IIA endoplasmic reticulum bound (ECA as ER-type Ca2+-ATPase) and
type IIB, which auto-inhibit Ca2+- ATPase (ACA) (Baxter et al., 2010). The
endoplasmic reticulum-bound ECA2 isoform has shown lower relative expression
following salt stress in all B. oleracea lines. Although no report was
available to suggest the key role of ECA2 in salt tolerance, some
studies have suggested its possible involvement in potassium and calcium
transport (Edelist et al., 2009). For example, using constitutive expression
studies, genes related to KT1, KT2, and ECA1 have shown to be
associated with SOS1 genes that regulate both potassium and calcium
transport in the halophyte H. paradoxus (Edelist et al., 2009).
From our
results, the level of relative expression of NHX1 a membrane ion transporter,
and tonoplast-bound Na+/H+ exchangers has shown to be
highly expressed in some B. oleracea genotypes that were shown to have high K+/Na+
ratios (Figures 2 & 5) and less expressed in others that showed a
reduction in K+/Na+ ratio. Many studies have described
the vacuolar NHX1 proteins as integral membrane antiporters that catalyze the
exchange of cations across tonoplast membrane under the influence of
electrochemical gradient generated by the activities of other vacuolar H+-ATPases
and other proton pumps (Blumwald et al., 2000; Yao et al., 2010; Xu et al.,
2013). In Arabidopsis, different isoforms of Na+/H+
exchanger (NHX) i.e., NHX1-4 have been identified to involve in K+/Na+
exchange, for H+ in the vacuole (Bassil et al., 2012; Barragán et
al., 2012; McCubbin et al., 2014). Regulation of cytoplasmic pH is critical to
plant cells under salinity stress, several studies involving E. coli, yeast,
plants, and animal have suggested that NHX-type antiporters act mechanistically
to leak protons out to fine-tune the luminal pH of specific intracellular
compartments (Reguera et al., 2014). High expression of NHX1 and V-type-ATPases
in B. oleracea genotypes 24 hr pt may be as a result of excess Na+ and other
protons. This could lead to significant membrane depolarization thus causing
transport of excess ions to the vacuole under an electrochemical gradient
established by V- type-ATPases, i.e., V-type-a and V-type-G genes whose were
shown to be highly expressed in some B. oleracea genotypes in response to salt
stress. Another important role played by NHX1 genes, in addition to
sequestration, have been associated with cytosolic K+ uptake into
the cell vacuole, as reported by studies of nhx1/nhx2 knockout (Barragán et
al., 2012; Liu et al., 2013). These observations were further elaborated were
it shown that overexpression of NXH1 genes in transgenic soybean led to a
reduction of Na+ in the shoots and more of K+ in both roots and
shoots, suggesting its role in K+ homeostasis (Liu et al., 2013). Under salt
stress conditions, an appreciable K+/Na+ ratio is
critical to the plants' survival as established by studies using two amaranth
species (Estrada et al., 2021). It was reported that transgenic rice expressed higher
NHX1genes exhibits higher K+ content in shoots under salt
environment (Estrada et al., 2021). Importantly, some of our B. oleracea
genotypes have shown high expression of NHX1 genes and improved K+/Na+
ratio two-week post-treatment (Figure 4).
CONCLUSION
In
conclusion, the main mechanism used by B. oleracea to maintain
osmotic homeostasis could be based on its ability to reduce excess Na+
and improve K+ uptake under salt shock stress. Furthermore, the high
constitutive expression levels of genes involved in Na+ and K+
homeostasis could be a key point in the osmotic tolerance displayed by the wild
S1 parent as against the founder DHLS150 cultivated line. The study constituted
an important turning point and advances our knowledge on the doubled haploid
(DH) lines that were first exposed to salt shock, the response indicates a
level of introgression of traits and can be a milestone in the study of
brassica vegetables. Finally, the DH lines could also be used further on
research related to full salinity stress to unravel more efficient responses by
the fact that they grow quickly and within a short time, not like the wild S1
parent lines.
Funding: This
research received no external funding.
Acknowledgments: The
sponsorship by the Tertiary Education Trust Funds (TetFunds), Nigeria, and John
Carder, Luca Illing, Christine Hicks, and Petter Walley for their technical and
advisory support.
Conflict of Interest:
The
authors declare no conflict of interest.
REFERENCES
Albaladejo
I. (2017). Unraveling the strategies used by the wild tomato species Solanum
pennellii to confront salt stress: from leaf anatomical adaptations to
molecular responses. Environmental Experimental Botany 135 1–12. DOI:
10.1016/j.envexpbot. 2016.12.003
Andrei AS, Robeson MS, Baricz A, Coman C, Muntean V, Ionescu
A, Etiope G, Alexe M, Sicora IC, Poder M, Banciu HL (2015). Contrasting
taxonomic stratification of microbial communities in two hypersaline meromictic
lakes. ISME Journal 9:26-42. DOI: https://doi.org/10.1038/ismej.2015.60.
Ardie
S, Liu S, Takano T (2010). Expression of the AKT1-type K+ channel gene from
Puccinellia tenuiflora, PutAKT1, enhances salt tolerance in Arabidopsis. Plant
Cell Reproduction 29: 865–874.
Arora
A, Byrem TM, Nari MG, Strasburg GM (2000). Modulation of liposomal membranes
fluidity by flavonoids and isoflavonoids. Arch Biochemistry and Biophysics
373:102–109
Ashraf
MY, Khan AH, Azmi AR and Naqvi SSM (1999). Comparison of screening techniques
used in breeding for drought tolerance in wheat. In: Proc. New Genetical
Approaches to crop improvement II. Ed. Naqvi, S.S.M. pp.513-525.
Ashraf
M, Athar HR, Harris PJC, Kwon TR (2008). Some prospective strategies for
improving crop salt tolerance. Advanced Agronomics 97: 45–110
Ashraf
M, McNeilly T (2008). Salinity tolerance in Brassica oilseeds. Critical Review
Plant Science 23(2): 157-174.
Bandeh-Hagh A, Toorchi M, Mohammadi A, Chaparzadeh N,
Hosseini SG and Kazemnia H (2008). Growth and osmotic adjustment of canola
genotypes in response to salinity. Journal of Food Agriculture and
Environment 6, 201–208.
Barragán
V, Leidi EO, Andrés Z, Rubio L, De Luca A, Fernández JA, Cubero B and Pardo JM
(2012). Ion exchangers NHX1 and NHX2 mediate active potassium uptake into
vacuoles to regulate cell turgor and stomatal function in Arabidopsis. Plant
Cell Online 24, 1127–1142.
Barrett
BA, Kidwell KK (1998). AFLP-based genetic diversity assessment among wheat
cultivars from the Pacific North West. Crop Science 38:1261-1271.
Bassil
E, Coku A and Blumwald E (2012). Cellular ion homeostasis: emerging roles of
intracellular NHX Na+/H+ antiporters in plant growth and development. Journal
of Experimental Botany 63, 5727–5740.
Bassil E, Tajima H, Liang YC, Ohto MA, Ushijima K, Nakano R,
Esumi T, Coku A, Belmonte M, Blumwald E (2011a). The Arabidopsis Na+/H+ antiporters
NHX1 and NHX2 control vacuolar pH and K+ homeostasis to regulate
growth, flower development, and reproduction. Plant Cell 23:3482–3497.
Baxter I, Brazelton JN, Yu DN, Huang YS, Lahner B et
al. (2010). A Coastal Cline in Sodium Accumulation in Arabidopsis
thaliana is driven by Natural Variation of the Sodium Transporter AtHKT1; 1. Plos
Genetics 6.
Berthomieu
P, Conejero G, Nublat A, Brackenbury WJ, Lambert C et al. (2003). Functional
analysis of AtHKT1 in Arabidopsis shows that Na+ recirculation by the phloem is
crucial for salt tolerance. EMBO Journal. 22:2004–14.
Blumwald E, Aharon GS, Apse MP (2000). Sodium transport
in plant cells. Biochemistry and Biophysics
Acta 1465 140–151.
10.1016/S0005-2736(00)00135-8
Blumwald E, Pool R (1985). Na+/H+ antiport
in isolated tonoplast vesicles from storage tissue of Beta
vulgaris. Plant Physiology 78: 163-167.
Bose J, Munns R, Shabala S, Gilliham, M, Pagson B, Tyerman SD
(2017). Chloroplast function and ion regulation in plants growing on saline
soils: lessons from halophytes. Journal Experimental Botany 10.1093/jxb/erx142
Bose
J, Rodrigo-Moreno A, Shabala S (2014a).
ROS homeostasis in halophytes in the context of salinity stress
tolerance. Journal Experimental Botany 65:1241–1257 DOI: 10.1093/jxb/ert430
Bowler C and Fluhr R (2000). The role of calcium and
activated oxygens as signals for controlling cross-tolerance. Trends Plant
Science 5, 241–246. DOI: 10.1016/S1360-1385(00)01628-9.
Branca
F, Cartea E (2011). Brassica. In: Kole C. (ed.), Wild crop relatives: genomic
and breeding resources, Vol. Oilseeds, 17-36. Springer, Heidelberg, Dordrecht,
London, New York. DOI 10.1007/978-3-642-14871-2_2.
Cai
ZQ and Gao Q (2020). Comparative physiological and biochemical mechanisms of
salt tolerance in five contrasting highland quinoa cultivars. BMC Plant Biology
20:70. DOI: 10.1186/s12870-020-2279-8.
Cox TS, Shroyer JP, Ben-Hui L, Sears RG, and Martin TJ
(1988). Genetic Improvement in Agronomic
Traits of Hard Red Winter Wheat Cultivars 1919 to 1987. Crop Science 28:
756-760 https://doi.org/10.2135/cropsci1988.0011183X002800050006x
Cuartero
J, Bolarín MC, Asíns MJ and Moreno V (2006). Increasing salt tolerance in the
tomato. Journal of Exprimental Botany 57, 1045–1058. doi: 10.1093/jxb/erj102.
Daldoul S, Amar AB, Guillaumie S, Mliki A (2014). Integration
of omics and system biology approaches to study grapevine (Vitis vinifera L.)
response to salt stress: a perspective for functional genomics-a review. OENO
One 48(3):189-200.
Demidchik
V, Davenport RJ, Tester M (2002). Nonselective cation channels in plants.
Annual Review of Plant Biology 53, 67–107
Demidchik
V, Shabala SN, Coutts KB, Tester MA, Davies JM (2003). Free oxygen radicals
regulate plasma membrane Ca2+ and K+ - permeable channels
in plant root cells. Journal of Cell Science 116, 81–88.
Demidchik
V, Straltsova V, Medvedev SS, Pozhvanov GA, Sokolik A, Yurin V (2014).
Stress-induced electrolyte leakage: the role of K?-permeable channels and
involvement in programmed cell death and metabolic adjustment. Journal
Experimental Botany 65:1259–1270
Edelist C, Raffoux X, Falque M et al. (2009). Differential
expression of candidate salt-tolerance genes in the halophyte Helianthus
paradoxus and its glycophyte progenitors H.
annuus and H. petiolaris (Asteraceae). American
Journal of Botany 96: 1830–1838.
Essah
PA, Davenport RJ, Tester M (2003). Sodium influx and accumulation in
Arabidopsis thaliana. Plant Physiology 133:307–18.
Essah
TA (2002). Effect of salinity stress on growth and nutrient composition of
three soybeans (Glycine max (L.) Merrill) cultivars. Journal of Agro and Crop
Science 188:86-93.
Estrada
Y, Fernández-Ojeda A, Morales B, Egea-Fernández JM, Flores FB, Bolarín MC and
Egea IU (2021). Unraveling the Strategies Used by the Underexploited Amaranth
Species to Confront Salt Stress: Similarities and Differences With Quinoa
Species. Frontier of Plant Science 12:604481. DOI: 10.3389/fpls.2021.604481
Flowers
TJ, Galal HK and Bromham L (2010). Evolution of halophytes: multiple origins of
salt tolerance in land plants. Functional Plant Biology 37, 604–612. DOI:
10.1071/FP09269.
Jaime‐Pérez N, Pineda B, García‐Sogo B, Atares A, Athman A, Byrt CS, Olías R, Asins MJ, Gilliham M,
Moreno V, Belver A (2017). The sodium transporter encoded by the HKT1; 2 gene
modulates sodium/potassium homeostasis in tomato shoots under salinity. Plant,
Cell & Environment 40(5):658-71.
Joshi M, Mishra A and Jha B (2012). NaCl plays a key role
for in vitro micropropagation of Salicornia brachiata,
an extreme halophyte. Industrial Crops Production 35, 313–316. DOI:
10.1016/j.indcrop.2011.06.024.
Kiani-Pouya
A, Rasouli F, Shabala L, Tahir AT, Zhou M and Shabala S (2020). Understanding
the role of root-related traits in salinity tolerance of quinoa accessions with
contrasting epidermal bladder cell patterning. Planta 251:103. DOI:
10.1007/s00425-020-03395-1
Kinclova-Zimmermannova O, Flegelova H, Sychrova H (2004).
Rice Na+/H+-antiporter Nhx1 partially complements the
alkali-metal-cation sensitivity of yeast strains lacking three sodium
transporters. Folia Microbiologica 49(5):519-25.
Kurth
E, Cramer GR, Lauchli A, Epstein E (1986). Effects of NaCl and CaCl2 on cell
enlargement and cell production in cotton roots. Plant Physiology 82: 1102-1106
Kusvuran
S, Ellialtioglu S, Yasar F, Abak K (2007). Effects of salt stress on ıon
accumulations and some of the antioxidant enzymes activities in melon (Cucumis
melo L.), International Journal of Food Agriculture Environment 2(5):
351- 354.
Leidi EO, Barragan V, Rubio L, El-Hamdaoui A, Ruiz MT, Cubero
B et al. (2010). The AtNHX1 exchanger mediates potassium compartmentation in vacuoles of
transgenic tomatoes. Plant Journal 61 495–506.
10.1111/j.1365-313X.2009.04073.x
Li
WYF, Wong FL, Tsai SN, Phang TH (2006). Tonoplast-located GmCLC1 and GmNHX1
from soybean enhance NaCl tolerance in transgenic bright yellow (BY)-2 cells.
Plant Cell and Environment 29, 1122-1137.
Liu Z, Bao H, Cai J, Han J, and Zhou L (2013). A novel
thylakoid ascorbate peroxidase from Jatropha curcas enhances
salt tolerance in transgenic tobacco. International Journal of Molecular
Science 15, 171–185. DOI: 10.3390/ijms15010171.
Livak
KJ and Schmittgen TD (2001). Analysis of relative gene expression data using
real-time quantitative PCR and the 2(-Delta Delta C (T)) method. Methods 25,
402–408. DOI: 10.1006/meth.2001.1262.
Maathuis
FJM (2009). Physiological functions of mineral macronutrients. Current Opinion
Plant Biology 12:250–258.
McCubbin T, Bassil E, Zhang S, Blumwald E (2014). Vacuolar Na+/H+ NHX-type
antiporters are required for cellular K+ homeostasis, microtubule
organization, and directional root growth. Plants (Basel)
3:
409–426
Mozafari
H, Kalantari KM, Olia’ie MS, Torkzadeh M, Salari H, Mirzaei S (2008). Role of
calcium in increasing tolerance of Descurainia sophia to salt stress.
Journal Agriculture and Social Science 4: 53–58.
Munns
R and Tester M (2008). Mechanisms of salinity tolerance. Annual Review Plant
Biology 59, 651–681. DOI: 10.1146/annurev.arplant.59.032607. 092911
Munns
R, Day DA, Fricke W, Watt M, Arsova B, Barkla BJ et al. (2020). Energy costs of
salt tolerance in crop plants. New Phytol 225, 1072–1090. DOI:
10.1111/nph.15864
Munns
R, James RA, Xu B, Athman A, Conn SJ, Jordans C et al. (2012). Wheat grain
yield on saline soils is improved by an ancestral Na+ transporter gene. Nature
Biotechnology 30, 360–364. DOI: 10.1038/nbt.2120
Nedjimi B, Daoud Y (2009). Ameliorative effect of CaCl2 on
growth, membrane permeability, and nutrient uptake in Atriplex
halimus subsp. schweinfurthii grown at high (NaCl) salinity. Desalination 249 163–166.
10.1016/j.desal.2009.01.019
Nieves-Cordones
M, Al Shiblawi FR and Sentenac H (2016). “Roles and transport of sodium and
potassium in plants,” in The Alkali Metal Ions: Their Role for Life, eds A.
Sigel, H. Sigel, and R. K. O. Sigel (Cham: Springer) 291–324. DOI:
10.1007/978-3-319-21756-7-9
Peter
GW, Graham RT, Jonathan DM, Charlotte JA, David ACP, Buchannan-Wollaston V, Guy
CB (2012). Developing genetic resources for pre-breeding in Brassica
oleracea L.: an overview of the UK perspective. Journal of Plant
Biotechnology 39:62-68 DOI: dx.doi.org/10.5010/JPB.2012.39.1.062
Pink
D, Bailey L, McClement S, Hand P, Mathas E, Buchannan-Wollaston V, Astley D,
King G, Teakle G (2008). Double haploids, markers and QTL analysis in vegetable
brassicas. Euphytica 164:509-514.
Rahman
MM, Rahman MA, Miah MG, Saha SR, Karim MA, Mostofa MG (2017). Mechanistic
Insight into Salt Tolerance of Acacia auriculiformis: The Importance of Ion
Selectivity, Osmoprotection, Tissue Tolerance, and Na+ Exclusion.
Frontier of Plant Science (8) DOI: 10.3389/fpls.2017.00155.
Reguera M, Bassil E, Blumwald E (2014). Intracellular
NHX-type cation/H+ antiporters in plants. Molecular Plant 7(2):261-3. DOI:
10.1093/mp/sst091. PMID: 23956073.
Rengel Z (2006). The role of calcium in salt toxicity. Plant,
Cell & Environment 15. 625 - 632. 10.1111/j.1365-3040.1992.tb01004.x.
Rodriguez-Rosales
MP, Galvez FJ, Huertas R, Aranda MN, Baghour M, Cagnac O and Venema K (2009).
Plant NHX cation/proton antiporters. Plant Signal. Behaviour 4, 265–276.
Rubio F, Flores P, Navarro JM and Martınez V (2003).
Effects of Ca2+, K+, and cGMP on Na+ uptake
in pepper plants. Plant Science 165, 1043–1049. DOI:
10.1016/S0168-9452(03)00297-8
Shabala
S, Demidchik V, Shabala L, Cuin TA, Smith S. J, Miller AJ, Davies JM, Newman IA
(2006). Extracellular Ca2+ ameliorates NaCl-induced K+ loss from Arabidopsis
root and leaf cells by controlling plasma membrane K+ - permeable channels.
Plant Physiology 141, 1653–1665.
Shabala
S, Pottosin I (2014). Regulation of potassium transport in plants under hostile
conditions: implications for abiotic and biotic stress tolerance. Plant
Physiology 151:257–279
Shi
H, Wu SJ, Zhu JK (2003). Overexpression of a plasma membrane Na+/K+ antiporter
improves salt stress tolerance in Arabidopsis. Nature Biotechnology 21, 81-85.
Smith
SD, Dinnen-Zopfy B and Nobel PS (1984).
High-temperature responses of North American cacti. Ecology 65: 643-651.
Su H, Golldack D, Zhao C, Bonert HJ (2002). The expression of
HAK-type K+ transporters is regulated in response to salinity stress in common
ice plants. Plant Physiology 129:1482-1493.
Sunarpi HT, Motoda J, Kubo M, Yang H, Yoda K et al. (2005). Enhanced salt
tolerance mediated by AtHKT1 transporter-induced Na unloading from xylem
vessels to xylem parenchyma cells. Plant Journal 44:928–938.
10.1111/j.1365-313X.2005.02595.x
Thompson
MJ, Ocampo MD, Egdane J, Rahman MA, Sajise AG et al. (2010). Characterizing
the Saltol quantitative trait locus for salinity tolerance in rice. Rice 3:
148-160.
Tikhonova
LI, Pottosin II, Dietz KJ, Scho¨nknecht G (1997). Fast activating cation
channel in barley mesophyll vacuoles Inhibition by calcium. The Plant Journal
11, 1059–1070.
Tuncturk M, Tuncturk R, Yasar F (2008). Changes in
micronutrients, dry weight, and plant growth of soybean (Glycine
max L. Merrill) cultivars under salt stress. African Journal of Biotechnology 7 1650–1654.
Tunçtürk
M, Tunçtürk R, Yıldırım B, Çiftçi V (2011). Effect of salinity
stress on plant fresh weight and nutrient composition of some Canola (Brassica
napus L.) cultivars. African Journal of Biotechnology 10(10):1827-1832.
Véry AA, Nieves-Cordones M, Daly M, Khan I, Fizames C,
Sentenac H (2014). Molecular biology of K+ transport across the
plant cell membrane: what do we learn from the comparison between plant
species? J. Plant Physiology 171:748–769.
10.1016/j.jplph.2014.01.011
Wang Y, Wu WH (2013). Potassium transport and signaling in
higher plants. Annual Review Plant Biology
64:
451–476.
Waters S, Gilliham M, Hrmova M (2013). Plant high-affinity
potassium (HKT) transporters involved in salinity tolerance: structural
insights to probe differences in ion selectivity. International Journal
Molecular Science 14(4):7660-80.
Wu GQ, Wang SM (2012). Calcium regulates K+/Na+ homeostasis
in rice (Oryza sativa L.) under
saline conditions. Plant Soil Environment 58 121–127.
Xu S, Zhu S, Jiang Y, Wang N, Wang R, Shen W, Yang J (2013).
Hydrogen-rich water alleviates salt stress in rice during seed germination. Plant
and Soil 370(1):47-57.
Yadav
S, Irfan M, Ahmad A, Hayat S (2011). Causes of salinity and plant
manifestations to salt stress: a review. J Environ Biology 32:667–685
Yao
X, Horie T, Xue S, Leung HY, Katsuhara M, Brodsky DE, Wu Y, Schroeder JI
(2010). Differential sodium and potassium transport selectivities of the rice
OsHKT2; 1 and OsHKT2; 2 transporters in plant cells. Plant Physiology
152:341–355.
Yasar
F, Kusvuran S, Ellialtıolu S (2006). Determination of antioxidant
activities in some melon (Cucumis melo L.) varieties and cultivars under salt
stress. J. Horticulture Science and Biotechnology 81(4): 627-630
Yuri
S (2013). Salt stress or salt shock: which genes are we studying? Journal of
Experimental Botany 64(1):119-127. DOI: 10.1093/jxb/ers316.
Zhu
JK (2000). Genetic analysis of plant salt tolerance using Arabidopsis. Plant
Physiology 124:941–948.