Greener Journal of Science, Engineering and Technological Research
ISSN: 2276-7835
Submitted: 27/06/2015
Accepted: 17/07/2015
Published: 16/09/2015
Research
Article (DOI http://doi.org/10.15580/GJSETR.2015.2.062715085)
Effect of Weight on Moisture Content
and Drying Rate of Different Species of Fish
Evbuomwan B.O.; Okoh L.; Ogboada J.A.
Department of Chemical Engineering, University of Port Harcourt,
Port Harcourt, Nigeria
Corresponding Author’s E-mail: ogboadajustice@ gmail. com
ABSTRACT
This study was carried out to determine the effect
of weight on moisture content and drying rate of different species of fish, a
laboratory dryer was used at a constant temperature of 60oC with four
different types of fish (mackerel, sardine, croaker and cat fish) cut into 50g
and 100g weights. It was observed that sardine has the least moisture content
for 50g sample while croaker has the least moisture content for 100g sample
after drying. Croaker has fastest drying rate
both for 50g and 100g, it dried faster in 50g than 100g. The Single
factor Analysis of Variance shows that the higher the weight of sample test
the less significant difference in the moisture content and drying weight of
different species of fish.
Keywords : Cat fish, Mackerel; Sardine; Croaker; Drying rate; Moisture
content; ANOVA.
INTRODUCTION
Fish is a very important foodstuff in developing countries, in areas
where cold preservation techniques
are often missing. Spoilage of fish
refers to the term used in change in
fish’s normal state, such changes can be detected by touch or sight, smell and
taste. Quality losses can occur very rapidly after catch leading to spoilage
due to factors such as moisture, microbial growth, oxygen and temperature
(Opara et al, 2013). Fish normally spoil within 12 – 20 hours depending on the
species and the methods of capture. If the fishes are not processed immediately
after they are captured, certain
irreversible spoilage and deterioration reactions begin to take place (Conne,
1995). Fish spoils at different rates as a result of difference in surface properties
of fish. Microbial growth mainly takes place at the surface; spoilage is
probably to some large extent a consequence of bacterial enzymes diffusing into
the flesh and nutrient diffusing to the outside. The flesh of healthy live or
new caught fish is sterile as the immune system of the fish prevents the
bacterial from growing in the flesh, when the fish immune system collapse and
the bacterial are allowed to proliferate freely. Most bacteria thrive in a
temperature range of 65F to 100⁰F, if fish is stored in a location with an ambient temperature of less than 65⁰F,
bacterial growth will be slowed. Bacteria
growth will stop at temperature below 0⁰F and
hence preserving the fish from spoilage.
Fish drying means extraction of water from the fish by heating (Arason et al., 1992). Fish drying is an
age long practice across the world. It is one of the methods of processing
fish. Also the preservation of fish
by salting and drying is achieved by lowering the water activity (aw)
of the fish flesh (Ismail and Wooton, 1992). Water activity measures the
availability of water in fish flesh
(Jason, 1958).
Traditional techniques for improving preservation and
storage are Brinning/salting, drying or smoking, picking and spicing and
canning. It has been observed that drying is the most convenient and cheapest
method of preservation (Eyo, 1986). Major problems with traditional sun drying
are loss of quality due to contamination resulting from infestation by animals.
Fish drying methods vary from species to species based on the type of end
product and its quality requirement. In some countries, the fish are boiled
before being dried. Sun drying of fishes is a traditional practice followed in
many parts of the world (Sachithananthan et al., 1985, N’Jai, 1985).
The effects of weight
on temperature and drying of different
species of fish using different processing methods have been studied. The
experimental investigation on biochemical, microbial and sensory properties of
mackerel (Rastrilliger kangurta) dried by solar-biomass hybrid cabinet dryer by
Chavan et al (2008). The development
and performance evaluation of a motorized fish smoking kiln. Was studied by
Ashaolu Michael O. (2014). Studies on Drying Characteristics of Prawn and Fish was carried out by
Kamalakar et al. (2013). The
effect of smoke-drying temperatures and time on physical and nutritional
quality parameters of Tilapia
(Oreochromis niloticus) was studied
by Idah and Nwankwo (2013).
It has been observed that different processing and
drying methods have different effects on the shell life, moisture content and
drying rate of fish. The objectives of this study are to determine the effect
of the weight on moisture content and drying rate of different species of fish
(mackerel, cat fish, Sardine and croaker).
MATERIAL AND
METHODS
The four different fish samples; mackerel, sardine, croaker and cat fish were bought from Choba market in Port
Harcourt, Rivers State, Nigeria. The samples were
cleaned (descaled and degutted) and was washed thoroughly with tap water to make sample free from
foreign material and also to remove blood stains and slime, surface water from
samples were been removed by placing on a sieve, to drain out moisture. The
samples were cut into different sizes with the aid of a stainless steel knife into different masses 50g and 100g by
using a triple beam balance for
measuring their masses. The samples were arranged on dryer tray, before
charging it into the oven dryer.
Experiment
The samples were gutted into
various sizes and length. 50g and 100g of sardine, catfish, croaker, and
mackerel were weighed respectively
with the aid of a triple beam balance. The oven dryer was preheated for about 3minutes, and set to
an ambient temperature 60⁰C. The samples were arranged sequentially on the tray dryer, the
first is a cat fish 50g and 100g, the second row mackerel 50g and 100g, the
third row sardine 50g and 100g and lastly croaker 50g and 100g. The initial
time of which the samples were charged to the dryer was recorded and at every 30 minutes the
fish is brought out of the oven dryer and the loss in the weight is recorded,
the experiment is carried out for a period of 3days and recorded time
420minutes throughout the experiments.
RESULTS AND DISCUSSION
The effect of weight on temperature and drying of
different species of fish samples, after 420 minutes recorded time of drying,
monitoring, observation and operation the following results were obtained as tabulated
Table 1: Drying rate and moisture content of cat fish.
|
TIME (MINUTES)
|
CAT FISH
|
|
Mean mass 50g
after drying
|
Mean mass 100g
after drying
|
50g mass
|
100g mass
|
|
DRYING
RATE dW/dT
|
MOISTURE CONTENT
(%)
|
DRYING
RATE dW/dT
|
MOISTURE CONTENT
(%)
|
|
0
|
50.00
|
100.00
|
0.000
|
100.00
|
0.000
|
100.00
|
|
30
|
48.00
|
93.30
|
0.067
|
96.00
|
0.223
|
93.30
|
|
60
|
42.10
|
91.00
|
0.197
|
84.20
|
0.077
|
91.00
|
|
90
|
41.00
|
90.00
|
0.037
|
82.00
|
0.033
|
90.00
|
|
120
|
39.50
|
85.30
|
0.050
|
79.00
|
0.157
|
85.30
|
|
150
|
38.00
|
82.00
|
0.050
|
76.00
|
0.110
|
82.00
|
|
180
|
37.80
|
81.30
|
0.007
|
75.60
|
0.023
|
81.30
|
|
210
|
37.50
|
81.10
|
0.010
|
75.00
|
0.007
|
81.10
|
|
240
|
36.40
|
74.50
|
0.037
|
72.80
|
0.220
|
74.50
|
|
270
|
35.20
|
73.50
|
0.040
|
70.40
|
0.033
|
73.50
|
|
300
|
33.10
|
73.80
|
0.070
|
66.20
|
-0.010
|
73.80
|
|
330
|
33.00
|
72.90
|
0.003
|
66.00
|
0.030
|
72.90
|
|
360
|
32.80
|
71.80
|
0.007
|
65.60
|
0.037
|
71.80
|
|
390
|
31.92
|
70.40
|
0.029
|
63.84
|
0.047
|
70.40
|
|
420
|
31.19
|
68.70
|
0.024
|
62.38
|
0.057
|
68.70
|
Table 2: Drying rate
and moisture content of sardine fish.
|
|
SARDINE
|
|
|
Mean
|
Mean
|
50g mass
|
100g mass
|
|
TIME(MINUTES)
|
mass
50g after drying
|
mass
100g
after drying
|
DRYING RATE
dW/dT (g/s)
|
MOISTURE CONTENT (%)
|
DRYING RATE
dW/dT (g/s)
|
MOISTURE CONTENT (%)
|
|
0
|
50.00
|
100.00
|
0.000
|
100.00
|
0.000
|
100.00
|
|
30
|
48.96
|
92.50
|
0.035
|
97.92
|
0.250
|
92.50
|
|
60
|
43.50
|
91.30
|
0.182
|
87.00
|
0.040
|
91.30
|
|
90
|
42.80
|
88.16
|
0.023
|
85.60
|
0.105
|
88.16
|
|
120
|
42.60
|
87.40
|
0.007
|
85.20
|
0.025
|
87.40
|
|
150
|
41.00
|
76.26
|
0.053
|
82.00
|
0.371
|
76.26
|
|
180
|
39.50
|
75.50
|
0.050
|
79.00
|
0.025
|
75.50
|
|
210
|
39.00
|
65.20
|
0.017
|
78.00
|
0.343
|
65.20
|
|
240
|
38.60
|
64.30
|
0.013
|
77.20
|
0.030
|
64.30
|
|
270
|
36.30
|
62.10
|
0.077
|
72.60
|
0.073
|
62.10
|
|
300
|
36.00
|
61.90
|
0.010
|
72.00
|
0.007
|
61.90
|
|
330
|
35.60
|
58.70
|
0.013
|
71.20
|
0.107
|
58.70
|
|
360
|
35.40
|
57.40
|
0.007
|
70.80
|
0.043
|
57.40
|
|
390
|
35.30
|
56.20
|
0.003
|
70.60
|
0.040
|
56.20
|
|
420
|
35.00
|
56.10
|
0.010
|
70.00
|
0.003
|
56.10
|
Table 3 : Drying
rate and moisture content of croaker fish.
|
|
CROAKER
|
|
|
Mean
|
Mean mass 100g
after drying
|
50g mass
|
100g mass
|
|
DRYING RATE
dW/dT (g/s)
|
|
DRYING RATE
dW/dT (g/s)
|
|
|
TIME(MINUTES)
|
mass
|
MOISTURE
|
MOISTURE
|
|
|
50g after
|
CONTENT
|
CONTENT
|
|
|
drying
|
(%)
|
(%)
|
|
0
|
50.00
|
100.00
|
0.000
|
100.00
|
0.000
|
100.00
|
|
30
|
43.40
|
96.90
|
0.220
|
86.80
|
0.103
|
96.90
|
|
60
|
42.60
|
89.00
|
0.027
|
85.20
|
0.263
|
89.00
|
|
90
|
40.00
|
88.00
|
0.087
|
80.00
|
0.033
|
88.00
|
|
120
|
33.00
|
87.50
|
0.233
|
66.00
|
0.017
|
87.50
|
|
150
|
32.00
|
85.00
|
0.033
|
64.00
|
0.083
|
85.00
|
|
180
|
31.60
|
82.40
|
0.013
|
63.20
|
0.087
|
82.40
|
|
210
|
28.00
|
81.60
|
0.120
|
56.00
|
0.027
|
81.60
|
|
240
|
27.50
|
81.30
|
0.017
|
55.00
|
0.010
|
81.30
|
|
270
|
27.40
|
81.20
|
0.003
|
54.80
|
0.003
|
81.20
|
|
300
|
27.20
|
81.00
|
0.007
|
54.40
|
0.007
|
81.00
|
|
330
|
27.10
|
80.00
|
0.003
|
54.20
|
0.033
|
80.00
|
|
360
|
27.00
|
80.00
|
0.003
|
54.00
|
0.000
|
80.00
|
|
390
|
27.00
|
80.00
|
0.000
|
54.00
|
0.000
|
80.00
|
|
420
|
27.00
|
80.00
|
0.000
|
54.00
|
0.000
|
80.00
|
Table 4: Drying rate
and moisture content of mackerel fish.
|
|
MACREAL
|
|
|
Mean
|
Mean
|
50g mass
|
100g mass
|
|
TIME(MINUTES)
|
mass
50g
|
mass
100g
|
DRYING RATE
dW/dT (g/s)
|
MOISTURE CONTENT (%)
|
DRYING RATE
dW/dT (g/s)
|
MOISTURE CONTENT (%)
|
|
|
after
|
after
|
|
|
drying
|
drying
|
|
0
|
50.00
|
100.00
|
0.000
|
100.00
|
0.000
|
100.00
|
|
30
|
46.00
|
94.90
|
0.133
|
92.00
|
0.170
|
94.90
|
|
60
|
42.70
|
92.20
|
0.110
|
85.40
|
0.090
|
92.20
|
|
90
|
42.10
|
88.00
|
0.020
|
84.20
|
0.140
|
88.00
|
|
120
|
41.60
|
89.30
|
0.017
|
83.20
|
-0.043
|
89.30
|
|
150
|
38.40
|
80.00
|
0.107
|
76.80
|
0.310
|
80.00
|
|
180
|
37.30
|
78.50
|
0.037
|
74.60
|
0.050
|
78.50
|
|
210
|
36.70
|
77.50
|
0.020
|
73.40
|
0.033
|
77.50
|
|
240
|
34.50
|
77.30
|
0.073
|
69.00
|
0.007
|
77.30
|
|
270
|
34.30
|
75.20
|
0.007
|
68.60
|
0.070
|
75.20
|
|
300
|
33.90
|
69.10
|
0.013
|
67.80
|
0.203
|
69.10
|
|
330
|
32.60
|
68.90
|
0.043
|
65.20
|
0.007
|
68.90
|
|
360
|
31.80
|
68.30
|
0.027
|
63.60
|
0.020
|
68.30
|
|
390
|
31.50
|
67.40
|
0.010
|
63.00
|
0.030
|
67.40
|
|
420
|
30.00
|
67.00
|
0.050
|
60.00
|
0.013
|
67.00
|
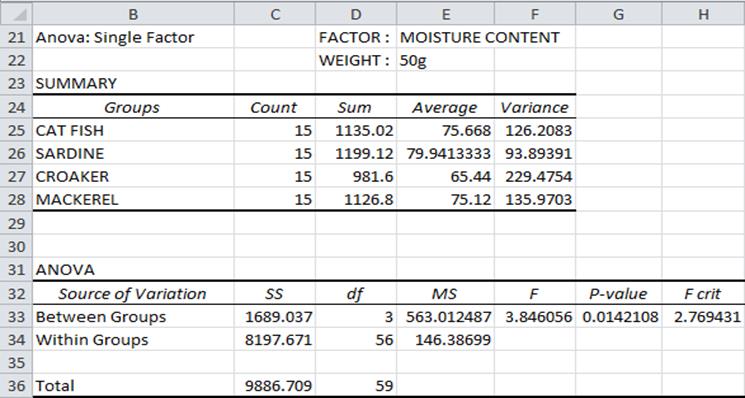
Figure 1: Single Factor Analysis of Variance of the effect of 50g
weight on moisture content of different species of fish.
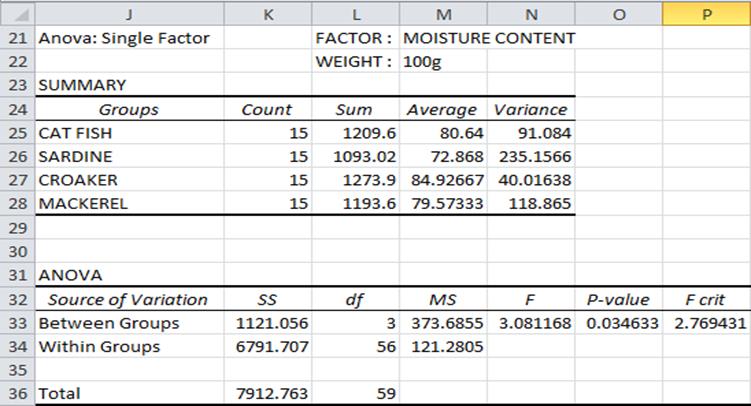
Figure 2: Single
Factor Analysis of Variance of the effect of 100g weight on moisture content
of different species of fish.
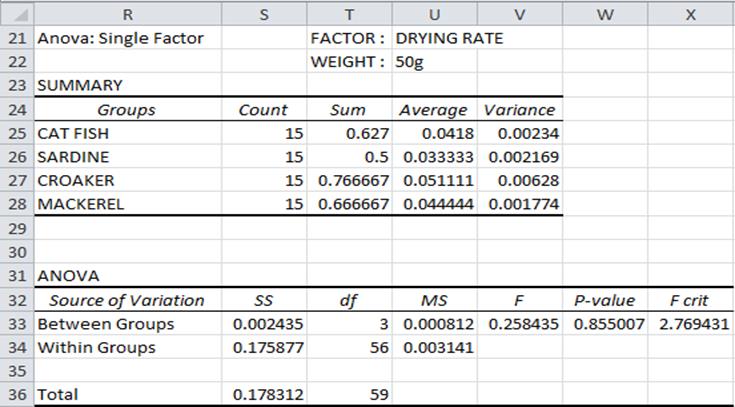
Figure 3: Single Factor Analysis of Variance of the effect of 50g
weight on drying rate of different species of fish.
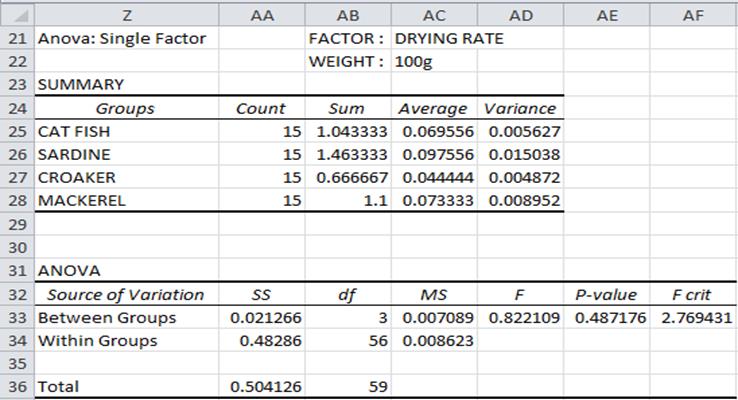
Figure 4: Single Factor Analysis of Variance of the effect of 100g
weight on drying rate of different species of fish.
DISCUSSION OF RESULT
After the experiment, the following were observed. Sardine and croaker has the least mean mass
(56.10g and 27.00g respectively) after
the drying of 100g and 50g weights respectively of different species of fish. Also for the moisture content,
Sardine and croaker has the least percentage moisture content (56.10% and
54.00% respectively) after the drying of 100g
and 50g weights respectively of different
species of fish. These can be attributed to their high drying rate when compared to other species of fish.
Effect of weight on moisture of
croaker, cat fish, sardine and mackerel
For 100g weight of different
species of fish, after drying the moisture contents of croaker, cat fish,
sardine and mackerel were 80.00%,68.70%,56.10%
and 67.00% respectively while for 50g weight of
different species of fish, after
drying the moisture contents of croaker, cat
fish, sardine and mackerel were 54.00%,62.38%,
70.00% and 60.00%. This shows that sardine has the least moisture content for 100g
weights when compared to the other three species of fish while croaker has the
least moisture content for 50g weights when
compared to the other three species of fish. The single factor analysis
of variance of 50g weight moisture
content of different species with the test
done at level of significance a =
0.05, the result gave a P-value of 0.014.
This shows there is a significant
difference between moisture content of different species of fish. Also for 100g
weight moisture content of different
species with the test done at level of significance
a = 0.05, the result gave a P-value of 0.035. This implies there is a significant
difference between moisture content of different species of fish.
Effect of weight on drying rate
of croaker, cat fish, sardine and mackerel
For 100g weight of different
species of fish, after drying the
drying rate of croaker, cat fish,
sardine and mackerel were 0.00g/s,
0.057g/s, 0.003g/s, and 0.013g/s respectively while for 50g weight of different
species of fish, after drying the moisture contents of croaker, cat fish, sardine and mackerel were 0.00g/s, 0.024g/s, 0.010g/s and 0.050g/s . This shows that for 100g and
50g weights of different species of fish, croaker dried fastest which is as a
result of low moisture content in it.
The single factor analysis of variance of 50g
weight drying rate of different
species with the test done at level of significance
a = 0.05, the result gave a P-value of 0.855.
This shows there is no significant difference between moisture content of different species of fish. Also for 100g
weight moisture content of different
species with the test done at level of significance
a = 0.05, the result gave a P-value of 0.487. This implies there is no significant
difference between moisture content of different
species of fish.
CONCLUSION
It can be concluded that weight has significant effect on moisture content and drying rate of croaker, cat fish, sardine and mackerel.
Sardine has the least moisture content for 50g sample while Croaker has the
least moisture content for 100g sample after drying. Croaker has fastest drying
rate both for 50g and 100g, it dried faster in 50g than 100g weight which shows
implies that the higher the weight of sample the higher the moisture content
and drying time. The Single factor Analysis of Variance shows that the higher
the weight of sample test the less significant difference in the moisture content and drying weight of different species of fish.
REFERENCES
Ashaolu Michael O. (2014). Development and Performance
Evaluation of a Motorized Fish Smoking Kiln. Journal of Aquaculture Research
and Development, 5:3 http://dx.doi.org/10.4172/2155-9546.1000225
Chavan B. R., Yakupitiyage A., Kumar S.
and Rakshit S. K. (2008). Experimental investigation on biochemical, microbial
and sensory properties of mackerel (Rastrilliger kangurta) dried by
solar-biomass hybrid cabinet dryer. Journal of Food, Agriculture &
Environment Vol.6 (3&4): 167-171.
Conne A.A., (1980). “Smoking of foods”, Process Biochemistry.
Eyo (1986). “Traditional and improved process
technologies in Bayelsa state, Nigeria”, European Journal of scientific
research, vol 55 no. 4, pp 539-548.
Idah, Peter Aba and Nwankwo, Ifeanyi (2013). Effects
of smoke-drying temperatures and time on physical and nutritional quality
parameters of Tilapia (Oreochromis
niloticus). International Journal of Fisheries
and Aquaculture Vol. 5(3), pp. 29-34.
Ismail M.N and Wooton M (1992). Fish salting and drying: a review,
ASEAN Food Journal vol. 7(4): pp 175-183. Jason AC (1958). “A study of
Evaporation and Diffusion processes in the drying of fish muscle”, proc. Of a
conf. In
Aberedeen, London, PP
103-136.
Kamalakar D., Nageswara Rao L., Siva Prasada Rao K.
and Venkateswara Rao M. (2013). Studies on Drying Characteristics of Prawn and
Fish. Journal of Chemical, Biological and Physical Sciences; Sec. B, Vol.3,
No.3.
Opara C.C., Philip U. M. and Ololo C.F. (2013).
Effect of Heating on Selected Fish (Tilapia and Catfish) Properties during
Drying. Greener Journal of Science, Engineering and Technology Research ISSN:
2276-7835 Vol. 3 (3), pp. 093-101.
Sachithananathan B.N (1985). “A study of diffusion
and evaporation processes in the drying of fish muscle”. Proc of a conc. In
Aberdeen, London. Pp 103 – 136.
Cite this Article: Evbuomwan BO, Okoh L and Ogboada JA (2015). Effect of Weight on Moisture Content and Drying Rate of
Different Species of Fish. Greener
Journal of Science Engineering and
Technological Research, 5 (2): 20-26, http://doi.org/10.15580/GJSETR.2015.2.062715085.