By Ikiriko, ME; Kamalu, OJ;
Joseph, IE (2022).
|
Greener
Journal of Agricultural Sciences
Vol. 12(1), pp. 01-15, 2022
ISSN: 2276-7770
Copyright ©2022, the copyright of this article is retained by
the author(s)
https://gjournals.org/GJAS
|

|
Potassium fixation
of some soils derived from different parent materials in Cross River State,
Nigeria.
Ikiriko,
M.E1; Kamalu, O.J1; Joseph, I.E1
1Department of Crop and Soil
Science, Faculty of Agriculture, University of Port Harcourt, Nigeria.
|
ARTICLE INFO
|
ABSTRACT
|
|
Article No.: 112921141
Type: Research
Full text: HTML, PDF, EPUB, PHP
|
Potassium fixation of some soils derived from different parent
materials in Cross River State was studied being a major problem that
affects the efficiency of K fertilizers. A total of eighteen soil samples
were collected from three parent materials: Basement complex, Coastal plain
sand and Shales. Six levels of potassium chloride (0, 25, 50, 100, 200 and
400 mg) were added to 1kg soil and replicated three times. Potassium was
extracted with 1 N NH4OAc after one day, ten- and forty-two-days incubation.
The amount of K fixed was determined and correlation between applied and
fixed K was carried out. The soil pH ranged from 5.29 to 5.60, organic carbon
varied from 1.33% to 2.18 %, the exchangeable cations are in order of
abundance; Ca2+ > Mg2+ > K+ > Na+ and the ECEC of the soils varied
from 4.86 cmol/kg for basement complex to 19.38 com/kg for shales. The mean
proportion of K fixed varied from 2.06 to 279.05 mg/kg for Shales, 5.95 to
288.44 mg/kg for basement complex and 8.06 to 292.23 mg/kg for soils derived
from coastal plain. There was significant correlation (P<0.01) between
added and fixed potassium during all the incubation days, the results of
this study show that the studied soils irrespective of the parent materials
has the ability to fix K and thus, fertilizer recommendation should take
into consideration of the amount that is initially fixed.
|
|
Accepted: 29/11/2021
Published: 20/01/2022
|
|
*Corresponding Author
Ikiriko M.E.
E-mail: miebaka.ikiriko@
uniport.edu.ng
|
|
Keywords: parent
materials, potassium fixation, potassium fertilizers.
|
|
|
|
INTRODUCTION
Potassium (K) is an
essential element required by plants; it comes after nitrogen and phosphorus.
It is one of the primary elements needed for metabolism, physiological and life
cycle of developments. Potassium availability to plants depends on its
intensity in the soil solution, capacity of the available pools as well as the
buffering capacity of the solid phase (Bilias and Barbayiannis, 2017).
The intensity refers to the
potassium concentration in the soil solution, and the buffering capacity is a
measure of the total amount of potassium in the solid phase of the soil which
can be available in the soil solution while the replenishment rate in the soil
represents the transfer rate of potassium from the solid phase of the soil to
soil solution (Aminul et al., 2017).
Potassium
influences the population of microorganisms in the rhizosphere and plays key
role in the nutrition and health of man and livestock. Potassium exists in four
forms in the soil: the solution form, exchangeable form, non-exchangeable form
or fixed form and mineral or structural form (Romheld and Neumann 2006).
The equilibrium and kinetic reactions that exist
between the various of form of potassium in the soil
solution is usually influenced by the process of leaching and plant uptake, it
is immediately replenished by other forms such as the exchangeable and
non-exchangeable fractions. Potassium availability in the soil solution could
therefore be predisposed by the solution-exchangeable potassium dynamics, rate
of potassium exchange in soils, potassium fixation and release from soil
minerals and leaching (Yawson et al.,
2011).
Fixation as applied to potassium in soils refers to
the reversion of water-soluble potassium to less soluble and non-replaceable
forms. The water soluble and replaceable soil potassium are the main source of
potassium for the soil solution and to be more or less available for plant
growth, and it constitute the form of which the nutrient is mostly readily
utilized by plants. Hence, the problem of potassium fixation is of practical
importance as regards to the management of potassium fertilizers application as
well as the availability of essential nutrient to plants.
Potassium fixation is a direct significance of the
existence of 2:1 Clay minerals. In assessing the potassium supplying capacity,
the potassium that is readily released and the slow releasing potassium
fractions must be appraised because of the dynamics of water
and gas in the soil-plant system and rhizosphere processes (Romheld and
Neumann, 2006). Potassium fixation is
said to be a wide phenomenon in most soils and account significantly for the
availability of applied potassium to plants. The amount of potassium fixed and
that required to bring about fixation varies with different soils. There is
little information on K fixation characteristic of the soils of Cross Rivers
State. The main objective of this study was to: (1) characterize the proportion of fixed Potassium in soils in
Cross River State based on Parent materials and (2) establish the relationship
between Potassium fixed and potassium added in respect to days of incubation.
MATERIALS AND METHODS
Description of Study Site
The study
was carried out within Cross Rivers State, Nigeria, located between latitude 050
32′ and
40 27′ North of the
equator and longitude 70 15′
and 090 28′
South of the Greenwich meridian. It is a tropical climate of average
annual temperature of 26.40C, the average precipitation of the area
is 2708mm with about 70% annual total occurring between March- September. May and July have the highest amount of rainfall.
The vegetation of the study area is mainly rainforest and the land-use are majorly agricultural purposes (cassava, plantain, melon,
vegetable, maize, yam, cocoyam and banana).
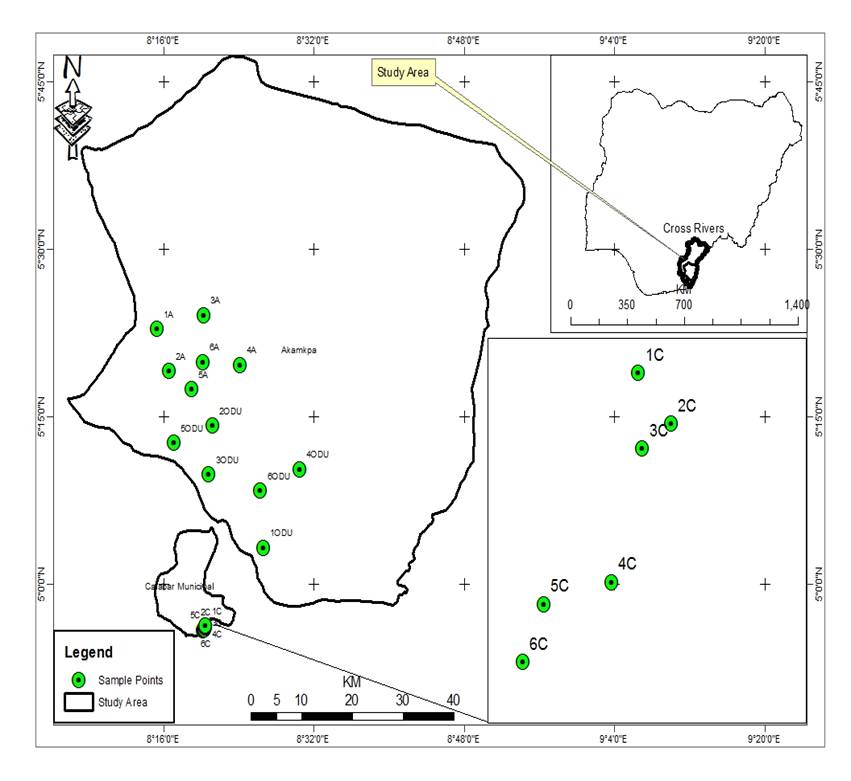
Figure 1: Map showing locations
of the experimental soil samples
Soil Samples Collection and Preparation
The soil
samples were randomly collected at 0 -30 cm based on parent material; basement
complex, coastal plain sand and shales (Figure 1). Six soil samples were
collected per location, giving a total of 18 samples. The collected soil
samples were air- dried in a shade, gravel and plant roots
removed and crushed with porcelain mortar and pestle and sieved
through a 2mm mesh. Soil particles less than 2mm were stored in polyethene bags
and appropriately labeled preceding to laboratory
analysis. A ration of each soil sample was crushed and passed through a 0.5mm
sieve for the determination of organic carbon and total nitrogen.
Laboratory Analysis
The soils
were analysed for physical and chemical properties. The particle size
distribution was determined by the modified bouyoucos hydrometer method (Anderson
and Ingram 1993). The soil pH was measured in 1:1 soil-water ratio. Total
organic carbon was determined by the dichromate wet oxidation method as
described by Nelson and Sommer (1996). Exchangeable bases (Ca, Mg, Na and K)
were extracted with 1N ammonium acetate (NH4OAC) buffered
at pH 7.0 (Thomas 1996). Exchangeable K and Na in the extract were read through
the Jenway flame photometer (model PEP7) while Ca and Mg were read on atomic
absorption spectrophotometer. Effective cation exchange capacity (ECEC) was
obtained by summation method. Exchangeable Acidity (EA) was extracted with 1N
KCl and determined by titration with 0.05 N NaOH using phenolphthalein indicator (McClean 1982). Total Nitrogen was determined
using a modified Kjeldahl digestion procedure (Bremmer and Mulvaey, 1982) and
available phosphorus was determined by Bray II method (Olsen and Sommers,
1982).
Potassium Fixation
Fixation
studies was carried out according to the method as
described by Portela et al. 2019. Different
amount of potassium chloride (KCl) were added to 1 kg of each soil (oven dry
basis); 0, 25, 50, 100, 200 and 400 mg in three replicates. The soils were
incubated wet near field capacity at 22 º C for 1, 10 and 42 days respectively,
and water content was maintained constant throughout the incubation period.
The amount of
potassium fixed was obtained by difference, measuring the amounts of potassium
remaining extractable by ammonium ions as follows;
Potassium
Fixed = K applied + K before treatment - K extractable after treatment
(Srinivasa and Takkar 2000)
Statistical Analysis
Data
collected was subjected to statistical analysis, correlation analysis between
potassium fixed and potassium added in respect to different days of incubations
were analyzed using Genstat statistical package (Buysse et al.,2004).
RESULTS
AND DISCUSSION
Physiochemical
Properties of the Experimental Soils
Soil pH is a master
variable of soil fertility and as well as indicator of soil nutrient dynamics.
The pH varied from moderate to strongly acidic (5.29 to 5.60) as shown in Table
1. Soil pH value less than 5.50 indicates that the soils may suffer from aluminum
toxicity. It has been reported that aluminum toxicity occurs in soils with pH
values less than 5.50 and increases in intensity as the soil pH decreases below
5.0 (Opara-Nadi et al.,1988; White et al.,2006 and Ikiriko et al., 2016).
The
nitrogen content ranged from 0.82 g/kg (low) at Akampka to 0.90 g/kg (high) at
Calabar (Table 1). According to Chude et
al., 2012, the total nitrogen content is below the critical limit (1.2 –
1.6 g/kg), which implies that there will be a response to nitrogen application.
Organic
carbon improves soil chemical properties in three ways; as a net source of
carbon and nutrients, increases cation exchange capacity and stimulates
biological activities. Soil organic carbon is the major component of soil
organic matter, it plays a vital role in plant
nutrient supply, determines response to N and P fertilizers and improve soil
physical structure and processes. The total organic carbon varied from 1.33 %
(low) at Akampka to 2.18 % (high) at Calabar as shown in Table 1. Maria and Yost (2006) rated organic carbon
content of < 1.5 %, 1.5 – 2.5 % and < 2.5 % as low, medium and high,
respectively. The total organic carbon was low to moderate.
The
exchangeable cations are in order of abundance; Ca2+ > Mg2+
> K+ > Na+. This indicates that as weathering
progresses, an enormous amount of potassium is being leached out of the soil
colloid as compared with others exchangeable cation. The calcium content of the studied soils ranged from
2.40 cmol/kg at Akampka to 11.20 cmol/kg at odukpani (Table 1). The
exchangeable magnesium ranged from 0.8 cmol/kg at Akampka
to 3.80 cmol/kg at odukpani. The magnesium content of Calabar and Odukpani were
above the critical limit (1.5-3.0 mg/kg) as reported by Obigbesan, 1981. While
the sodium content of the soil varied from 0.59 to 0.66 cmol/kg to 1.09 cmol/kg for soils of Akampka and Odukpani respectively.
The sodium content of the studied soils is above the critical limit reported by
Obigbesan, 1981.
The ECEC
of the soils varied from 4.86 cmol/kg (low) at Akampka
to 19.38 mg/kg (high) at odukpani. The ECEC value for soils of Akampka and
Calabar are below 16 cmol/kg which indicate that soils are
dominated by low activity clay (Opara-Nadi, 1988 and Thomas et al., 2019).
|
Table 1:
Physiochemical properties of the experimental soils
|
|
Soil
Parameters
|
Akamkpa
(B.C )
|
Calabar
(C. S)
|
Odukpani(
S)
|
|
pH
|
5.29
|
5.40
|
5.60
|
|
Available
Phosphorus mg/kg
|
15.79
|
70.18
|
17.54
|
|
Total
Nitrogen (g/kg)
|
0.82
|
0.90
|
0.85
|
|
Organic
Carbon %
|
1.33
|
2.18
|
1.78
|
|
Water
soluble K cmol/kg
|
0.08
|
0.31
|
0.14
|
|
Exchangeable
Cations (cmol/kg)
|
|
|
|
|
Potassium
(K)
|
0.21
|
9.15
|
0.33
|
|
Sodium
(Na)
|
0.59
|
0.66
|
1.09
|
|
Calcium
(Ca)
|
3.00
|
2.40
|
11.20
|
|
Magnesium
(Mg)
|
0.80
|
2.00
|
3.80
|
|
EA
cmol/kg
|
0.26
|
0.38
|
2.96
|
|
ECEC
cmol/kg
|
4.86
|
5.59
|
19.38
|
|
CaCO3
%
|
0.45
|
0.85
|
1.65
|
|
Sand
%
|
80.60
|
86.60
|
62.60
|
|
Silt
%
|
10.00
|
4.00
|
10.00
|
|
Clay
%
|
9.40
|
9.40
|
27.40
|
|
Textural class
|
Sandy loam
|
Loamy sand
|
Sandy Clay loam.
|
*B.C: Basement
Complex, C.S: Coastal Plain sands, S: Shale, EA: Exchangeable Acidity, *CaCO3:
Calcium Carbonate, ECEC: Effective Cation Exchange Capacity, OC: Organic
Carbon, TN: Total Nitrogen
Fixation
capacity
Akampka
Soils
(Basement Complex)
The
proportion of mean value of potassium fixed for soil derived from basement
complex at 25, 100, 200 and 400 mg/kg of K added ranged from 5.95 to 288.44
mg/kg. The soils (Soil No. 1A, 2A, 3A 4 A, 5A and 6A) showed releasing
properties at 25, 50, and 100 mg/kg of potassium added (Table 2a and 2b).
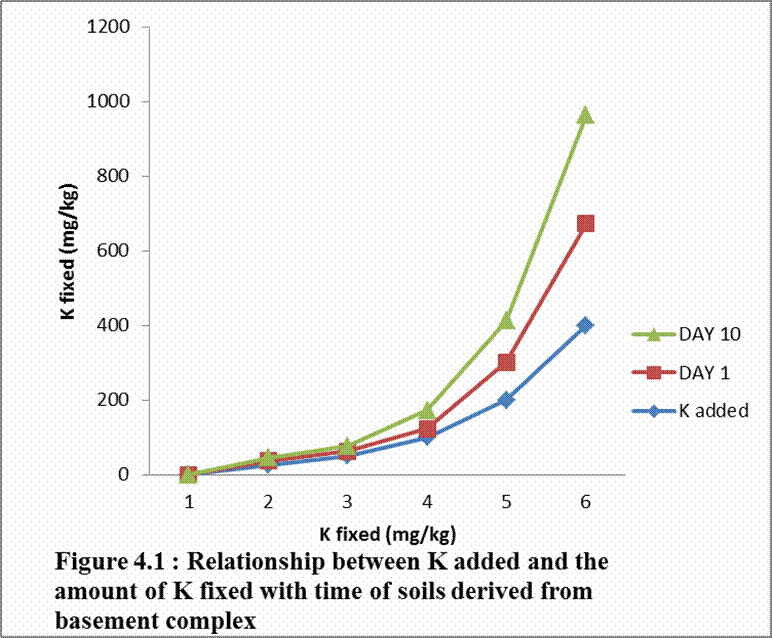
Potassium fixation increased with increase in concentration of potassium added
during the incubation periods (Fig 1). There was a high correlation (n=6, P< 0.01) between K added and K fixed in all the incubation periods
(Table 3).
Calabar
Soils (Coastal Plain Sand)
The proportion of
mean values of Potassium fixed for soils derived from coastal plain sand at 25,
100, 200 and 400 mg/kg of K added ranged from 8.06 to 292.23 mg/kg. The soils
(Soil No. 1C, 2C, 3C 5C and 6C) showed releasing properties at 25, and 50 mg/kg
of potassium added (Table 4a and 4b). Potassium fixation increased with
increase in concentration of potassium added during the incubation periods (Fig
2). There was a high correlation (n=6,
P< 0.01) between K added and K
fixed in all the incubation periods (Table 5)
Odukpani
Soils (Shales)
The
proportion of mean value of potassium fixed for soil derived from shales at 25,
100, 200 and 400 mg/kg of K added ranged from 2.06 to 279.05 mg/kg. The soils
(Soil No. 1ODU, 4ODU, 5ODU and 6ODU) showed releasing properties at 25, and 50
mg/kg of potassium added (Table 6a and 6b). Potassium fixation increased with
increase in concentration of potassium added during the incubation periods (Fig
3). There was a high correlation (n=6,
P< 0.01) between K added and K
fixed in all the incubation periods (Table 7).
In
general, the amount of potassium recovered increased with the amount of
potassium added irrespective of the parent material of the studied soils. Also,
higher level of potassium fixation was observed in one and ten days of incubation
while the 42 days gave the lowest levels of potassium fixed.
The
studied soils have the potential to fix applied potassium despite their
different parent materials (Ayarza, 1988, Tening et al., 1995 and Thomas et al.,
2016). The ability of these soils to fix potassium could be attributed to their
nature of clay mineral and low cation exchange capacity. Hence, there is an
indication of the presence of specific adsorption sites for potassium in the
soils. The adsorption sites may increase
the fixation of potassium in the soil, improve
nutrient cycling, and the residual effect of potassium fertilization (Ritchey et al., 1980). The higher levels of
potassium levels of potassium fixation observed in the one and seven days of
incubation in some soils, and the low amount of potassium fixed at 42 days
period of incubation, are not common as the fixation sites in the soil are
first satisfied when a nutrient element is added before providing the excess
for plant uptake. The efficacy of potassium
fertilizer applications are usually influenced by previous application which is
fixed by the soil sorption sites, this fixed fertilizer should be put into
consideration for rational fertilizer management ( Portela,
2019).
|
Table 3:
Correlation between K added and different days of incubation of soils derived
from basement complex.
|
|
|
Day
1
|
Day
10
|
Day
42
|
|
K
added
|
0.978**
|
0.984**
|
0.988**
|
** = Significant
|
Table 2a: Amounts
of Potassium fixed by soils derived
from Basement Complex (Akamkpa)
|
|
Soil
No.
|
|
1A
|
2A
|
3A
|
|
K
added
(mg/kg)
|
Incubation Time
(days)
|
K Recovered
|
K
Fixed
|
K
Recovered
|
K Fixed
|
K
Recovered
|
K
Fixed
|
|
|
mg/kg
|
|
0.00
|
1
|
34.80
|
-
|
32.84
|
-
|
52.78
|
-
|
|
|
10
|
28.15
|
-
|
22.29
|
-
|
18.38
|
-
|
|
|
42
|
41.44
|
-
|
19.94
|
-
|
35.58
|
-
|
|
|
Mean
|
34.80
|
-
|
25.02
|
-
|
35.58
|
-
|
|
25.00
|
1
|
49.65
|
10.15
|
65.68
|
-7.84
|
48.87
|
28.91
|
|
|
10
|
40.66
|
12.49
|
57.08
|
-9.79
|
34.80
|
8.58
|
|
|
42
|
52.78
|
13.66
|
69.59
|
-24.65
|
64.51
|
-3.95
|
|
|
Mean
|
47.70
|
12.10
|
61.12
|
|
49.39
|
11.19
|
|
50.00
|
1
|
73.90
|
10.90
|
85.23
|
-3.25
|
93.05
|
9.73
|
|
|
10
|
46.14
|
32.01
|
76.63
|
-4.34
|
71.94
|
-3.56
|
|
|
42
|
116.51
|
-25.07
|
93.84
|
-23.90
|
50.83
|
34.75
|
|
|
Mean
|
78.85
|
5.95
|
85.23
|
|
71.94
|
13.64
|
|
100.00
|
1
|
144.27
|
-9.47
|
82.50
|
50.34
|
87.58
|
65.20
|
|
|
10
|
108.69
|
19.46
|
44.96
|
77.33
|
66.47
|
51.91
|
|
|
42
|
69.59
|
71.85
|
46.53
|
73.41
|
56.69
|
78.89
|
|
|
Mean
|
107.52
|
27.28
|
58.00
|
67.03
|
70.25
|
65.33
|
|
200.00
|
1
|
161.47
|
73.33
|
95.79
|
137.05
|
131.76
|
121.02
|
|
|
10
|
89.53
|
138.62
|
82.11
|
140.18
|
90.71
|
127.67
|
|
|
42
|
152.09
|
89.35
|
104.00
|
115.94
|
82.11
|
153.47
|
|
|
Mean
|
134.09
|
100.43
|
93.97
|
131.06
|
101.53
|
134.05
|
|
400.00
|
1
|
128.63
|
306.17
|
139.58
|
293.26
|
161.87
|
290.91
|
|
|
10
|
143.49
|
284.66
|
125.11
|
297.18
|
144.66
|
273.72
|
|
|
42
|
139.19
|
302.25
|
137.62
|
282.32
|
134.89
|
300.69
|
|
|
Mean
|
137.10
|
298.93
|
134.10
|
290.92
|
147.14
|
288.44
|
*A; Akampka
|
Table.2b:
Amounts of Potassium fixed by soils derived from Basement Complex (Akamkpa)
|
|
Soil No.
|
|
4A
|
5A
|
6A
|
|
K added
(mg/kg)
|
Incubation Time
(days)
|
K Recovered
|
K
Fixed
|
K Recovered
|
K Fixed
|
K Recovered
|
K
Fixed
|
|
|

|
|
 mg/kg mg/kg
|
|
|
|
0.00
|
1
|
49.65
|
-
|
28.54
|
-
|
28.15
|
-
|
|
|
10
|
14.47
|
-
|
18.38
|
-
|
22.29
|
-
|
|
|
42
|
59.82
|
-
|
8.21
|
-
|
60.99
|
-
|
|
|
Mean
|
41.31
|
|
18.38
|
|
37.14
|
|
|
25.00
|
1
|
63.34
|
11.31
|
37.14
|
16.40
|
42.62
|
10.53
|
|
|
10
|
33.23
|
6.24
|
30.10
|
13.28
|
29.71
|
17.58
|
|
|
42
|
113.78
|
-28.96
|
23.07
|
10.14
|
102.83
|
-16.84
|
|
|
Mean
|
70.12
|
-3.80
|
30.10
|
13.27
|
58.39
|
3.76
|
|
50.00
|
1
|
64.90
|
34.75
|
61.77
|
16.77
|
69.99
|
8.16
|
|
|
10
|
41.83
|
22.64
|
61.77
|
6.61
|
44.18
|
28.11
|
|
|
42
|
123.16
|
-13.34
|
54.74
|
3.47
|
62.56
|
48.43
|
|
|
Mean
|
76.63
|
14.68
|
59.43
|
8.95
|
58.91
|
28.23
|
|
100.00
|
1
|
127.85
|
21.80
|
129.02
|
-0.48
|
122.38
|
5.77
|
|
|
10
|
76.63
|
37.84
|
69.99
|
48.39
|
55.52
|
66.77
|
|
|
42
|
127.07
|
32.75
|
114.95
|
-6.74
|
111.43
|
49.56
|
|
|
Mean
|
110.52
|
30.80
|
104.65
|
13.72
|
96.44
|
40.70
|
|
200.00
|
1
|
199.79
|
49.86
|
138.80
|
89.74
|
96.57
|
131.58
|
|
|
10
|
152.87
|
61.60
|
130.59
|
87.79
|
113.78
|
108.51
|
|
|
42
|
89.14
|
170.68
|
126.29
|
81.92
|
129.02
|
131.97
|
|
|
Mean
|
147.27
|
94.05
|
131.89
|
86.48
|
113.12
|
124.02
|
|
400.00
|
1
|
251.01
|
198.64
|
179.85
|
248.69
|
133.72
|
294.43
|
|
|
10
|
96.18
|
318.29
|
121.59
|
296.79
|
150.92
|
271.37
|
|
|
42
|
150.53
|
309.29
|
119.64
|
288.57
|
190.02
|
270.97
|
|
|
Mean
|
165.91
|
275.41
|
140.36
|
278.02
|
158.22
|
278.92
|
|
*A; Akampka
|
|
Table 4a: Amounts of
Potassium fixed by soils derived Coastal Plain Sand (Calabar)
|
|
Soil
No.
|
|
1C
|
2C
|
3C
|
|
K
added
|
Incubation Time
(days)
|
K Recovered
|
K
Fixed
|
K
Recovered
|
K Fixed
|
K
Recovered
|
K
Fixed
|
|
|
mg/kg
|
|
0.00
|
1
|
37.93
|
-
|
50.05
|
-
|
14.08
|
-
|
|
|
10
|
42.23
|
-
|
43.01
|
-
|
20.72
|
-
|
|
|
42
|
51.61
|
-
|
38.32
|
-
|
49.65
|
-
|
|
|
Mean
|
43.92
|
-
|
43.79
|
|
28.15
|
-
|
|
25.00
|
1
|
45.35
|
17.58
|
85.63
|
-10.43
|
70.38
|
-31.30
|
|
|
10
|
75.46
|
-8.23
|
68.03
|
-0.02
|
51.61
|
-5.89
|
|
|
42
|
61.77
|
14.84
|
58.26
|
5.06
|
59.04
|
15.61
|
|
|
Mean
|
60.86
|
8.06
|
70.64
|
-1.85
|
60.34
|
-7.19
|
|
50.00
|
1
|
64.12
|
23.81
|
93.84
|
6.21
|
61.38
|
2.70
|
|
|
10
|
72.72
|
19.51
|
64.51
|
28.50
|
76.24
|
-5.52
|
|
|
42
|
93.44
|
8.17
|
60.21
|
28.11
|
50.05
|
49.60
|
|
|
Mean
|
76.76
|
17.16
|
72.85
|
20.94
|
62.56
|
15.59
|
|
100.00
|
1
|
71.16
|
66.77
|
132.93
|
17.12
|
77.02
|
37.06
|
|
|
10
|
124.72
|
17.51
|
84.45
|
58.56
|
88.75
|
31.97
|
|
|
42
|
114.56
|
37.05
|
82.11
|
56.21
|
91.88
|
57.77
|
|
|
Mean
|
103.48
|
40.44
|
99.83
|
43.96
|
85.88
|
42.27
|
|
200.00
|
1
|
129.81
|
108.12
|
150.53
|
99.52
|
137.62
|
76.46
|
|
|
10
|
152.09
|
90.14
|
126.68
|
116.33
|
169.69
|
51.03
|
|
|
42
|
168.12
|
83.49
|
116.51
|
121.81
|
140.75
|
108.90
|
|
|
Mean
|
150.00
|
93.92
|
131.24
|
112.55
|
149.35
|
78.80
|
|
400.00
|
1
|
176.72
|
261.21
|
164.21
|
285.84
|
168.12
|
245.96
|
|
|
10
|
155.21
|
287.02
|
155.61
|
287.40
|
160.30
|
260.42
|
|
|
42
|
159.91
|
291.70
|
134.89
|
303.43
|
151.31
|
298.34
|
|
|
Mean
|
163.95
|
279.98
|
151.57
|
292.23
|
159.91
|
268.24
|
*C ; Calabar
Table 4b: Amounts
of Potassium fixed by soils derived Coastal Plain Sand (Calabar)
|
|
Soil
No.
|
|
4C
|
5C
|
6C
|
|
K
added
|
Incubation Time
(days)
|
K Recovered
|
K
Fixed
|
K
Recovered
|
K Fixed
|
K
Recovered
|
K
Fixed
|
|
|
mg/kg
|
|
0.00
|
1
|
34.41
|
-
|
21.11
|
-
|
22.29
|
-
|
|
|
10
|
24.63
|
-
|
21.50
|
-
|
25
02
|
-
|
|
|
42
|
39.88
|
-
|
47.70
|
-
|
57.47
|
-
|
|
|
Mean
|
32.97
|
-
|
30.10
|
-
|
34.93
|
-
|
|
25.00
|
1
|
43.79
|
15.62
|
68.03
|
-21.92
|
38.32
|
8.97
|
|
|
10
|
46.92
|
2.71
|
69.59
|
-23.09
|
72.33
|
-22.31
|
|
|
42
|
64.51
|
0.37
|
62.95
|
9.75
|
60.60
|
21.87
|
|
|
Mean
|
51.74
|
6.23
|
66.86
|
-11.75
|
57.08
|
2.84
|
|
50.00
|
1
|
50.83
|
33.58
|
89.14
|
-18.03
|
76.63
|
-4.34
|
|
|
10
|
64.51
|
10.12
|
58.65
|
12.85
|
67.64
|
7.38
|
|
|
42
|
68.81
|
21.07
|
63.73
|
33.97
|
69.20
|
38.27
|
|
|
Mean
|
61.38
|
21.59
|
70.51
|
-3.68
|
71.16
|
13.77
|
|
100.00
|
1
|
100.48
|
33.93
|
96.18
|
24.93
|
100.48
|
21.81
|
|
|
10
|
100.87
|
23.76
|
59.43
|
62.07
|
88.75
|
36.27
|
|
|
42
|
109.08
|
30.80
|
100.09
|
47.61
|
108.30
|
49.17
|
|
|
Mean
|
103.48
|
29.50
|
85.23
|
44.87
|
99.18
|
35.75
|
|
200.00
|
1
|
154.44
|
79.97
|
96.57
|
124.54
|
141.53
|
80.76
|
|
|
10
|
145.05
|
79.58
|
147.40
|
74.10
|
144.27
|
80.75
|
|
|
42
|
134.11
|
105.77
|
84.84
|
162.86
|
142.71
|
114.76
|
|
|
Mean
|
144.53
|
88.44
|
109.60
|
120.50
|
142.84
|
92.09
|
|
400.00
|
1
|
136.84
|
297.57
|
167.73
|
253.38
|
150.14
|
272.15
|
|
|
10
|
131.76
|
292.91
|
198.62
|
222.88
|
162.26
|
262.76
|
|
|
42
|
142.72
|
315.16
|
165.78
|
281.92
|
157.56
|
299.91
|
|
|
Mean
|
131.11
|
301.88
|
177.38
|
252.73
|
156.65
|
278.27
|
*C ; Calabar
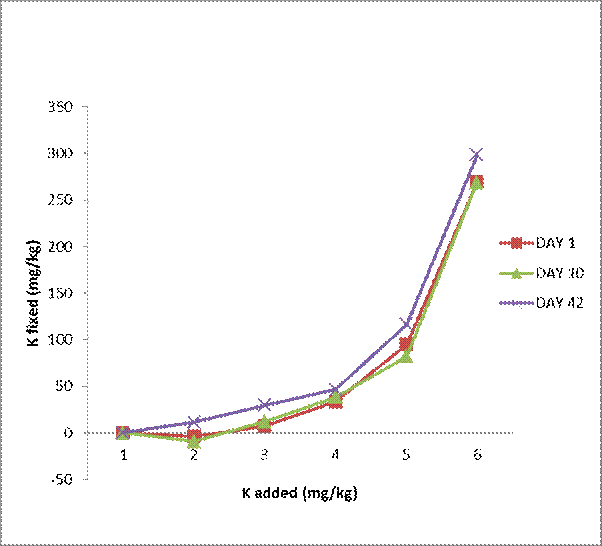
Figure 2:
Relationship between K added and the amount of K fixed with time of soils
derived from coastal plain sand
|
Table 5:
Correlation between K added and different days of incubation of soils derived
from coastal plain sand.
|
|
|
Day
1
|
Day
10
|
Day
42
|
|
K
added
|
0.975**
|
0.965**
|
0.992**
|
**
= Significant P < 0.01
|
Table 6a: Amounts
of Potassium fixed by soils derived Shales (Odukpani)
|
|
Soil
No.
|
|
1ODU
|
2ODU
|
3ODU
|
|
K
added
|
Incubation Time
(days)
|
K Recovered
|
K
Fixed
|
K
Recovered
|
K Fixed
|
K
Recovered
|
K
Fixed
|
|
|
mg/kg
|
|
0.00
|
1
|
30.49
|
-
|
62.17
|
-
|
32.84
|
-
|
|
|
10
|
33.23
|
-
|
31.67
|
-
|
29.32
|
-
|
|
|
42
|
31.27
|
-
|
38.71
|
-
|
25.02
|
-
|
|
|
Mean
|
31.66
|
-
|
44.18
|
-
|
29.06
|
-
|
|
25.00
|
1
|
72.72
|
-17.23
|
40.66
|
46.51
|
52.78
|
5.06
|
|
|
10
|
55.13
|
3.10
|
56.30
|
0.37
|
42.23
|
12.09
|
|
|
42
|
53.96
|
2.31
|
62.56
|
1.15
|
37.14
|
12.88
|
|
|
Mean
|
60.60
|
-3.94
|
53.17
|
16.01
|
44.05
|
10.01
|
|
50.00
|
1
|
86.02
|
-5.53
|
73.12
|
39.05
|
77.02
|
5.82
|
|
|
10
|
65.68
|
17.55
|
51.61
|
30.06
|
73.11
|
6.21
|
|
|
42
|
63.63
|
17.93
|
52.00
|
36.71
|
68.42
|
6.60
|
|
|
Mean
|
71.68
|
10.05
|
58.91
|
35.27
|
72.85
|
6.21
|
|
100.00
|
1
|
87.97
|
42.52
|
129.81
|
32.36
|
82.11
|
50.73
|
|
|
10
|
112.21
|
18.28
|
90.32
|
41.35
|
101.65
|
27.67
|
|
|
42
|
59.43
|
71.84
|
61.77
|
76.94
|
80.15
|
44.87
|
|
|
Mean
|
86.54
|
44.21
|
93.97
|
50.22
|
87.97
|
41.09
|
|
200.00
|
1
|
136.06
|
94.43
|
127.46
|
134.71
|
147.40
|
85.44
|
|
|
10
|
134.50
|
98.73
|
143.88
|
87.74
|
117.29
|
112.03
|
|
|
42
|
102.44
|
128.83
|
139.58
|
99.13
|
110.26
|
114.76
|
|
|
Mean
|
124.33
|
107.33
|
136.97
|
107.21
|
124.98
|
104.08
|
|
400.00
|
1
|
151.31
|
297.18
|
215.43
|
246.74
|
240.84
|
192.00
|
|
|
10
|
166.95
|
264.32
|
166.17
|
265.50
|
229.51
|
199.81
|
|
|
42
|
140.75
|
290.52
|
148.57
|
290.14
|
222.08
|
202.94
|
|
|
Mean
|
153.00
|
278.01
|
176.72
|
267.46
|
230.81
|
198.25
|
Table 6b: Amounts
of Potassium fixed by soils derived Shales (Odukpani)
|
|
Soil
No.
|
|
4ODU
|
5ODU
|
6ODU
|
|
K
added
|
Incubation
Time (days)
|
K
Recovered
|
K
Fixed
|
K
Recovered
|
K Fixed
|
K
Recovered
|
K
Fixed
|
|
|
mg/kg
|
|
0.00
|
1
|
25.02
|
-
|
61.38
|
-
|
45.35
|
-
|
|
|
10
|
39.88
|
-
|
21.50
|
-
|
44.18
|
-
|
|
|
42
|
30.87
|
-
|
36.36
|
-
|
20.33
|
-
|
|
|
Mean
|
31.93
|
-
|
39.75
|
-
|
36.62
|
-
|
|
25.00
|
1
|
71.16
|
-21.14
|
84.06
|
2.32
|
82.89
|
-12.54
|
|
|
10
|
44.96
|
19.94
|
45.74
|
0.76
|
43.01
|
26.17
|
|
|
42
|
50.05
|
5.84
|
42.62
|
18.74
|
52.78
|
-7.45
|
|
|
Mean
|
55.39
|
1.55
|
57.47
|
7.27
|
59.56
|
2.06
|
|
50.00
|
1
|
110.26
|
-35.24
|
78.59
|
32.79
|
84.06
|
11.29
|
|
|
10
|
69.20
|
20.68
|
76.24
|
-4.24
|
55.52
|
38.66
|
|
|
42
|
66.08
|
14.81
|
67.64
|
18.72
|
60.99
|
9.34
|
|
|
Mean
|
81.85
|
0.08
|
74.16
|
15.76
|
66.86
|
19.76
|
|
100.00
|
1
|
95.79
|
29.23
|
94.62
|
66.76
|
84.06
|
61.29
|
|
|
10
|
108.69
|
31.19
|
93.84
|
27.66
|
101.65
|
42.53
|
|
|
42
|
92.27
|
38.62
|
89.14
|
47.22
|
92.27
|
28.06
|
|
|
Mean
|
98.92
|
33.01
|
92.53
|
47.21
|
92.66
|
43.96
|
|
200.00
|
1
|
96.96
|
128.02
|
117.29
|
144.09
|
136.84
|
108.51
|
|
|
10
|
125.11
|
114.77
|
113.78
|
107.72
|
10556
|
138.62
|
|
|
42
|
117.29
|
113.60
|
106.74
|
129.62
|
135.67
|
84.66
|
|
|
Mean
|
112.73
|
118.81
|
112.60
|
127.14
|
126.02
|
110.60
|
|
400.00
|
1
|
202.53
|
222.49
|
127.85
|
333.53
|
154.44
|
290.91
|
|
|
10
|
186.89
|
252.99
|
121.59
|
299.91
|
170.08
|
274.10
|
|
|
42
|
179.85
|
251.04
|
119.25
|
317.11
|
148.18
|
272.15
|
|
|
Mean
|
189.76
|
242.17
|
122.90
|
318.85
|
157.57
|
279.05
|
* ODU ; Odukpani
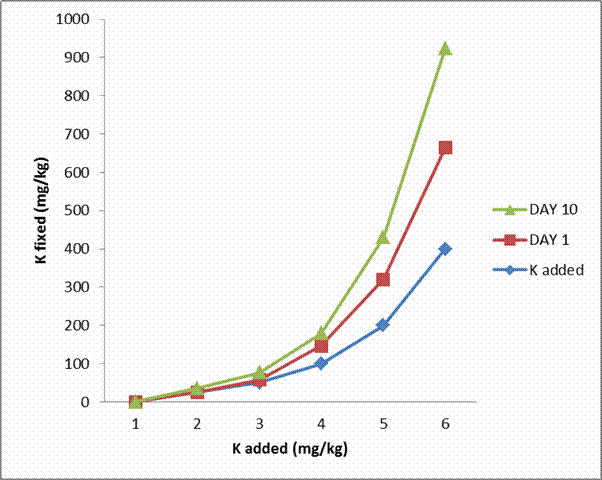
Figure 3:
Relationship between K added and the amount of K fixed with time of soils
derived from
shales
|
Table 7:
Correlation between K added and different days of incubation of soils derived
from coastal plain sand
|
|
|
Day
1
|
Day
10
|
Day
42
|
|
K
added
|
0.992**
|
0.983**
|
0.991**
|
**
= Significant P < 0.01
SUMMARY AND
RECOMMENDATION
The soils
investigated varied with respect to their properties but showed dominance of
the sand fractions, moderate to strongly acidic and predominantly of low
activity clay (ECEC < 15 cmol/kg) for soils derived from basement complex
and coastal plain sand. Some of the soil chemical properties were above the
critical limit (Mg, Na, Ca and P), available
phosphorus was below the critical limit for soils derived from basement
complex, organic carbon varied from low to moderate.
The mean
proportion of potassium fixed varied from 2.06 to 279.05 mg/kg for shales, 5.95
to 288.44 mg/kg for basement complex and 8.06 to 292.23 mg/kg for soils derived
from coastal plain sand. There was also a linear relationship between the
proportion of potassium fixed and the
amount added at higher incubation period, and best fixation was observed at 42
days of incubation for the different amount of potassium added. There was
significant correlation (P< 0.01) between potassium added and
potassium fixed during all the incubation days
Potassium fertilizer
recommendation program should take into consideration the amount of the applied
K fertilizer that is initially fixed. In general, periodic evaluation of soil
potassium is vital for rational potassium fertilizer management.
REFERENCES
1.
Aminul I, Sirajul Karimb AJM, Solaiman ARM,
Shafiqul Islam M, Abu Saleque M. (2017) Eight-year long potassium fertilization
effects on quantity/intensity relationship of soil potassium under double rice
cropping. Soil till Res.169:99–117 961-1010.
2.
Anderson, J. M. and Ingram, J. S. L (1993).
Tropical Soil Biology and Fertility; Handbook of Method of Analysis
International Wallingford, UK, 38 – 39.
3.
Ayarza, MA (1988) Potassium dynamics in a
humid tropical pasture in the Peruvian amazon.Ph.D Thesis, North Carolina State
University, Raleigh, N.C, USA, pp. 156
4.
Bilias F, Barbayiannis N. (2017) Evaluation
of sodium tetraphenylboron (NaBPh4) as a soil test of potassium availability.
Arch Agron Soil Sci. 63:468–476.
5.
Bremmer J. M. and Mulvaney, C.S. (1982). Total
Nitrogen .In : Page, A. et al. (eds) Total nitrogen. In
method of soil analysis, ed. A. L. Page, R.H Miller, and D.R Keeny, 1119-23.
Madison: American Society of Agronomy and Soil Science of America.
6.
Buysse, W, R.Stern and R.Coe (2004) Genstat
Discovery Edition for everyday use. ICRAF Nairobi, Kenya 114 pp.
7.
E.Y. Thomas, J.A.I. Omueti and G.E Nosakhare
(2019) Effects of Free Oxides on Potassium Fixation in Some Soils of Southern
Nigeria, Communication in Soil Science and Plant Analysis, 50:19, 2495-2503,
DOI: 10.1080/00103624.2019.1667370
8.
Ester Portela, Fernando Monteiro, Madalena
Fonseca and Maria M.A. (2019) Effect of Soil Mineralogy on Potassium Fixation
in Soils Developed on Different Parent Material, Geoderma 343 (2019) 226-234,
DOI: 10.1016/j.geoderma.2019.02.040.
9.
Federal Fertilizer Department (FFD) (2012)
In: Chude VO, et al. (Eds), Fertilizer use and management practices for crops
in Nigeria (3rd ed), Federal Ministry of
Agriculture and rural development, Abuja, pp 204.
10.
Ikiriko, M. E., J. A. I. Omueti, and E. Y.
Thomas (2016) Examination of percentage of aluminum saturation as a criterion
for liming tropical acid soils of Nigeria. Agricultural
Research & Technology: 1(5):555-574.doi:10.1980/ARTOAJ.2016.01.555584.
11.
Maria, R. M. , and R. Yost.(2006) A survey of soil fertility status of four
agro- ecological zones of Mozambique, Soil Science, Vol. 171, 11. USA:
Lippincott Williams and Wilkins, Inc.
12.
Nelson, D.W and Sommers L.E (1996). Total
Carbon, Organic Carbon & Organic Matter. Pp In :
Methods of Soil Analysis. Part 3: Chemical Methods. Soil. Sci. Soc. Am. Book
series, NO.5. Madison, WI., USA.
13.
Obigbesan GO (1981) Nutrient requirement of
yams (Dioscoreaspp). Faculty of Agriculture and Forestry, University of Ibadan,
Nigeria. Agric Res Bull 2(1): 20. Ibadan University Press : Ibadan
14.
Olsen, S. R and Sommers, L. E (1982).
Phosphorus In: Method of Soil Analysis; Part 2. (ed)
15.
Page, A.L., Miller, R.H Keeney, D.R and
Madison, W.I America Society of Agronomy :1572.
16.
Opara-Nadi OA, Oranekwulu SC (1988) Liming and
organic matter interactions in two Nigerian
ultisols. 1. Effects on soil pH, organic carbon and early growth of
maize (Zea mays L.). Proceedings of the 16th Annual Conf. of the Soil Science
Society of Nigeria held in Minna. Pp. 177-198.
17.
Ritchey KD, Souza DMG, Lobato E, Correa O
(1980) Calcium leaching to increase rooting depth in Brazillian Savanna Oxisol.
Agronomy Journal 72(1): 40-44.
18.
Romheld V, Neumann G (2006) The rhizosphere: contributions of the soil-root interface to
sustainable soil systems. In: Swaminathan MS (Ed.), Biological approaches to
sustainable soil systems. Taylor and Francis, UK, pp. 617-649.
19.
Srinivasa, R.C., and P.N. Takkar (2000).
Evaluation of different extractants for measuring the soil potassium and
determination of critical levels for plant available K in smectite soils for
sorghum. Indian Society of Soil Science
Journal 45:113-19
20.
Tening AS, Omueti JAI, Tarawali G (1995)
Fixation of Potassium in some soils of the sub humid zone of Nigeria. Comm Soil
Sci Plant Analysis 26(7&8): 1169-1177
21.
Thomas, I.M. (1996). Manual on Soil Physical Measurements. Version 3 Wagering,
D.L.O., Staring Center, Tech., Doc.37, Agronomy Society of America.
22.
White J R, Bell MJ, Marzies NW (2006) Effect
of sub-soil acidity treatments on the chemical properties of a ferrosol.
Proceedings of Agronomic Conference of Australia, 10th -15th September, pp.
23.
Yawson, D. O, P. K. Kwakye, F. A. Armah and
K.A. Frimpong (2011). The dynamics of potassium (K) in representative soil
series of Ghana. ARPN Journal of Agricultural and Biological Science 6(1):
48-55.
|
|
Cite this Article: Ikiriko,
ME; Kamalu, OJ; Joseph, IE (2022). Potassium fixation of some soils derived
from different parent materials in Cross River State, Nigeria. Greener Journal of Agricultural Sciences
12(1): 01-15.
|