By Yanda,
FE; Tryphone, GM (2022).
|
Greener Journal of Agricultural Sciences
ISSN: 2276-7770
Vol. 12(2), pp. 168-184, 2022
Copyright ©2022, the copyright of this article is
retained by the author(s)
https://gjournals.org/gjas
|

|
Variability of Common Bean (Phaseolus vulgaris L.) in Tanzania as Evidenced by Morphological Assessment
Focus Edson Yanda and
George Muhamba Tryphone*
Department of Crop
Science and Horticulture, College of Agriculture, Sokoine University of
Agriculture, P. O. Box 3005, Chuo Kikuu, Morogoro, Tanzania.
|
ARTICLE INFO
|
ABSTRACT
|
|
Article No.: 050122043
Type: Research
Full Text: PDF, HTML, PHP, EPUB
|
A total of 84 common bean
(Phaseolus vulgaris L.) accessions
were collected from different areas of Tanzania serving as source of
germplasm. Nineteen agro-morphological traits of 84 common bean accessions
were assessed to analyze the variability as a core objective for this study.
Among all the accessions, 40.48% were characterized by indeterminate bush
with moderate climbing ability and pods distributed evenly up to the plant
habitus followed by 36.9%. Similarly, 14.29% were the genotypes with
indeterminate bush with semi-climbing main stem and branches habitus
genotypes. Also, 14.29% were the genotypes with the indeterminate bush with
prostrate, and 7.14% were the genotypes with indeterminate bush with erect
branches habitus while 1.19% were the genotypes with determinate bush least.
Phonological, quantitative and qualitative traits were evaluated and their
scores were subjected to principal component analysis and cluster
analysis. The phylogenetic tree
demonstrated 2 major clusters which were further divided into sub-clusters.
Principal component analysis accounted for the accumulative variance of
35.78% revealing morphological variation highly attributed with variables
which had greater than 0.2 Eigen values.
The study demonstrated low morphological variation among the genotypes and
emphasized the need to broaden genetic variability of the common bean in
Tanzania. The results of this study can be used to select the valuable
breeding material for use. Besides, molecular markers can be deployed to
assess further the variability and diversity of these genotypes.
|
|
Accepted: 19/05/2022
Published: 16/06/2022
|
|
*Corresponding Author
Tryphone, GM
E-mail: muhamba@ sua.ac.tz
|
|
Keywords: Common bean, qualitative traits, quantitative traits, cluster
analysis, landraces.
|
|
|
|
INTRODUCTION
The
common bean (Phaseolus vulgaris L.; 2n = 2x = 22) is a
self-pollinated crop and the most widely grown pulse food crop of a high
nutritive value for people worldwide including Eastern and Southern Africa (CIAT,
2005). Based on archaeological observations from Peru and South-Western United
States in the late 19th century, it was concluded that the common
bean was originated from the two centers identified viz. the Andean and the
Mesoamerican. The former common bean is characterized by large seeded kidney,
cranberry, and many snap beans among others. The latter one is represented by
medium and small seeded pinto, pink, black, white, and some snap beans (Beebe
et al., 2001). Domestication and subsequent evolution of the common bean
affected the reduction of variability in morphological, physiological and other
traits, compared with wild bean (Gepts and Debouck, 1991). Thus, diverse common bean accessions represent valuable
resources for the improvement of common bean, since co-adapted genes of
different accessions can convey similar response to natural and artificial
selection pressure if selected for a specific trait.
In Tanzania, the
utilization of common bean accessions by plant breeders in their breeding
programs is restricted due to lack of official reports or publications about
these genetic resources (CIAT, 2008). More than 150 landraces are cultivated by
small scale farmers but their data base is not yet officially reported. There is a considerable number of common
beans conserved at the NPGRC in Tanzania involving many newly released
varieties but both of them face several emerging threats including new
persistent diseases, pests, environmental stresses and commercialization as
well as socio-economic and political factors. Knowledge about the extent of
genetic diversity, identification, differentiation, and characterization of
genotypes and populations provides information tool for detection of duplicates
in the collection, their effective extension, a characterization and
utilization in breeding programs (Beebe et al., 2000). Further, exploration of
promising lines is important for genetic improvement of particular traits.)
Therefore, this study focuses on the assessment of common bean accessions to detect
desirable genotypes for breeding program. This allows the breeder to identify
valuable traits or potentially valuable genotypes more efficiently and faster.
MATERIALS
AND METHODS
Location of the study
The study was
conducted at Sokoine University of Agriculture (SUA)-Morogoro, Tanzania at
screen housed behind African Seed building located at latitude 6⁰84’795’’
S and 37⁰65’904’’ E at 543 m above the sea level. The
study was for the period of December 2017 to October 2018.
Genotypes
collection
A total of
eighty-four common bean genotypes were collected from National Plant Genetic
Resource Center (NPGRC) at Arusha, Uyole National Research Institute (UNRI) at
Mbeya and SUA at Morogoro. They were then stored in a cold room before planting
at Sokoine University of Agriculture, Department of Crop Science and
Horticulture. The genotypes collected
were diverse, representing a range of seed types involving seed coat color,
size and shape. The accessions are
indicated in Table 1.
|
S/N
|
Given accession
numbers
|
Local name
|
Classification
|
Collection place
|
|
1
|
SUA10
|
Jesca
|
Improved
|
Morogoro
|
|
2
|
SUA11
|
Selian 94
|
Improved
|
Morogoro
|
|
3
|
SUA16
|
Msolin
|
Improved
|
Morogoro
|
|
4
|
NPGRC 69
|
Kasukanywele
|
Landrace
|
Rukwa
|
|
5
|
NPGRC 70
|
Kablanketi
|
Landrace
|
Rukwa
|
|
6
|
SUA111
|
Soya Nano
|
Improved
|
Morogoro
|
|
7
|
NPGRC 133
|
Chilemba 3
|
Landrace
|
Rukwa
|
|
8
|
NPGRC 134
|
Chilemba4
|
Landrace
|
Rukwa
|
|
9
|
NPGRC 135
|
Chilemba5
|
Landrace
|
Rukwa
|
|
10
|
NPGRC 147
|
Ilanda / Kalinso
|
Landrace
|
Rukwa
|
|
11
|
SUA180
|
Canadian Wonder
|
Improved
|
Morogoro
|
|
12
|
NPGRC 188
|
Imponzo8
|
Landrace
|
Mbeya
|
|
13
|
NPGRC 198
|
Imponzo9
|
Landrace
|
Mbeya
|
|
14
|
SUA200
|
Roba
|
Improved
|
Morogoro
|
|
15
|
NPGRC 218
|
Malima / Ndondo
|
Landrace
|
Mbeya
|
|
16
|
SUA222
|
Beti 10
|
Improved
|
Morogoro
|
|
17
|
NPGRC 286
|
Chilanda 6
|
Landrace
|
Rukwa
|
|
18
|
NPGRC 287
|
Chilanda 7
|
Landrace
|
Rukwa
|
|
19
|
NPGRC 306
|
Chilemba 6
|
Landrace
|
Rukwa
|
|
20
|
NPGRC 307
|
Chilemba 7
|
Landrace
|
Rukwa
|
|
21
|
NPGRC 331
|
Imponzo 1
|
Landrace
|
Mbeya
|
|
22
|
SUA333
|
Lyamungu 85
|
Improved
|
Morogoro
|
|
23
|
NPGRC 334
|
Imponzo 4
|
Landrace
|
Mbeya
|
|
24
|
NPGRC 335
|
Imponzo 5
|
Landrace
|
Mbeya
|
|
25
|
NPGRC 337
|
Imponzo 7
|
Landrace
|
Mbeya
|
|
26
|
SUA401
|
Fibea
|
Improved
|
Morogoro
|
|
27
|
SUA444
|
Lyamungo 90
|
Improved
|
Morogoro
|
|
28
|
SAU500
|
Selian 05
|
Improved
|
Morogoro
|
|
29
|
SUA501
|
Cal 143
|
Improved
|
Morogoro
|
|
30
|
SUA601
|
Msafiri
|
Improved
|
Morogoro
|
|
31
|
SUA777
|
Selian 06
|
Improved
|
Morogoro
|
|
32
|
SUA800
|
Nanka
|
Improved
|
Morogoro
|
|
33
|
SUA808
|
Mkanamna
|
Improved
|
Morogoro
|
|
34
|
SUA909
|
Nanavala
|
Improved
|
Morogoro
|
|
35
|
SUA1001
|
Zawadi
|
Improved
|
Morogoro
|
|
36
|
SUA1003
|
Mshindi
|
Improved
|
Morogoro
|
|
37
|
SAU1007
|
Pesa
|
Improved
|
Morogoro
|
|
38
|
SUA1009
|
Rojo
|
Improved
|
Morogoro
|
|
39
|
SUA1010
|
Sua 90
|
Improved
|
Morogoro
|
|
40
|
SAU1300
|
Maini
|
Improved
|
Morogoro
|
|
41
|
SUA1400
|
Kigoma
|
Improved
|
Morogoro
|
|
42
|
NPGRC1604
|
Tichakuronza
|
Landrace
|
Kagera
|
|
43
|
NPGRC 2154
|
Biliomunyungu
|
Landrace
|
Kagera
|
|
44
|
NPGRC 2158
|
Kanyamunywa
|
Landrace
|
Kagera
|
|
45
|
NPGRC 2178
|
Mwanamwana
|
Landrace
|
Kagera
|
|
46
|
NPGRC 2190
|
Kibeho
|
Landrace
|
Kagera
|
|
47
|
NPGRC 2213
|
Ndimila Enkobe
|
Landrace
|
Kagera
|
|
48
|
NPGRC 2220
|
Rukurulana
|
Landrace
|
Kagera
|
|
49
|
NPGRC 3005
|
Njano Ndefu
|
Landrace
|
Kigoma
|
|
50
|
NPGRC 3119
|
Mwolo -Yellow
|
Landrace
|
Kigoma
|
|
51
|
NPGRC 3120
|
Mulembegwa
|
Landrace
|
Kigoma
|
|
52
|
NPGRC 3141
|
Mbuvamutwe
|
Landrace
|
Kigoma
|
|
53
|
NPGRC 3150
|
Mutsinga
|
Landrace
|
Kigoma
|
|
54
|
NPGRC 3153
|
Gwezamenyo
|
Landrace
|
Kigoma
|
|
55
|
NPGRC 3154
|
Nyamanza
|
Landrace
|
Kigoma
|
|
56
|
NPGRC 3155
|
Mwanja
|
Landrace
|
Kigoma
|
|
57
|
NPGRC 3156
|
Seredi
|
Landrace
|
Kigoma
|
|
58
|
NPGRC 3157
|
Kalambi
|
Landrace
|
Kigoma
|
|
59
|
NPGRC 3164
|
Mamesa
|
Landrace
|
Kigoma
|
|
60
|
NPGRC 3175
|
Kashiransoni
|
Landrace
|
Kigoma
|
|
61
|
NPGRC 3182
|
Ugweza
|
Landrace
|
Kigoma
|
|
62
|
NPGRC 3511
|
Maharage - Kienyeji
|
Landrace
|
Kigoma
|
|
63
|
NPGRC 3816
|
Maharage Karanga
|
Landrace
|
Kigoma
|
|
64
|
NPGRC 4221
|
Shona
|
Landrace
|
Kagera
|
|
65
|
NPGRC 4248
|
Ruhondela
|
Landrace
|
Kagera
|
|
66
|
NPGRC 4258
|
Inula
|
Landrace
|
Kagera
|
|
67
|
NPGRC 4259
|
Kya Karagwe
|
Landrace
|
Kagera
|
|
68
|
NPGRC 4265
|
Kisapuli
|
Landrace
|
Kagera
|
|
69
|
NPGRC 4269
|
Maliwalinda
|
Landrace
|
Kagera
|
|
70
|
NPGRC 4312
|
Fukama Okole
|
Landrace
|
Kagera
|
|
71
|
NPGRC 4322
|
Shona Egunia
|
Landrace
|
Kagera
|
|
72
|
NPGRC 4336
|
Kiisiki
|
Landrace
|
Kagera
|
|
73
|
NPGRC 4352
|
Ruvunja
|
Landrace
|
Kagera
|
|
74
|
UYL5009
|
Uyole84
|
Improved
|
Mbeya
|
|
75
|
UYL5010
|
Njano Uyole
|
Improved
|
Mbeya
|
|
76
|
UYL5011
|
Calima Uyole
|
Improved
|
Mbeya
|
|
77
|
UYL5012
|
Uyole 16
|
Improved
|
Mbeya
|
|
78
|
UYL5013
|
Uyole 96
|
Improved
|
Mbeya
|
|
79
|
UYL5015
|
Nyeupe Uyole
|
Improved
|
Mbeya
|
|
80
|
UYL5016
|
Uyole 04
|
Improved
|
Mbeya
|
|
81
|
UYL5017
|
Uyole 03
|
Improved
|
Mbeya
|
|
82
|
UYL5018
|
Pasi
|
Improved
|
Mbeya
|
|
83
|
UYL5020
|
Uyole 94
|
Improved
|
Mbeya
|
|
84
|
SUA6301
|
Cheupe
|
Improved
|
Morogoro
|
Key: UYL- Uyole, SUA-Sokoine University of
Agriculture.
Soil
sampling and chemical analysis
Composite
soil samples obtained were analyzed as described by (Carter, 1993). Bulk soil
samples were taken at a depth of 0 - 20 cm on an area of 2 × 2 m2.
Composite soil constituted nine sub-samples randomly collected from forestry
area covering 1.0 ha. Sub-samples were thoroughly mixed, sterilized, air dried
and ground to pass through an 8.0 mm mesh. The 2.0 mm sieved composite soil
samples were used for physical and chemical analyses in the laboratory. Composite soil samples were analyzed for pH, cation
exchange capacity, exchangeable bases (Ca, K, Mg and Na), micronutrients (Fe,
Zn, Mn and Cu), nitrogen, available P, particle size distribution and organic
carbon (OC) as described by (Carter, 1993). The soil pH was determined in water
at a soil: water ratio of 1:2.5 suspension using pH meter (Thomas, 1996).
Electrical conductivity was measured in 1: 2.5 soil: water using the electric
conductivity meter (Thomas, 1996). Cation exchange capacity (CEC) was
determined by the ammonium-acetate saturation method and quantification of
exchangeable bases: K, Ca, Na and Mg were determined from the ammonium-acetate
filtrates following the Lindsay and Norvel (1978) methods. Exchangeable calcium
(Ca) and magnesium (Mg) were determined by atomic absorption spectrophotometry
whereas K and Na were extracted using ammonium acetate and analyzed by flame
spectrophotometry.
The DTPA extractable
Cu, Fe, Mn and Zn were determined by atomic absorption spectrophotometry (Lindsay
and Norvel, 1998). Total nitrogen was determined by the micro-Kjeldahl
digestion distillation method (Bremner and Mulvaney, 1982). Soil extractable P
was determined by using the Bray-1-P method (Kuo, 1996) and colour was
developed by the ascorbic acid-molybdate blue method Organic carbon was
determined by the Walkley-Black wet combustion method. Particle size analysis
was determined by the hydrometer method after dispersing the soil samples with
sodium hexametaphosphate solution (Gee and Baunder, 1986). Soil textural
classes were determined using the USDA textural class triangle (USDA, 1975).
Screen
house experimentation and agronomical practices
Eighty-four genotypes
were arranged in a completely randomized design (CRD) and replicated three
times. Before sowing, the 4 kg potted soil was watered and allowed to stay for
one day. Four seeds were sown; thinning was done at age of 10 days after
emergence. Irrigation by re-introducing trapped water (infiltrates) on bottomed
trays was carried out regularly to maintain the moisture content.
Data collection
With the guide according to the
International Board for Plant Genetic Resources (IBPGR) descriptors for Phaseolus vulgaris L. documentation (CIAT,
1987), a total of twenty traits were scored. Three (4) phenological traits were
recorded viz. days to emergence (ED), days
to flowering, days to 50% flowering days (DTFLO) and days to 90% maturity.
Twelve qualitative traits including hypocotyl color (HYP.CLR), emerging
cotyledon color (COT.CLR), growth habit (Gr.H), color of standard (CLRSTD),
color of wings (CLRWNG), pod color (PDCLR) was also recorded. Other recorded
traits included seed coat patterns (SCt.P), seed coat color (SCt.CLR), pod
curvature (PDCUV), seed shape (SDSHP), brilliance of the seed (SD.BR) and seed
size (SSize). Four (5) traits were quantitative which included; number of pods
per plant (No. PDpP), pod length (PDL), locules per pod (LOC/PD), seeds per pod
(SD/PD) and 100 seeds weight (100Ws).
Distribution
analysis
Numerical
values for the categorical traits from the 84 common bean genotypes were coded
according to descriptor list (CIAT, 1987)]. Frequency distributions, minimum,
maximum, standard deviation and correlations among traits were analyzed using
the XLSTAT program, 2018.
Cluster
analysis
Numerical
values for the categorical traits from the 84 common bean genotypes were coded
according to I descriptor list (CIAT, 1987). Data were analyzed by numerical
taxonomy techniques, using XLSTAT 2018.
Unweighted pair-group average (UPGA) of Hierarchical was used for
cluster analysis and development of the dendrogram of the common bean genotypes
based on 21 agro-morphological traits.
The
phenotypic diversity of the traits was analyzed with the Pearson correlation
aided with Principal component analysis (PCA) on ranged data with linear
dimensionality reduction using XLSTAT (2018) to project the data into lower
dimensions and to display genetically related genotypes in clusters (Mohammadi
and Prasanna, 2003). The PCA was also used to show the traits which accounted
for significant variation in the common bean germplasm.
RESULTS
Soil
chemical analysis
The experimental
forestry soils had medium to high chemical and sandy clay loam textural class
as physical characteristics (Table 2). The analyzed composite forestry soil
based on the selected soil parameters showed optimal condition that favors
growth of common bean as described (Landon, 1991). Therefore, the forestry
soils were suitable for production of common beans and other field crops like
cereals.
Table 2: Physical-chemical properties of
the experimental forestry soil
|
Soil parameter
|
Values
|
Remark (Landon, 1991)
|
|
pH in water
|
6.79
|
Neutral
|
|
Electrical
Conductivity (EC) (µS/cm)
|
451
|
Medium
|
|
Cationic Exchange
Capacity (CEC)
|
32.6
|
High
|
|
Organic Carbon (% OC)
|
2.62
|
High
|
|
Organic matter (% OM)
|
4.52
|
High
|
|
Nitrogen (%)
|
0.50
|
Medium
|
|
C:N
|
9.04
|
Good quality of the Organic Matter
|
|
Phosphorous (mgkg-1)
|
9.33
|
Medium
|
|
Extractable K (Cmol(+)
kg-1)
|
1.90
|
High
|
|
Extractable Na
(Cmol(+) kg-1)
|
0.14
|
Low
|
|
Extractable Mg
(Cmol(+) kg-1)
|
0.41
|
Low
|
|
Extractable Ca
(Cmol(+) kg-1)
|
16.85
|
High
|
|
DTPA Extractable
micronutrients
(mg kg-1)
|
|
|
|
Fe
|
34.96
|
High
|
|
Zn
|
4.08
|
High
|
|
Mn
|
237.49
|
High
|
|
Particle size analysis
(PSA)
|
|
|
|
%Clay
|
33.56
|
|
|
%Silt
|
9.64
|
|
|
%Sand
|
56.8
|
|
|
Textural class
|
Sandy clay loam (USDA,
1975)
|
Distribution
of characters
Phenological
traits
After planting, a
total of 34 (40.48%) and 32 (39.29%) common bean genotypes took five and six
days respectively to emerge while 12 genotypes (14.29%) emerged early (4 days)
and 5 genotypes (5.95%) emerged late (7 days). The maximum, minimum, mean and
standard deviation values for the 21 agro-morphological traits among the
genotypes are shown in Table 3. The traits were significantly (P<0.01)
different among the genotypes. Mean early flowering days among genotypes was 22
days for 3 (3.57%) genotypes, mean late flowering days among genotypes was 30
days for 1 (1.19%) genotype and majority had mean flowering days of 25 days for
19 (22.62%) genotypes. Among the genotypes, the 90% maturity day ranged from 65
to 73 days whereby 3 (3.57%) genotypes matured early when it was 65 days, high
number of genotypes (19) 22.62% matured full after 68 days and the late
maturing genotype (1)1.19% was observed at 73 days averagely (Table 4).
Table 3:
The maximum, minimum, mean and standard deviation values for the 21
agro-morphological traits.
|
S/N
|
Variables
|
|
Minimum
|
Maximum
|
Mean
|
SD
|
|
1
|
Days to emergence
|
|
4
|
7
|
5.369
|
0.803
|
|
2
|
Cotyledon color
|
|
1
|
6
|
3.012
|
0.898
|
|
3
|
Hypocotyl color
|
|
1
|
3
|
1.976
|
0.346
|
|
4
|
Flowering days
|
|
22
|
29.667
|
24.988
|
1.744
|
|
5
|
Days to 50% flowering
|
|
27
|
34.667
|
29.988
|
1.744
|
|
6
|
Days to 90% maturity
|
|
64
|
71.667
|
66.988
|
1.744
|
|
7
|
Color of wings
|
|
1
|
9
|
2.702
|
2.368
|
|
8
|
Color of standard
petals
|
|
1
|
9
|
2.702
|
2.368
|
|
9
|
Color of immature pod
|
|
3
|
9
|
6.476
|
1.177
|
|
10
|
Pod length (cm)
|
|
4.58
|
13
|
8.112
|
1.362
|
|
11
|
Brilliance of the seed
|
|
2
|
3
|
2.119
|
0.326
|
|
12
|
Seed shape
|
|
1
|
5
|
3.643
|
1.411
|
|
13
|
Seed coat color
|
|
2
|
16
|
6.321
|
3.777
|
|
14
|
Seed coat patterns
|
|
0
|
9
|
2.798
|
3.474
|
|
15
|
Number of locules per
pod
|
|
2
|
5
|
3.242
|
0.598
|
|
16
|
Pod curvature
|
|
1
|
3
|
1.690
|
0.620
|
|
17
|
Growth habit
|
|
1
|
5
|
4.083
|
0.972
|
|
18
|
Number of pods per
plant
|
|
1.833
|
15.333
|
6.893
|
2.448
|
|
18
|
Number of seeds per
pod
|
|
1.350
|
6.859
|
2.504
|
0.743
|
|
20
|
100 seeds weight (g)
|
|
15.404
|
)59.977
|
31.974
|
8.337
|
|
21
|
Seed size
|
|
1
|
3
|
1.964
|
0.610
|
Quantitative
traits
Number of pods per
plant ranged from 1.83 to 15.33. A range of pod length was 4.6 to 13.0 cm and
number of locules per pod was 2 to 5.
The number of seeds per pod ranged from 1.35 to 6.86 and the 100 seeds
weight ranged from 15.4 g to 60.0 g (Table 3).
Qualitative
traits
Predominantly
emerging cotyledon color of most genotypes (82.14%) was green (COT.CLR), 8.33% was
purple, 5.95% was very pale green, 2.38% was pinkish and 1.19% was reddish.
Most genotypes (86.9%) had green colored hypocotyl (HYP.CLR), 7.14% of
genotypes had purple color; while 4.76% were pale green colored hypocotyl. The
predominant growth habit (Gr.H) was indeterminate bush with moderate climbing
ability and pods distributed evenly up to the plant (40.48%), followed by
indeterminate bush with semi-climbing main stem and branches (36.9%), then
indeterminate bush with prostrate (14.29%), indeterminate bush with erect
branches (7.14%) and determinate bush least (1.19%).
In freshly opened
flowers, 48 genotypes (57.14%) had white predominant color of standard petals
(CLRSTD). Others were white with lilac edges (34.52%) for 29 genotypes and
purple (8.33%) for 7 genotypes. Most accessions (57.14%) had white colour of
flower wings (CLRWG), while 34.52% were white with carmine strips, and 8.33%
purple. The predominant fully expanded immature pod color among 84 genotypes,
69 genotypes had green pod (82.14%). Others were carmine stripe on green
(7.14%) for 6 genotypes, pale red stripe on green (5.95%) for 5 genotypes, and
purple stripe on green (4.76%) for 4 genotypes as shown in Table 4. Forty-four
(44) common bean genotypes (52.4%) had slightly curved pods (PDCUV), 33
genotypes (39.3%) had straight pods and 7 genotypes (8.3%) were curved pods.
The dominant seed
coat colour was maroon (26.2%) for 22 genotypes. Others were brown yellow 25%
for 21 genotypes followed with, whitish seed coat color 13.1% for 11 genotypes,
yellow to greenish yellow 9.5% for 8 genotypes, purplish seed coat color 7.1%
for 6 genotypes, both brown and grey, brown to greenish seed coat colors 6% for
5 genotypes respectively, both brown, pale to black and pale cream to buff seed
color 2.4% for 2 genotypes and were both green to olive and pinkish seed color
least (1.2%) for 1 genotype. Thirty-six genotypes (42.9%) had no seed coat
patterns. Also, 22 genotypes (26.2%) had stripped seeds, 18 genotypes (21.4%)
had spotted bicolor seeds, 8 genotypes (8.3%) had speckled seeds and 1 genotype
(1.2%) had constantly mottled seeds. The dominant seed shape was truncate
fastigiated in 31 genotypes (36.9%) followed by the kidney shaped seed in 22 genotypes
(26.2%), cuboid in 13 genotypes (15.6%), round shaped seed in 12 genotypes
(14.3%) and oval shaped seeds in 6 genotypes (7.1%). The predominantly seed
size was medium in 53 genotypes which accounted of 63.10%, small seeded
genotypes were 17 (20.24%) and larger seeded genotypes were 14 (16.67%) (Table
4).
|
Scores
|
Morphological trait
|
Frequency
|
Percentage
|
|
|
Days to emergence
|
|
|
|
|
4
|
12
|
14.29
|
|
|
5
|
34
|
40.48
|
|
|
6
|
33
|
39.29
|
|
|
7
|
5
|
5.95
|
|
|
Cotyledon color
|
|
|
|
1
|
Purple
|
7
|
8.333
|
|
2
|
Red
|
1
|
1.190
|
|
3
|
Green
|
69
|
82.14
|
|
4
|
White
|
0
|
0.00
|
|
5
|
Very pale green
|
5
|
5.95
|
|
6
|
Pinkish
|
2
|
2.38
|
|
7
|
Others (Specify)
|
0
|
0.00
|
|
|
Hypocotyl color
|
|
|
|
1
|
Purple
|
6
|
7.14
|
|
2
|
Green
|
73
|
86.91
|
|
3
|
Pale green
|
4
|
4.76
|
|
4
|
Others (specify)
|
0
|
0.00
|
|
|
Growth habit
|
|
|
|
1
|
Determinate bush
|
1
|
1.19
|
|
2
|
Indeterminate bush
with erect branches
|
6
|
7.14
|
|
3
|
Indeterminate bush
with prostrate branches
|
12
|
14.29
|
|
4
|
Indeterminate with
semi-climbing main stem and branches
|
31
|
36.91
|
|
5
|
Indeterminate with
moderate climbing ability and pods distributed evenly up to the plant
|
34
|
40.48
|
|
6
|
Indeterminate with
aggressive climbing ability and pods mainly on the upper nodes of the plant
|
0
|
0.00
|
|
7
|
Others (Specify)
|
0
|
0
|
|
|
Color of standard
|
|
|
|
1
|
White
|
48
|
57.14
|
|
2
|
Green
|
0
|
0
|
|
3
|
Lilac
|
0
|
0
|
|
4
|
White with lilac edge
|
29
|
34.53
|
|
5
|
White with red strips
|
0
|
0
|
|
6
|
Dark lilac purple
outer edge
|
0
|
0
|
|
7
|
Dark lilac with
purplish spots
|
0
|
0
|
|
8
|
Carmine red
|
0
|
0
|
|
9
|
Purple
|
7
|
8.33
|
|
10
|
Others (specify)
|
0
|
0
|
|
11
|
Pink
|
0
|
0
|
|
|
Color of wings
|
|
|
|
1
|
White
|
48
|
57.14
|
|
2
|
Green
|
0
|
0
|
|
3
|
Lilac
|
0
|
0
|
|
4
|
White with carmine
strips
|
29
|
34.52
|
|
5
|
Strongly veined in red
to dark lilac
|
0
|
0
|
|
6
|
Plain red to dark
lilac
|
0
|
0
|
|
7
|
Lilac with dark lilac
veins
|
0
|
0
|
|
8
|
Others (specify)
|
0
|
0
|
|
9
|
Purple
|
7
|
8.33
|
|
|
Pod color
|
|
|
|
1
|
Dark purple
|
0
|
0
|
|
2
|
Carmine red
|
0
|
0
|
|
3
|
Purple stripe on green
|
4
|
4.76
|
|
4
|
Carmine stripe on
green
|
6
|
7.14
|
|
5
|
Pale reed stripe on
green
|
5
|
5.95
|
|
6
|
Dark pink (rose)
|
0
|
0
|
|
7
|
Normal green
|
69
|
82.14
|
|
8
|
Shiny green
|
0
|
0
|
|
9
|
Dull green to deep
yellow
|
0
|
0
|
|
10
|
Golden or deep yellow
|
0
|
0
|
|
11
|
Pale yellow to white
|
0
|
0
|
|
12
|
Others (specify)
|
0
|
0
|
|
|
Pod curvature
|
|
|
|
1
|
Straight
|
33
|
39.29
|
|
2
|
Slightly curved
|
44
|
52.38
|
|
3
|
Curved
|
7
|
8.33
|
|
4
|
Recurving
|
0
|
0
|
|
|
Seed coat color
|
|
|
|
1
|
Black
|
0
|
0
|
|
2
|
Brown, pale to black
|
2
|
2.38
|
|
3
|
Maroon
|
22
|
26.19
|
|
4
|
Brown
|
5
|
5.95
|
|
5
|
Brown yellow
|
21
|
25
|
|
6
|
Grey, brownish to
greenish
|
5
|
5.95
|
|
7
|
Yellow to greenish
yellow
|
8
|
9.52
|
|
8
|
Pale-cream to buff
|
2
|
2.381
|
|
9
|
Pure white
|
0
|
0
|
|
10
|
10. Whitish
|
11
|
13.10
|
|
11
|
White, purple tinged
|
0
|
0
|
|
12
|
Tan green
|
0
|
0
|
|
13
|
Green to olive
|
1
|
1.19
|
|
14
|
Reddish
|
0
|
0
|
|
15
|
Pinkish
|
1
|
1.19
|
|
16
|
Purplish
|
6
|
7.14
|
|
17
|
Others (specify)
|
0
|
0
|
|
|
Seed coat patterns
|
|
|
|
0
|
Absent
|
36
|
42.86
|
|
1
|
Constant mottled
|
1
|
1.19
|
|
2
|
Stripped
|
22
|
26.19
|
|
3
|
Rhomboid spotted
|
0
|
0
|
|
4
|
Speckled
|
7
|
8.33
|
|
5
|
Circular mottling-
|
0
|
0
|
|
6
|
Marginal color
patterns
|
0
|
0
|
|
7
|
Broad stripped
|
0
|
0
|
|
8
|
Bicolor
|
0
|
0
|
|
9
|
Spotted bicolor
|
18
|
21.43
|
|
10
|
Patterns around
|
0
|
0
|
|
11
|
Others (specify)
|
0
|
0
|
|
|
Seed shape
|
|
|
|
1
|
Round
|
12
|
14.29
|
|
2
|
Oval
|
6
|
7.14
|
|
3
|
Cuboid
|
13
|
15.48
|
|
4
|
Kidney shaped
|
22
|
26.19
|
|
5
|
Truncate fastigiated
|
31
|
36.90
|
|
|
Seed Size
|
|
|
|
1
|
Small (when 100Ws is less than 25 g)
|
17
|
20.24
|
|
2
|
Medium (when 100Ws ranges from 25 to 40 g)
|
53
|
63.10
|
|
3
|
Large (when 100Ws is above 40 g) [16]
|
14
|
16.67
|
Phenotypic
correlations among traits
Pair wise
correlations among traits are shown in Table 5. The most strongly correlated
traits were flowering days (FD) (r = 1) with 50% flowering days (50%FLWD), color
of wings (W.CLR) (r = 1) with the color of standard (CLR.STD) and 100 seeds
weight (r = 0.848, p<0.05) with seed size. Medium positive correlation was observed
between cotyledon color trait (CCL) (r = 0.659, p<0.05) and the hypocotyl
color (HYP.CRL), but lowest positive correlation was between days of emergence (ED)
(r = 0.007) and number of seeds per pod (SDPD). The medium negative correlation
(r = -0.494) between color of wings (W.CLR) and hypocotyl color was significant
(p<0.05) similar to correlation between color of standard petals (STD.CLR)
(r = -0.494) and hypocotyl color (H.CLR). The lowest negatively correlation was
between 100 seeds weight and hypocotyl color (r = -0.004).
Table 5:
Correlation coefficients among 21 morphological traits of common bean
accessions from regions of Tanzania
|
Variables
|
1
|
2
|
3
|
4
|
5
|
6
|
7
|
8
|
9
|
10
|
11
|
12
|
13
|
14
|
15
|
16
|
17
|
18
|
19
|
20
|
21
|
|
ED
|
1
|
|
|
|
|
|
|
|
|
|
|
|
|
|
|
|
|
|
|
|
|
|
CCLR
|
0.011ns
|
1
|
|
|
|
|
|
|
|
|
|
|
|
|
|
|
|
|
|
|
|
|
HCLR
|
-0.055ns
|
0.659***
|
1
|
|
|
|
|
|
|
|
|
|
|
|
|
|
|
|
|
|
|
|
FD
|
-0.048ns
|
0.041ns
|
-0.087ns
|
1
|
|
|
|
|
|
|
|
|
|
|
|
|
|
|
|
|
|
|
50% FD
|
-0.048ns
|
0.041ns
|
-0.087ns
|
1
|
1
|
|
|
|
|
|
|
|
|
|
|
|
|
|
|
|
|
|
90% MD
|
-0.048ns
|
0.041ns
|
-0.087ns
|
1
|
1
|
1
|
|
|
|
|
|
|
|
|
|
|
|
|
|
|
|
|
CLRW
|
0.039ns
|
-0.412***
|
-0.494***
|
-0.006ns
|
-0.006ns
|
-0.006ns
|
1
|
|
|
|
|
|
|
|
|
|
|
|
|
|
|
|
STDCLR
|
0.039ns
|
-0.412***
|
-0.494***
|
-0.006ns
|
-0.006ns
|
-0.006ns
|
1
|
1
|
|
|
|
|
|
|
|
|
|
|
|
|
|
|
PCLR
|
-0.022ns
|
0.211ns
|
0.235*
|
-0.099ns
|
-0.099ns
|
-0.099ns
|
-0.333**
|
-0.333**
|
1
|
|
|
|
|
|
|
|
|
|
|
|
|
|
PL
|
0.299**
|
-0.063ns
|
-0.047ns
|
0.127ns
|
0.127ns
|
0.127ns
|
0.141ns
|
0.141ns
|
-0.126ns
|
1
|
|
|
|
|
|
|
|
|
|
|
|
|
BR.SD
|
0.244*
|
0.119ns
|
0.025ns
|
-0.316**
|
-0.316**
|
-0.316**
|
0.015ns
|
0.015ns
|
0.165ns
|
-0.183ns
|
1
|
|
|
|
|
|
|
|
|
|
|
|
SD.SH
|
-0.074ns
|
0.041ns
|
0.056ns
|
0.259**
|
0.259**
|
0.259**
|
-0.047ns
|
-0.047ns
|
-0.143ns
|
0.038ns
|
-0.116ns
|
1
|
|
|
|
|
|
|
|
|
|
|
SDC.CLR
|
-0.143ns
|
0.049ns
|
0.19ns
|
0.077ns
|
0.077ns
|
0.077ns
|
-0.153ns
|
-0.153ns
|
0.233*
|
-0.034ns
|
-0.139ns
|
-0.069ns
|
1
|
|
|
|
|
|
|
|
|
|
SDC.P
|
0.372***
|
-0.053ns
|
-0.124ns
|
0.019ns
|
0.019ns
|
0.019ns
|
0.111ns
|
0.111ns
|
-0.256**
|
0.202ns
|
-0.127ns
|
-0.032ns
|
-0.135ns
|
1
|
|
|
|
|
|
|
|
|
LOC/PD
|
-0.038ns
|
-0.178ns
|
-0.146ns
|
0.336**
|
0.336**
|
0.336**
|
0.182ns
|
0.182ns
|
-0.114ns
|
0.456***
|
-0.17ns
|
0.17ns
|
-0.058ns
|
-0.03ns
|
1
|
|
|
|
|
|
|
|
PD.CUR
|
0.159ns
|
-0.058ns
|
-0.035ns
|
0.067ns
|
0.067ns
|
0.067ns
|
0.092ns
|
0.092ns
|
-0.159ns
|
0.261**
|
0.065ns
|
0.079ns
|
-0.296**
|
-0.035ns
|
0.172ns
|
1
|
|
|
|
|
|
|
GH
|
-0.318**
|
-0.043ns
|
-0.066ns
|
0.297**
|
0.297**
|
0.297**
|
-0.026ns
|
-0.026ns
|
-0.088ns
|
0.035ns
|
-0.26*
|
0.189ns
|
0.078ns
|
-0.22ns
|
0.062ns
|
0.103ns
|
1
|
|
|
|
|
|
PD/P
|
-0.069ns
|
-0.041ns
|
0.011ns
|
-0.064ns
|
-0.064ns
|
-0.064ns
|
0.094ns
|
0.094ns
|
-0.119
|
0.062ns
|
0.024ns
|
0.115ns
|
0.026**
|
-0.196ns
|
0.345**
|
0.088ns
|
0.052ns
|
1
|
|
|
|
|
SD/PD
|
0.007ns
|
-0.061ns
|
0.019ns
|
0.094ns
|
0.094ns
|
0.094ns
|
0.058ns
|
0.058ns
|
-0.104ns
|
0.259**
|
-0.131ns
|
-0.041ns
|
-0.038ns
|
0.061ns
|
0.422***
|
0.098ns
|
-0.078ns
|
0.105ns
|
1
|
|
|
|
100Ws
|
0.291**
|
0.029ns
|
0.015ns
|
-0.332**
|
-0.332**
|
-0.332**
|
0.162ns
|
0.162ns
|
-0.044ns
|
0.095ns
|
0.214ns
|
-0.378***
|
0.051ns
|
0.208ns
|
-0.35**
|
-0.098ns
|
-0.305**
|
-0.238*
|
-0.228ns
|
1
|
|
|
SDSZ
|
0.322**
|
0.023ns
|
-0.004ns
|
-0.261**
|
-0.261**
|
-0.261**
|
0.109ns
|
0.109ns
|
-0.127ns
|
0.103ns
|
0.204ns
|
-0.351***
|
-0.115ns
|
0.156ns
|
-0.351**
|
-0.093ns
|
-0.3**
|
-0.265**
|
-0.214ns
|
0.848***
|
1
|
|
|
|
|
|
|
|
|
|
|
|
|
|
|
|
|
|
|
|
|
|
|
|
|
|
|
|
|
|
|
|
|
|
|
|
|
|
|
|
|
|
KEY: ED- Emergency
days, CCLR-Cotyledon colour, HCLR-hypocotyl color, FD- Flowering days, MD-
Maturity days, CLRW- Colour of wings, STDCLR-Standard colour of petal, PCLR-Pod
colour, PL-Pod length, BR.SD-Brilliance of the seeds, SDSH-Seed shape, SDC.CLR-
Seed coat colour, SDC.P-seed coat patterns, LOC/PD-Locules per pod, PD.CUR-pod
curvature, GH-Growth habit, PD/p-pod per plant, SD/PD-Seeds per pod, 100Ws- 100
Seed Weigh and SDSZ- Seed size.
ns-No significant
differences. *- Significant differences, ** Highly significant differences,
***-Very highly significant differences
Morphological
diversity
Principal
component analysis
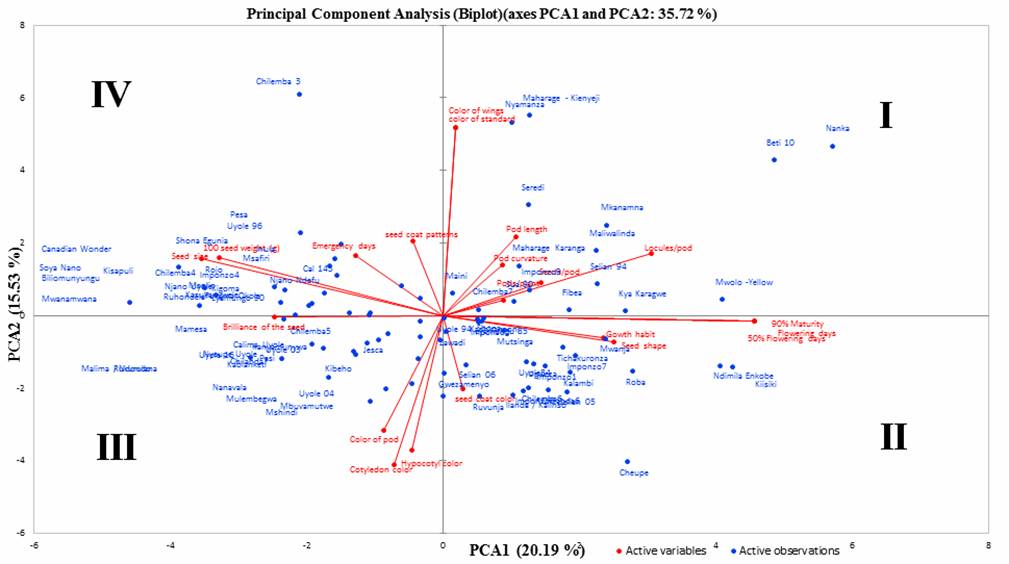
The morphological
characterization was required to describe the phenotypic variability in common
bean genotypes collected from different regions of Tanzania. The PCA reduced
the data to a few dimensions and explained 35.723% of total phenotypic
variation in the germplasm as presented in Table 6. Eigen-values for these
traits show that for the first component the highest absolute values
corresponded to both flowering days, 50% flowering days and the 90% maturity
days, as well as number of locules per pod, 100 seeds weight (g), brilliance of
seeds, seed size and growth habit. For the second component the highest values
were for colour of standard petals and the wings, as well as the hypocotyl
colour, the cotyledon colour and the colour of the pods. The spatial distribution
of the common bean genotypes with the 90% maturity days, flowering days and low
100 seeds weight are in the I and II quadrant as reading clockwise in Figure 1.
The genotypes Belta 10, Nanka, and Mwolo-yellow are exemplified for such
dispersion. In quadrant III and IV
clockwise, there are genotypes that are characterized by great 100 seeds
weight, attaining early 90% maturity and early emergence and these genotypes include
Canadian wonder, Soya, Rukululana, Shona
Egunia and Malima/Ndondo.
|
S/N
|
Variables
|
Principal Component Axes
|
|
PC1
|
PC2
|
|
1
|
Emergency days
|
-0.117
|
0.151
|
|
2
|
Cotyledon color
|
-0.042
|
-0.335
|
|
3
|
Hypocotyl color
|
-0.065
|
-0.374
|
|
4
|
Flowering days
|
0.415
|
-0.014
|
|
5
|
50% Flowering days
|
0.415
|
-0.014
|
|
6
|
90% Maturity
|
0.415
|
-0.014
|
|
7
|
Color of wings
|
0.017
|
0.469
|
|
8
|
Color of standard
|
0.017
|
0.469
|
|
9
|
Color of pod
|
-0.079
|
-0.286
|
|
10
|
Pod length
|
0.098
|
0.195
|
|
11
|
Brilliance of the seed
|
-0.224
|
-0.004
|
|
12
|
Seed shape
|
0.213
|
-0.056
|
|
13
|
Seed coat color
|
0.027
|
-0.183
|
|
14
|
Seed coat patterns
|
-0.040
|
0.185
|
|
15
|
Locules per pod
|
0.278
|
0.154
|
|
16
|
Pod curvature
|
0.079
|
0.125
|
|
17
|
Growth habit
|
0.228
|
-0.065
|
|
18
|
Pods/plant
|
0.080
|
0.038
|
|
19
|
Seeds/pod
|
0.130
|
0.083
|
|
20
|
100 seed weight (g)
|
-0.321
|
0.143
|
|
21
|
Seed size
|
-0.297
|
0.145
|
|
|
|
|
|
|
Eigen-value/latent roots for each PC
|
4.241
|
3.261
|
|
Variation in Percentage (%) for each PC
|
20.194
|
15.529
|
Principal component axes 1 and 2 and traits
with Eigen-values set arbitrarily above 0.2 (highlighted), explained 35.78% of
total variation in the bean germplasm.
Cluster
analysis
Cluster analysis
based on morphological and agronomical traits grouped genotypes into 2 main
clusters (I and II) at 0.98 coefficient of similarity for 21 morphological and
agronomical traits. The traits are days to emergence, cotyledon color,
hypocotyl color, days to flowering, days to 50% flowering days to 90% maturity,
color of wings, color of standard, color of pod, pod length (cm), brilliance of
the seed, seed size, seed shape, seed coat color, seed coat patterns, number of
locules per pod, pod curvature, growth habit, number of pods per plant, number
of seeds per pod and 100 seeds weight (g). The main cluster I comprised three
(3) sub clusters namely sub-cluster A, B, and C makes a total of 82 common bean
genotypes as they can be identified by reading the dendrogram ascending from
the genotype named Uyolee 04 to Mkanamna. The main cluster II comprises
2 genotypes as they can be identified by reading the dendrogram descending from
the genotype named Biliomunyungu to Kablanketi. No sub cluster formed.
Table
7: Characteristics genotypes being
group together using Agglomeration method: Unweighted pair-group average (UPGA)
of Hierarchical Cluster analysis. Scored traits are described in the descriptor
by CIAT (1987).
|
CLUSTERS
|
ED
|
CCLR
|
HCLR
|
FLWD
|
50% FLWD
|
90% MD
|
CLRW
|
STDCLR
|
PCLR
|
PL
|
BR.SD
|
SDH
|
SDC.CLR
|
SDC.P
|
LOC/PD
|
PD.CUR
|
GH
|
PD/P
|
SD/PD
|
100WS
|
SDSZ
|
|
IA
|
5
|
3
|
2
|
23
|
28
|
65
|
1
|
1
|
7
|
8
|
2
|
4
|
5
|
2
|
3
|
2
|
4
|
5
|
2
|
36
|
2
|
|
|
IB
|
7
|
3
|
2
|
27
|
32
|
69
|
9
|
9
|
3
|
13
|
2
|
3
|
5
|
9
|
4
|
3
|
4
|
8
|
2
|
42
|
3
|
|
|
IC
|
5
|
3
|
2
|
27
|
32
|
69
|
1
|
1
|
7
|
8
|
2
|
5
|
5
|
2
|
3
|
2
|
5
|
5
|
3
|
26
|
2
|
|
|
II
|
5
|
3
|
2
|
24
|
29
|
66
|
4
|
4
|
7
|
7
|
2
|
1
|
16
|
4
|
3
|
1
|
2
|
6
|
2
|
60
|
3
|
|
Key
C.CLR-3-Green colour, H.CLR-2-Green, CLRW-1-White, 9-purple, 4-white with
carmine strips, STDCLR-1-white, 9-purple, 4-white with lilac edge,
P.CLR-3-Purple strips on green, 7-Green, BRSD-2-Medium, SDSHP-1-Round,
3-Cuboidal, 4-Kidney, 5-Truncate fastigiated, SDC.CLR-5-Brown yellow,
16-Purplish, SDCP-2-stripped, 4-Speckled, 9-Spotted bicolor,
PD.CURV-1-straight, 2-straight curved, 3-Curved, Gr.H-2-Indeterminate bush with
erect branches, 4-Indeterminate with semi-climbing main stem and branches,
5-Indeterminate with moderate climbing ability and pods distributed evenly up
to the plant, SDSZ-2-Medium, 3-Large.`

DISCUSSION
Genetic diversity of
any food crop is an essential component in germplasm evaluation and as a
pre-requisite in conservation prospects. Common bean has an important role in
dry land farming systems and provides high amount of crude protein used for
human consumption and animal feed. The rational use of genotype collections
requires a good knowledge about their characteristics. Well characterized and
documented ex-situ genotype collections can consequently provide useful
information to plant breeders. This aids researchers in identification of
potential parents with desirable genes for incorporation into local cultivars
for improved crop productivity. Morphological traits have long been the means
of studying taxonomy and variability among common bean genotypes.
Phenotypic
trait correlations.
Correlation matrix
helps to determine pairs of characters that vary in the same or opposite
direction and useful guide; especially for the plant breeders who may wish to
associate a set of their desired traits in their breeding programs. The
strongly correlated traits are possibly under the influence of the same genes
or pleiotropic effects (Miko, 2008). There were strong correlations between
some traits (Table 5), which allows for simultaneous selections and use of the
related traits interchangeably. Practically, during bean improvement, if two or
more strongly correlated traits are desired, they can both be selected
simultaneously basing on one of the influential traits. For example, the
positive correlations between seed size (r = 0.848, p<0.05) and 100 seed
weight, indicates that the seed size can be used to determine grain weight and
consequently yield. On the other hand, selection for relative 100 seed weight
would lead to late flowering (r = -0.332, p<0.05), low locules per pod (r =
-0.350, p<0.05) and number of seeds per pod (r = -0.228) since these traits
were negatively correlated. The near to unit correlations (r = 1.00) of wing
and standard petal colours suggests that these traits are controlled by one
gene (pleiotropy) or are very closely linked (Miko, 2008).
Principal
component analysis
PCA is the method of
data reduction to clarify the relationships between two or more traits and to
divide the total variance of original traits into a limited number of
uncorrelated new variables (Wiley, 1980). Based on morphology, the PCA results
(Table 6 and Figure 1) illustrated the overall picture of the pattern of
genetic diversity of the common bean genotypes. The Eigen value formed the basis for identifying component axes (PCA1
and PCA 2) (Panthee et al., 2006) with scores, cut off level arbitrarily set
above 0.2 to show traits, which explained most variations in the common bean
accessions. The first PC summarizes most of the variability present in the
collected data relative to the remaining PCs, hence recorded the highest Eigen
value 0.415 (Table 6) and accounted
for 20.194 % of the total variation. For instance, considering only PCA Eigen values in PC1 for both quadrants I
and II clockwise, most genotypes had late flowering days, 50% flowering days
and 90% maturity days. This axis indicates that most accessions were attributed
to the positive phenological traits complemented with the number of locules per
pod and the growth habit. This suggests that the traits above are the most
important for future common bean characterization and conservation studies. In
other studies, in common bean, Okii et al. (2014) characterized 284 landraces
from Uganda, using the IPBRI descriptor for P.
vulgaris and identified suitable traits for breeding purposes.
The cluster analysis
for the morphological traits included in this study placed common bean
genotypes into two main clusters with sub clusters for main cluster I (Figure
2). These results agreed with Blair et
al. (2010) who also reported that in cluster analysis cultivars are grouped
together with the greater morphological similarities. Clusters were also
grouped together for the improved and landraces signifying that they are less
variable in their morphological traits.
For instance, in the
main cluster I sub-cluster A, the improved variety of Zawadi, Mshindi, Pasi and
Jesca were placed together with the landraces of Kanyamunywa, Rukurulana
and Kashiransoni. This indicates that
they consisted of the heterogeneous group of accessions with same origin. The
diversity of the common bean genotypes observed in this study could be in part
due to farmers’ customary seed exchanges as it was reported by CIAT (2005)
since the exchange of seed materials is not unique to farmers. Further, Blair
et al (2010) reported farmers’
preference for many landraces
and diversified bean types are used for various agronomic and cultural reasons. In addition, varieties preferred for home cooking with unique seed
colours are selected for sale in the
local markets, hence,
increasing bean diversity across regions of Tanzania. Frequent mutations and genetic recombination
are the other possible causes of high
diversity of the common bean
genotypes studied.
CONCLUSION
Common
bean accessed displayed a considerable range of morphological diversity for
most of the agro-morphological traits studied. Phenological traits of days to
emergence, days to flowering, days to 50% flowering and days to 90% flowering
exhibited a strong positive correlation as those of qualitative traits like color
of standard petal and color of wings. Seed size strongly positive correlated
with 100 weight traits which determine the yield potential of a variety. A
significant variation accounted in the principal component analysis on the
collected common bean genotypes was contributed by phenological traits (days to
emergence, days to flowering, days to 50% flowering and days to 90% flowering)
for the PCA1 and qualitative traits (colour of standard petal and colour of
wings) for the PCA2. Further, both improved and landrace genotypes were
clustered in the same group hence clarifying that they’re heterogeneous but
with the same origin. Therefore, we recommend that morphological traits were
useful for the preliminary evaluation and can be used as a general approach of
assessing variability or variation among morphologically distinct common bean
genotypes; molecular analysis of the collected common bean genotypes is
recommended to be carried out in order to detect possible genetic relationships
of this material, as a further step.
REFERENCES
Beebe,
S., Sckroch, P. W., Tohme, J., Duque, M. C., Pedraza, F. and Nienhuis, J.
(2000). Structure of genetic diversity among common bean landraces of Middle
American origin based on correspondence analysis of RAPD. Crop Science
40: 264-273.
Beebe,
S. Rengifo J, Gaitan-Solis E. Duque, M.C. Tohme J. (2001). Diversity and origin
of Andean landraces of common bean. Crop Science 41: 854-862.
Blair,
M.W., Gonzalez, L.F., Kimani, P.M. and Butare, L. (2010). Genetic diversity,
inter-gene pool introgression and nutritional quality of common beans (Phaseolus vulgaris L.) from Central
Africa. Theoretical Applied Genetics121:237 - 248.
Bremner,
J.M. and Mulvaney, C.S. (Eds) (1982). Total nitrogen. In: Methods of Soil
Analysis. Part 2, Agronomy Monograph no. 9. (Edited by Page, L.A.,
Miller, R.H. and Keeney, D.R.). American Society of Agronomy, Madison,
Wisconsin, pp.595-624.
Carter,
M. (1993). Soil sampling and methods of analysis. (Editor). Lewis Publishers,
CRC Press, Inc., Boca Raton, FL. ISBN: 0-87371-861-5.
CIAT
(1987) Standard System for the Evaluation of Bean Germplasm. Key access and utilization descriptors for
bean genetic resources.Colombia.
CIAT
(2005). Utilization of bean genetic diversity in Africa. Highlights of CIAT in
Africa. Cali. Colombia. 21pp.
CIAT.
(1998). The impact of improved bean production technologies in Northern
Tanzania. http://www.ciat.cgiar.org/work/Africa/Documents/highlight42.pdf
Gee,
G.W. and Bauder, J.W. (1986). Particle-size analysis. In: Methods of Soil
Analysis, Part 1. Physical and Mineralogical Methods. Agronomy series No 9.
(Edited by Klute, A). American Society of Agronomy Madison Wisconsin, USA.
pp.383-409
Gepts, P. and Debouck, D. G. (1991). Origin,
domestication, and evolution of the common bean, Phaseolus vulgaris. Pages 7-53
in Voysest, O. and Van Schoonhoven, A. eds. Common beans: research for crop
improvement. CAB, Oxford, UK.
Kuo, S.
(1996). Phosphorus. In: Methods of Soil Analysis, Part 3. Chemical Methods.
Soil Science Society of America. Madison, Wiscousin. pp. 869 – 920.
Thomas,
G. W. (1996). Soil pH and Soil Acidity. In: Methods of Analysis, Part 3.
Chemical Methods. American Society of Agronomy, Madison, Wiscousin Pp. 475 –
490.
Landon,
J.R. (1991). Booker Tropical Soil Manual. A handbook of soil survey and agricultural
land evaluation in the tropics and sub-tropics. Longman Scientific and
Technical /Booker Tate Ltd., London.pp. 474.
Lindsay,
W.L. and Norvell, W.A. (1978). Development of DTPA soil test for zinc, iron, manganese
and copper. Soil Science Society of American Journal 42:421-428.
Miko,
I. (2008). Genetic dominance: genotype phenotype relationships. Nature
Education1:1 - 12.
Mohammadi,
S.A. and Prasanna, B.M. (2003). Analysis of Genetic diversity in Crop Plant-Silent
Statistical and Considerations. Crop
Science 43:1235-1248
Okii,
D. Tukamuhabwa, P. Odong, T. Namayanja,
A. Mukabaranga, J. Paparu, P. and Gepts, P. (2014). Morphological Diversity of Tropical
Common Bean Germplasm. African Crop Science Journal 22:59 – 67.
Panthe,
D.R., K.C, R.B., Regmi, H.N., Subedi, P.P., Bhattari, S. and Dhakal, J. (2006).
Diversity analysis of garlic (Allium sativum L.) germplasms available in Nepal
based on morphological characters. Genetic Resources and Crop Evolution
53:205-212.
United
States Department of Agriculture (USDA) (1975). Soil taxonomy. A Basic
System of Soil Classification for Making and Interpreting Soil Surveys. Soil
survey staff, soil Conservation Service, Washington DC, pp. 754.
|
Cite this Article: Yanda, FE; Tryphone,
GM (2022). Variability of Common Bean (Phaseolus
vulgaris L.) in Tanzania as Evidenced by Morphological Assessment. Greener Journal of Agricultural Sciences,
12(2): 168-184.
|