Ajijola, S; Saka,
JO; Omonona, BT (2022).
|
Greener Journal of Agricultural Sciences
ISSN: 2276-7770
Vol. 12(3), pp. 185-194, 2022
Copyright ©2022, the copyright of this article is retained by the
author(s)
https://gjournals.org/gjas
|

|
Determinants of
Transition in Economic Growth among Farming Households in Rural Nigeria
*1Ajijola S., 1Saka J. O.
and 2Omonona B. T.
1Institute of
Agricultural Research and Training, Moor Plantation, Ibadan, Nigeria
2Department of
Agricultural Economics, University of Ibadan, Nigeria
|
ARTICLE INFO
|
ABSTRACT
|
|
Article No.: 061522063
Type: Research
Full Text: PDF, HTML, PHP, EPUB
|
This study analysed the determinants of transition in economic growth
among rural households and matched it to the economic growth rate to
categorise households into being in Inclusive Growth (IG) and Non-Inclusive
Growth (NIG) groups in Nigeria. Secondary data from General Household
Surveys for 2010, 2013 and 2016 were used. Data were analysed using
descriptive statistics, Foster-Greer-Thorbecke
(FGT), Probit model and Markov chain. The result
shows that mean age of the rural households were 41.8, 43.7, and 46.9 years
for 2010, 2013 and 2016 respectively. Majority (65.0%, 65.4% and 65.5%) were
male while 64.3%, 63.1% and 63.4% were married in 2010, 2013 and 2016
respectively. Markov probability transition matrix revealed that rural
households (29.9%) remained in NIG in both periods 2010–2013 and 2013–2016
while 70.1% of rural households contributed to the economic growth in
2013–2016. However, rural households (46.6%) that are inclusive in period
2010–2013 worsened in the period 2013–2016. In the long run, rural
households (40.2%) were non-inclusive while 59.8% were inclusive. Probit results show that household size, education,
access to energy, residency in zones (South East and South South) influenced
rural households moving into NIG while age, access to health facilities,
being married, access to credit, involvement in agriculture and residency in
zones (North East and North Central)
influenced rural households to be in IG. It was concluded that with equitable
resources, rural households have the probability to be inclusive and
contributed into economic growth in Nigeria.
|
|
Accepted: 18/06/2022
Published:
12/07/2022
|
|
*Corresponding Author
Ajijola S.
E-mail: ajsik1967@yahoo.ca
Phone: +2348033906398
|
|
Keywords: Non–inclusive
growth, Economic growth, Rural households, Poverty, Transition, Nigeria.
|
|
|
|
INTRODUCTION
Growth
is non-inclusive when individual members of a society are not contributing and participating
in the growth process in an equitable basis irrespective of their individual
conditions. Growth inclusiveness
therefore laid emphasis on making opportunities and focusing on how the
opportunities would be available to all and also ensuring equitable access to
them. The significance of equal opportunities for individual lies in its
inherent worth which depends on the fundamental right of every individual that
equal opportunity should be circulated to all Adepoju
and Adejare, 2013). It is impossible to overemphasize
the importance of equitable access to services, creating employment and properties, as such access is critical in stimulating the
economy to long-term development (Omonona, 2009). The
promotion of inclusive growth needs a policy that is intentionally developed to
help the poor thereby allowing the engagement and contribution of members to
have equal advantage proportionally to the growth. Therefore, the group at the
bottom end, that is, the poor will be able to meet their basic requirements.
This will invariably reduce the incidence of poverty especially in the rural
settings (Akinlade et al., 2011). The concept of inclusiveness
of
growth can be used interchangeably with pro-poor growth
which ensures equitable access by all strata of individual in the society
(including the disadvantaged and marginalized) to opportunities created by
growth (Ali and Son, 2007).
Inclusive growth centres
consideration around the degree to which the marginalized, the youth, poor men
and women are engaged in and add value to economic growth; as assessed through
improvements in household living standards and the available resources they
require in enhancing higher incomes in the future (OECD, 2014). Mendoza and Mahurkar (2012) also opined that non-inclusive growth is a
growth process which advances non-equitable resources for economic agent such
as the marginalized, poor women, youth and unemployed.
Inclusive
growth with high sustainability in the economy can only be accomplished when
all the more vulnerable segments in the society including those that are
dedicated to agriculture, both small and medium scale firm, are encouraged and
equivalent with the other members of the society in order to have equitable
growth which is fundamental for a sustained inclusive growth (Omotola and Okoruwa, 2016).
Economies in Africa are growing rapidly and remarkably with an average of 5.6
percent in year 2012, while the growth in Gross Domestic Products (GDP) in
Africa was 6.7 percent and the GDP growth in Nigeria was 4.21 percent. It (Nigeria GDP) increas es to 6.22 percent in 2014 and dropped drastically to 2.8
percent in 2015 (NBS, 2017). The non-inclusiveness of growth was
influenced by living characteristics (such as availability of resources,
accessibility to various resources and geographical location) and socio
economic characteristics (for example, employment status, health facilities,
household size, educational attainment, human capability and ownership of
assets). Each of these parameters has a dimension that can be improved for
better living conditions in order to benefit from growth.
The
impressive growth in the economy has not been accompanied by increased
employment generation. Unemployment rate has assumed an upward trend, rising
from an average of 9.2% between 1991 and 2000 to 23.1% over the period of
2011-2014. The unemployment rate increased from 14.2% in 2016 to 18.8% in the
third quarter of 2017 (Aderounmu, 2018). Similarly,
people’s welfare had worsened over time in spite of the persistent economic
growth in term of access to employment, social amenities and the basic
necessity of life. The growth achieved
over the years has not translated into poverty reduction despite the fact that
the Nigeria economy recorded significant growth. This is because rural households in Nigeria faced a high level
of income inequality due to factors such as poor infrastructural facilities and
poor access to incentives coupled with their poverty that make them
particularly being marginalized (Adeleye et al., 2020; Aderounmu
et al, 2021). There is disparity between rural and urban households, (both rich and
poor) when considering their socio economic characteristics and living
characteristics (Amaechi, 2018). It
is therefore pertinent to provide an insight into the extent to which the
interventions of the implemented programmes have been
achieved This
study therefore, examined the long run or equilibrium transition probability
between inclusive and non-inclusive growth condition among rural households in
Nigeria and determine the factors influencing rural households’ transitions
between non-inclusive growth categories (Always non–inclusive, Exiting
non-inclusive, Entering non–inclusive and Never non–inclusive) in Nigeria.
MATERIALS AND METHODS
Data Requirement and Sources
The data used for
this study were sourced from General Household Survey (GHS) carried out
periodically throughout the country in periods 2010, 2013 and 2016. The General
Household Survey (GHS) survey is a panel survey of 5,000 households carried out
periodically throughout the country by National Bureau of statistics (NBS). The
first GHS survey conducted in 2010 is referred to as wave 1 while the second
survey in 2013 and third survey in 2016 are referred to as wave 2 and wave 3
respectively.
Analytical Techniques
The analytical
techniques used include descriptive
statistics, Foster-Greer-Thorbecke and Markov chain. The
descriptive statistics involves the use of percentages, tables, figures,
frequency distribution and standard deviation. The socio-economic characteristics of
the rural households between periods 2010 and 2013; 2013 and 2016 and; 2010 and
2016 was examined with the use of descriptive statistics such as frequency
distribution, percentages, ratios, mean and standard deviation.
Poverty Gap Index
The use of the
consumer price indexes for capturing the poverty lines was necessary in order
to remove the influence of poverty and for the comparison of individual
households for two periods (Omonona and Agoi, 2007). The poverty gap index was created using the
quantitative poverty measure developed by Foster, Greer and Thorbecke
(1984). This measure of poverty gaps was captured with the use of the Consumer
Price Indexes (CPI) and the poverty line of year 2009 (Table 1).
Markov Chain
Processes
Markov chain is a
stochastic interaction that fulfills the Markov property, which implies that
when the present is realized the past and future are free. That is, there is no
extra data of its past states that may be needed to make the most ideal
expectations of its future (Jerumeh and Omonona, 2018). Markov chains are mainly used to estimate
the probabilities of occasions happening by review them as states changing into
similar states as in the past or progress into another state.
The consumer price index (CPI) / Raising Factor
The consumer price index (CPI) of 95.78 in 2009 and the
poverty line N54,401.16 in 2009 (NBS, 2010) were used in order to scale
up the poverty lines produced by CBN (2010) in 2009 to 2010, 2013 and 2016
values. The consumer price index for years 2010, 2013 and 2016 were 108.92,
135.48 and 173.13 respectively. The raising factor was used to multiply the
poverty line N54,401.16 of 2009 to upscale the
poverty lines to N61,864.42 in 2010; N76,949.98 in 2013 and N98,334.44 in 2016 as shown in
Table 1. Therefore, to know that growth between two periods was non-inclusive,
if the difference in poverty gap between the two periods is positive, this
shows that, as expenditure increases, poverty level is also increasing
indicating that households in the growth process is poor and non-inclusive and
if the difference in poverty gap is negative, it shows that there is reduction
in poverty and therefore there is growth inclusiveness.
Table 1. CPI and Estimated
Poverty Lines for years 2010, 2013 and 2016
|
Year
|
CPI
|
Poverty line
|
Raising
factor
|
Estimated
Poverty line (N)
|
|
2009
|
95.78
|
N54,401.16
|
1.0000
|
54,401.16
|
|
2010
|
108.92
|
-
|
1.1372
|
61,864.42
|
|
2013
|
135.48
|
-
|
1.4145
|
76,949.98
|
|
2016
|
173.13
|
-
|
1.8076
|
98,334.44
|
Source: NBS, 2017
Markov Chain Probability Transition Matrix
The Markov chain
probability transition matrix was used to determine the rural households’ non
inclusive transition into non – inclusive, remain non-inclusive, exiting non –
inclusive and never non-inclusive; and determine the long run or equilibrium
probability transition of rural households between periods (2010 – 2013 and
2013 – 2016). The probability transition of the rural households was a 2 x 2
matrix (periods 2010 – 2013 and 2013 – 2016).
The 2 x 2 matrix (periods 2010 – 2013
and 2013 – 2016) in Table 2 shows the transition into four categories. That is,
transitioning from;
e1 in period 2010 –
2013 to e1 in period 2013 – 2016 (always non–inclusive, p11),
e1 in period 2010 –
2013 to e2 in period 2013 – 2016 (exiting non–inclusive, p12),
e2 in period 2010 –
2013 to e1 in period 2013 – 2016 (entering non–inclusive, p21)
e2 in period 2010 –
2013 to e2 in period 2013 – 2016 (never non–inclusive, p22).
Table 2. First-Order Markov
Model of Growth Probability Transitions of Rural Households
|
Period
|
Period 2013 - 2016
|
|
Period
2010 – 2013
|
|
Non-Inclusive (e1)
|
Inclusive (e2)
|
Total
|
|
Non–Inclusive
(e1)
|
p11
|
p12
|
r1
|
|
Inclusive
(e2)
|
p21
|
p22
|
r2
|
|
Total
|
p1
|
p2
|
|
The Table 2 was obtained
by using;
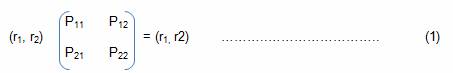
The above matrix
produced r1 and r2, which were the proportions of
households that would be non-inclusive and inclusive at equilibrium in the long
run respectively. The long run equilibrium is attained when the total numbers
of rural households entering a given category equals the numbers of rural
households exiting the category.
The
proportion of households that would be in each category in the periods is given
as;
P(r1, r2)
= P(o) Pijk ------------------------------------ (2)
Where;
k is the time periods
(2010 – 2013 and 2013 – 2016),
P(o) = the vector of initial probability,
Pij = the probability
transition matrix, the probability of households transitioning from i to j
(from one category of growth to the other),
i
= ith
household,
j
= jth
period ,
r1 = the probability
of rural households that would be in non-inclusive growth category at
equilibrium in the long run, and
r2 = the
probability of rural households that would be in inclusive growth category at
equilibrium in the long run.
RESULTS AND DISCUSSION
Socio-Economic Characteristics of Households in Rural
Nigeria
The
distribution of socio-economic characteristics of rural households in Nigeria
in year 2010, 2013 and 2016 is presented in Table 3. The mean value of 41.8 ±
9.4, 43.7 ± 9.46, and 46 .93 ± 9.39 years in years 2010, 2013 and 2016
respectively, which implies that a significant proportion of the respondents
were middle-aged and may be physically capable, indicating that they should be
healthy and agile to engage in economic activities. The mean household sizes were 8 ± 2.03, 7.3 ±
3.12 and 7.6 ± 1.6 in years 2010, 2013 and 2016 respectively. Most (64.3%) were
married while majority of the rural households (65.0%) were male across the
years. This indicates that more males were involved in various activities than
the females especially farming in rural Nigeria while the females might be
involved in small farming and engaged more in processing of agricultural
produce.
For
human capital assets, the result shows that 43.4%, 45.3% and 40.2% of rural households
had no formal education in years 2010, 2013 and 2016 respectively. The results
revealed that educational status in 2013 worsened as higher proportions of
rural households were recorded with no education. The number of rural
households that had no education was reduced in 2016 and there was appreciable
proportion (20.6%) of rural households in the year 2016 that attained
post-secondary education. Considering the importance of education as human
capital asset, inadequate access is a disincentive to abilities of population
to explore growth opportunities especially in rural communities. Majority of
the rural households were self-employed. The higher proportions that were
recorded in the self–employed among the rural households might not be unconnected
to the fact that majority (96.4%, 94.1% and 88.9% in 2010, 2013 and 2016
respectively) in the rural areas were involved in agricultural activities as
their major occupation. This corroborates Adeoti
(2014) that a large proportion of the rural sector is primarily an agrarian
society and larger number of people living in the rural areas
were mostly farming households.
Table 3. Socio-economic Characteristics
of Rural Households in Nigeria
|
Variable
|
2010-2011
|
2012-2013
|
2015-2016
|
|
Frequency
|
%
|
Frequency
|
%
|
Frequency
|
%
|
|
Age (yr.)
|
|
|
|
|
|
|
|
<40
|
592
|
17.7
|
1475
|
44.06
|
1267
|
37.84
|
|
41 – 60
|
2,582
|
77.15
|
1660
|
49.60
|
1801
|
53.82
|
|
>60
|
173
|
5.15
|
212
|
6.34
|
279
|
8.34
|
|
Mean
|
41.77
|
|
43.69
|
|
46.93
|
|
|
SD
|
9.38
|
|
9.46
|
|
9.39
|
|
|
Household
size
|
|
|
|
|
|
|
|
<5
|
43
|
1.28
|
43
|
1.30
|
0
|
0.00
|
|
6 – 10
|
3,026
|
90.42
|
2844
|
84.97
|
2726
|
81.45
|
|
>10
|
278
|
8.3
|
460
|
13.73
|
621
|
18.55
|
|
Mean
|
7.95
|
|
7.3
|
|
7.56
|
|
|
SD
|
2.03
|
|
3.12
|
|
1.76
|
|
|
Sex
|
|
|
|
|
|
|
|
Male
|
2176
|
65.01
|
2189
|
65.40
|
2192
|
65.49
|
|
Female
|
1171
|
34.99
|
1158
|
34.60
|
1155
|
34.51
|
|
Occupation
|
|
|
|
|
|
|
|
Agric.
|
3226
|
96.38
|
3148
|
94.05
|
2978
|
88.96
|
|
Non-Agric.
|
121
|
3.62
|
199
|
5.95
|
369
|
11.02
|
|
Marital
status
|
|
|
|
|
|
|
|
Single
|
1009
|
30.13
|
1046
|
31.25
|
714
|
21.34
|
|
Married
|
2151
|
64.25
|
2111
|
63.08
|
2123
|
63.42
|
|
Divorced
|
107
|
3.21
|
139
|
4.15
|
332
|
9.92
|
|
Widowed
|
80
|
2.4
|
41
|
1.23
|
178
|
5.32
|
|
Education
|
|
|
|
|
|
|
|
No education
|
1,451
|
43.35
|
1515
|
45.26
|
1344
|
40.15
|
|
Primary
|
509
|
15.21
|
632
|
18.88
|
673
|
20.12
|
|
Secondary
|
760
|
22.71
|
595
|
17.77
|
642
|
19.17
|
|
Post-secondary
|
627
|
18.72
|
606
|
18.09
|
688
|
20.56
|
|
Employment
|
|
|
|
|
|
|
|
Self employed
|
2,728
|
81.51
|
2756
|
82.36
|
2650
|
79.18
|
|
Paid employment
|
526
|
15.72
|
512
|
15.28
|
591
|
17.67
|
|
Unemployed
|
68
|
2.04
|
62
|
1.85
|
70
|
2.10
|
|
Retired
|
24
|
0.73
|
17
|
0.51
|
35
|
1.05
|
Transitions of Rural
Households from period 1 (2010 – 2013) to Period 2 (2013 – 2016)
The
results of the transition of the rural households were shown in Table 4. The
results of the transition probability matrix was estimated by converting the
probability transition matrix into probability values by dividing each item of
the corresponding rows by the corresponding total.
Table 4. Transition Matrix of Rural Households between Period
2010 / 2013 and Period 2013 / 2016
|

|
Status
|
2013/2016
|
|
Non-Inclusive growth (NIG)
|
Inclusive growth (IG)
|
Total
|
|
Non-Inclusive growth (NIG)
|
162
|
380
|
542
|
|
Inclusive
growth (IG)
|
1,308
|
`1,497
|
2,805
|
|
|
Total
|
1,470
|
1,877
|
3,347
|
Table
5 revealed that 29.9% of the rural household that were in non–inclusive group
in periods 2010 – 2013 were also in non–inclusive group in period 2013 – 2016
which of the rural household who were in the non–inclusive group in period
2010-2013 transited to inclusive group, that is, exiting non–inclusive growth
group in period 2013 – 2016. The result revealed that larger proportion of the
rural household exited non–inclusive growth group and transited into inclusive
growth group. Similarly, 46.6% of the rural households who were in the
inclusive growth group in the period 2010 –2013 transited to non–inclusive
group in the period 2013 – 2016, while 53.4% of the household who were in
inclusive group in the period 2010 – 2013 remained in the inclusive group (never
non-inclusive) in the period 2013 – 2016. This indicates that the transition
probability of rural households moving from one period to another that would
never be in the non-inclusive group was 53.4%. This showed that the proportion
of rural households that would always remain in inclusive growth group was
higher than those that would remain in non-inclusive growth group. The results indicate that there was an
improvement in the non–inclusiveness of growth from periods 2010 – 2013 to
periods 2013 – 2016 because higher percentage of rural households that were
worse-off in 2010 – 2013 transited into inclusive growth group in periods 2013
– 2016.
Table 5. Probability
Transition Matrix of Rural households
|

|
Status
|
2013/2016
|
|
Non-Inclusive growth (NIG)
|
Inclusive growth (IG)
|
|
Non-Inclusive growth (NIG)
|
0.299
|
0.701
|
|
Inclusive
growth (IG)
|
0.466
|
0.534
|
|
|
P(o)
Vector of Initial Probability
|
0.4392
|
0.5608
|
Rural
Households Equilibrium (Long Run Probabilities Transition) between Periods 2010
- 2013 and 2013 - 2016
The analyses of the Markov chain probability
transition matrix of rural households were estimated with a 2 x 2 matrix to
generate how the observed population in a given period is distributed in
different times. Following Ayantoye et al.
(2011), the Markov chain processes for long run probability of the 2 x 2 matrix
was calculated as;
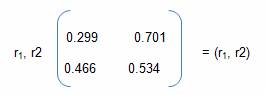
Solving the above matrix, the vector of
probabilities as the long run is obtained as;
(r1, r2) = (0.402, 0.598)
At equilibrium, that is, in the long run, the
probability of the rural household that would be in the non–inclusive group (r1)
is 40.2% while the probability that the rural household would transit to
inclusive growth group (r2) is 59.8%. The result indicates that higher proportion
of the rural households (59.8%) would be in inclusive growth group in the
future. It also shows that the long term projection of rural households that
would be moving out from non–inclusive growth group, that is, that would be
inclusive in long run is higher than the rural households that would be
transitioning into non–inclusive growth.
Similarly, in short run, the results in Table
5 were converted into probability values by dividing the probability matrix
values under each item in the different categories (always non inclusive,
exiting non–inclusive, entering non inclusive and never non–inclusive) by the
corresponding row total. The results also revealed the vector of initial
probability that, in short run, the probability of the rural households in
Nigeria that would be transited into non–inclusive growth group is 43.9% while
the probability that the rural households would transit into inclusive growth
group in short run is 56.1%. The results revealed that the probability that the
rural households would transit into inclusive growth group in long run is
higher than the probability of transition in short run. Therefore, there would
be a reduction in the proportion of rural households that would be in
non–inclusive growth in long run.
Factors
Influencing Rural Households’ Transition In and Out of Non-Inclusive Growth
between periods
The Probit regression model was used to determine factors influencing
rural households’ transition in and out of growth categories in Nigeria. The
model was adopted for its suitability in capturing non–inclusive growth
transition of rural households into four categories namely always
non–inclusive growth, exiting non-inclusive growth, entering non–inclusive
growth and never non–inclusive growth.
Yij = ß0 + ß1Xi
+ Ei…………………………… (3)
Where:
Yij = the dependent
variable for the different categories of non – inclusive transition
i
= ith
household (1…......... 3,347)
j
= jth
categories of non-inclusive transition (1………4)
The
four categories of non – inclusive growth transition are as stated below;
Y11
= 1 if always non–inclusive, 0 if otherwise,
Y12
= 1 if exiting non–inclusive, 0 if otherwise,
Y13
= 1 if entering non–inclusive, 0 if otherwise,
Y14
= 1 if never non–inclusive, 0 if otherwise,
ß0
=
constant term,
ßs = coefficients estimated,
Xs = Vector of
explanatory variables, and
Ei = Random error
The independent
variables, which are the socio–economic and demographic variables, are captured
as:
X1 = sex of household (1 if male, 0 if
female),
X2 = age of household (years),
X3 = household size (number of persons),
X4 = access to health facilities by household
(1 if yes, 0 otherwise),
X5 = educational attainment of household (years),
X6 = marital status of household (1 if married, 0
otherwise)
X7
= access to credit by
household (1 if yes, 0 otherwise),
X8 = access to electricity by household (1
if yes, 0 otherwise),
X9 = occupational status (agriculture) of
household (1 if yes, 0 otherwise),
X10 =
North east regional (1 if yes, 0 otherwise),
X11 = North
Central regional (1 if yes, 0 otherwise),
X12 =
North West regional (1 if yes, 0 otherwise),
X13 =
South East regional (1
if yes, 0 otherwise),
X14 =
South South regional (1 if yes, 0 otherwise),
X15 = South West region
(1 if yes, 0 otherwise), and
Ei
= Random error.
Factors Influencing Rural Households
Transition In and Out of Non–Inclusive Growth Group in Nigeria
Table
6 presents factors influencing rural households
transition in and out of the non–inclusive growth category in Nigeria between periods
2010 – 2013 and 2013 - 2016. The transition of the households in and out of non–inclusive
growth categories were made up of 4 categories; namely, always non–inclusive
growth category, exiting non-inclusive growth category, entering non–inclusive
growth category and never non–inclusive growth category.
The
results show that rural households have the probability to be in always
non–inclusive growth category with increase in household age and size. This
supported the findings of Adeoti (2014), that a rise
in household size was correlated with a higher likelihood of being
non-inclusive, which is linked to poverty due to increase in dependency
ratio. The probability of always
non–inclusive would also be reduced by -0.0178 with increased in access to health
facilities. The result revealed that healthy farmers would be able to work and
utilize available resources effectively thereby increasing in productivity. The
probability transition of the households to always remain in non–inclusive
growth decreases with marital status (14.4%). The result indicates that being
married will invariably decrease the probability of households that would
always remain non-inclusive. Also being engaged in agricultural activities, the
probability of households to remain non–inclusive would be decreased by
-0.0385. The regional dummies shows that increased in the residency of
households in Northeastern region will reduce the non–inclusiveness of growth
by 25.1%, while increasing in the residency in the North Central would reduce
the probability of non–inclusive by 36.6%. However, the North central region
had the highest tendency of probability of reducing the number of rural
population that would remain in non-inclusive growth.
The probability of rural households exiting
non–inclusive growth group increase by 0.0804, 0.0216, 0.1953, 0.0621 and
0.1673 with access to health facilities, educational attainment, marital
status, access to credit and engagement in agricultural activities respectively
while it reduces by 0.0025 with age. The results indicate that having access to
health facilities and educational attainment in the rural areas would increase
the probability of rural households exiting non-inclusive growth by 8.04% and
2.16% respectively, while marital status had the probability of increasing
members that exiting non-inclusive growth by 0.1953. Similarly, the results
show that gaining access to credit and being engaged in agricultural activities
have the probability of increasing the number of rural households exiting non–inclusive
growth category by 6.2% and 16.7% respectively. Also, the probability of rural
household exiting non-inclusive would increase by 0.1168 and 0.2227 with
increase in the number of residencies in the North East and North Central
regions respectively.
The probability of rural household entering
into non–inclusive growth category increase by 0.0223 (p<0.05) with
household size while the probability of rural households moving into
non–inclusive growth category decrease by -0.0132 (p<0.05) and -0.2164 (p<0.05)
with educational attainment and access to electricity respectively. This result
indicates that the probability of entering into non-inclusive growth category
is associated with large household size.
Access to electricity had a significant
influence on rural households and it is negatively related to the rural
households entering into non–inclusive growth category. Being educated would
decrease the projection of households into non-inclusive growth category by
-0.0132 at 5% level of significant. The results also show the significant
influence of residency in the geopolitical zones on rural household head per capita expenditure. It indicates
that, residing in the SE and SS have the probabilities of increasing the
households entering non–inclusive growth category by 0.3541 (p<0.05) and
0.3459 (p<0.05) respectively. These also show that being resident in these
areas hardly added value to the welfare of the people in terms of increasing
their income but increasing the per
capita expenditure of the rural households which is also associated with
poverty.
The probability of rural households to be
never non–inclusive decreased by -0.0358 (p<0.05) and -0.2170 (p <0.1)
with household size and marital status respectively while it increases by
0.0638 (p<0.01), 0.0625 (p<0.05) and 0.1802
(p<0.05) due to access to health facilities, access to credit and being
engaged in agriculture, respectively. Also being engaged in agriculture
(0.1802) would increase the probability of rural households to remain non-inclusive.
Rural household that never non-inclusive also
increased by 0.3336 (p<0.1) and 0.3287 (p<0.1) with a regional increase
in the number residencies among households in North Central and South East
respectively.
Determinants of Rural Households Transitioning In and Out
of Non–Inclusive Growth Group
|
Variable
|
Household Always NI
|
Household Exiting NI
|
Household Entering NI
|
Household Never NI
|
|
Constant
|
0.2544***
(0.0681)
|
-0.3063* (0.1693)
|
-1.2666*** (0.2226)
|
-1.9440***
(0.2982)
|
|
Sex
|
0.0913
(0.0789)
|
-0.1082
(0.0801)
|
-0.0779
(0.1013)
|
0.1968
(0.1382)
|
|
Age
|
0.0036*
(0.0014)
|
-0.0025**
(0.0015)
|
-0.00067
(0.0019)
|
-0.0033
(0 .0026)
|
|
Household
size
|
0.0219**
(0.0093)
|
0.0105
(0.0089)
|
0.0223***
(0.0038)
|
-0.0358**
(0 .0135)
|
|
Access
to health facilities
|
-0.0178**
0.0083
|
0.0804**
(0.0524)
|
-0.2393
(0.3632)
|
0.0638***
(0.0258)
|
|
Educational
attainment
|
-0.0013
(0.0044)
|
0.0216**
(0 .0075)
|
-0.0132**
(0.0057)
|
-0.0049
(0.0044)
|
|
Marital
status
|
-0.1438*
(0.0789)
|
0.1953*
(0.0806)
|
0.0403
(0.1025)
|
-0.2170*
(0.1332)
|
|
Access
to credit
|
0.0168
(0.0442)
|
0.0621***
(0.0145)
|
0.0517
(0 .0580)
|
0.0625 **
(0.0253)
|
|
Access
to electricity
|
0.0509
(0.1090)
|
0.0559
(0.1093)
|
-0.2164**
(0.1348)
|
0.0104
(0.1857)
|
|
Occupational
status (agric)
|
-0.0385**
(0.0193)
|
0.1673***
(0.0345)
|
-0.0165
(0.1552)
|
0.1802**
(0.0541)
|
|
Non-agric
|
-0.0399
(0.0701)
|
-0.0381
(0.071)
|
0.1218
(0.0881)
|
0.0424
(0.1169)
|
|
North
East
|
-0.2509**
(0.0938)
|
0.1168**
(0.0952)
|
0.2031
(0.1356)
|
0.2692
(0 .1831)
|
|
North
Central
|
-0.3661***
(0.0966)
|
0.2227*
(0.0976)
|
0.1823
(0.1392)
|
0.3336*
(0.1865)
|
|
North
West
|
-0.0856
(0.0929)
|
-0.0061
(0.0947)
|
0.1321
(0.1359)
|
0.2043
(0.1832)
|
|
South
East
|
-0 .2284*
(0.0952)
|
-0.0039
(0.0969)
|
0.3541**
(0 .1350)
|
0.3287*
(0.1838)
|
|
South
South
|
-0.1519
(0.0966)
|
-0.0738
(0.0987)
|
0.3459**
(0.1364)
|
0.3090
(0.1868)
|
|
Pro
> chi2
Log-likelihood
LR
ch2
Pseudo
R2
|
0.0003
2280.78
37.86
0.6205
|
0.0007
2221.88
33.23
0.5803
|
0.0069
1171.13
25.87
0.4814
|
0.0000
639.514
15.35
0.5224
|
The
coefficients ***, ** and * denote
significance at 1%, 5% and 10% respectively
SUMMARY AND CONCLUSION
The
socio economic characteristics of the rural households in Nigeria show that,
the average age of the rural households across the three waves was 42 which imply
that the rural households were still agile and can be very active in terms of
agricultural production. Majority (64%) of the rural households were married
while households that were never married recorded below average. The transition
probability matrix results show the projection of rural households in and out
of non–inclusive growth category over time. The result showed that larger
number (70%) of the rural households would move out of non-inclusive growth
category (exiting non inclusive growth) from year 2010 to year 2016. The
transition matrix also revealed that 53% of the rural households had the
probability of being inclusive (never non–inclusive) while the 30% and 47% of
the rural households had the probability of remaining in non-inclusive growth
(always non–inclusive) and transiting into non–inclusive growth category
(entering non–inclusive growth) respectively.
However,
the long run probability of the households show that larger percentage (59.8%)
would be moving into inclusive growth category while 40.2% would be
non–inclusive which indicates that the long term projection of rural households
that would be moving out from poverty, that is, that would be inclusive at long
run was higher than the rural households that would be transiting into non–inclusive
growth. The probability of the rural households that would move into
non-inclusive growth category in short run was 43.9%, while the probability of
the rural households moving out of non-inclusive growth category, that is,
inclusive was 56.1%. Therefore, the vector at short run shows that there was
also a reduction in the proportion of households that were non– inclusive at
short run to a long term projection.
The
study shows that there is still significant disparity in terms of access to facilities,
social amenities and the basic necessity of life. In Nigeria's rural
households, there is a lack of inclusion; unemployment and poverty remain high,
and the vast majority of the population is denied access to health care,
electricity, credit, and educational opportunities. The probability of the
rural households that would be inclusive in long run is higher than the rural
households that would not be participating in economic growth. Therefore,
Nigeria should incorporate distributive features and pursue growth that is
inclusive as this would support positive multiplier effects.
REFERENCES
Adeoti A. I. (2014): Trend and Determinants of
Multidimensional Poverty in Rural Nigeria. Journal of Development and Agricultural
Economics. 6
(5). 220 – 231.
Adeleye B.N., Gershon O., Ogundipe A., Owolabi, O., Ogunrinola, I., Adediran, O. (2020). Comparative investigation of the
growth-poverty-inequality trilemma in Sub-Saharan
Africa and Latin American and Caribbean Countries. Heliyon, 6(2020), https://doi.org/10.1016/j.heliyon.2020.e05631
Adepoju A. O. and Adejare K.A. (2013): Food Insecurity status of rural
households during the post planting season in Nigeria. Paper presented at the 4th
International conference of the African Association of Agricultural Economists.
September 22 – 25, Hammamet,
Tunisia.
Aderounmu, B.
D. (2018): Gender Analysis
of Poverty in Sub-Saharan African Countries. Presented at the
1st Covenant University International Women’s Multidisciplinary Conference, Covenant University, Ota, Nigeria,
Aderounmu B., D. Azuh,
O. Onanuga, Ogundipe O., B.
Ebenezer and A. Azuh (2021): Poverty drivers and Nigeria’s development: Implications for
policy intervention, Cogent Arts & Humanities, 8:1, DOI: 10.1080/23311983.2021.1927495.
Akinlade R.J., S.A. Yusuf, B.T. Omonona, and A.S. Oyekale (2011):
Poverty Alleviation Programme and Pro – poor Growth in
Rural Nigeria: Case of Fadama II Project. World Rural Observations.
3 (1). 27 - 33
Ali, I., and H. Son. (2007): Defining and Measuring
Inclusive Growth: Application to the Philippines. ERD Working
Paper 99, Economics and Research Department, Asian Development Bank, Manila.
Amaechi, L.
N. (2018). Food security and sustainable agricultural development
in Nigeria. The International Journal of Social Sciences
and Humanities Invention, 5((05):), 4765–4768.
Ayantoye K., S.A Yusuf, B.T. Omonona and J.O. Amao (2011):
Food security dynamics and its correlates among rural households in South western Nigeria. International Journal of Agricultural
Economics and Rural Development. 4 (1).
43 – 55
Jerumeh R. and Omonona B. T. (2018):
Determinants of Transition in farm size among Cassava – based Farmers in
Nigeria. Kaserat Journal of Social Sciences. 40 (1).
Pp 1 –
Lu, S.L. 2009. Comparing the reliability of a
discrete-time and a continuous-time Markov chain model in determining credit
risk, Applied Economics Letters, 16: 1143-1148.
Mendoza, R. U. and Mahurkar P. (2012): Snapshort of
Non-Inclusive Growth: Evidence from Philippine Employment Trends in 2001 –
2009. Modern Economy.
3. 832 – 836.
NBS (2017): Nigerian
Poverty Profile National Bureau of Statistics. 2017
OECD (2014): All on Board Making Inclusive Growth Happen.
OECD Secretariat, and Ford Foundation, the OECD Inclusive
Growth Initiative. Paris.
Omonona, B. T. (2009):
Quantitative Analysis of Rural Poverty in Nigeria. International Food Policy Research Institute (IFPRI). 1 – 9.
Omonona B.
T. and Agoi G. A. (2007): An Analysis of Food Security
Situation among Nigerian Urban Households: Evidence from Lagos State, Nigeria. Journal of Central European Agriculture. Vol. 8 No.3 Pp 397 - 406
Paramasivan S. Vellala,
Mani K. Madala and Utpal
Chhattopadhyay (2014): A Theoretical Model for
Inclusive Economic Growth in Indian Context, International Journal of Humanities and Social Science. (13). 229
|
Cite this Article: Ajijola,
S; Saka, JO; Omonona, BT
(2022). Determinants of Transition in Economic Growth among Farming
Households in Rural Nigeria. Greener
Journal of Agricultural Sciences, 12(3): 185-194.
|