Although commercial chicken genotypes have increased production and
quality to a certain extent, it is not possible to completely replace
domestic breeds. They need to be protected and brought into production,
especially in the regions where they are found as genetic resources. The aim
of this study is to determine the reactions of domestic chicken genotypes in
the provinces of Bingöl
(Bintav), Bitlis (Bittav), Elâzığ (Eltav), Muş (Muştav)
and Tunceli (Tunçtav) to environmental change and to determine the environmental
variables that affect the change the most. For this purpose, chickens
collected from these provinces were distributed to all provinces in a
balanced way, and their growth and development were monitored. All measurable
climatic variables in the growth and development periods were measured and
their effects on the development and maturity periods of the chickens were
tried to be determined. Animals were raised in small family businesses with
the arrangement made instead of large commercial enterprises. In the study,
forty chicks of each breed were given per household and the Ataks commercial
genotype was included in the control.
As a result, in the study in which the phenotypic
model was used, the average weight of males and females at the
growth stages was 15.48 g in males and 16.11 in females. In adulthood, it was
determined as 40.24 in males and 41.85 in females. It has been determined
that temperature and precipitation are the variables that mostly affect
growth and development. Although domestic genotypes showed a good improvement
in growth, development, and body weight, they lagged the commercial genotype.
However, it was observed that Tunçtav's yield
increased as the altitude increased, while Muştav
and Eltav were more positively affected by high
precipitation and high humidity, Bintav and Bittav genotypes were more resistant to drought and their
disease thresholds were higher than others in dry seasons. It was determined
that not all these traits were found in the commercial genotype.
In the changing and developing world, the rapid
population growth and the mobility in the population reveal the necessity of
making new and much more serious planning. While innovations should be made in
every field, it is seen that what needs to be done in the field of food is more
important than other fields. It is necessary to provide a balanced diet in
order to provide healthy food and improve nutritional conditions. In a balanced
diet, it is necessary to ensure the continuity of protein sources. In this,
ensuring the continuity in the production of both vegetable and animal protein
sources comes to the fore. It is seen that countries that use their resources
correctly and realistically have production plans and successfully manage their
own resources. The most important protein source is those of animal origin.
However, in recent years, an opposition to red meat has begun to emerge in
terms of health. Despite the propaganda that there are dangers in terms of
health due to unrealistic or overly exaggerated discourses regarding the demand
for safe and healthy food, the demand of the Turkish people for red meat
continued to increase even though it decreased partially (TÜİK, 2022). There
has been a 7.8% decrease in the production of meat, which is expressed as white
meat, especially chicken meat (TÜİK, 2020). This situation is thought to
have a high impact on the increase in input prices throughout the country.
Developed countries have reached a certain level in
the production and supply of animal products and can implement their production
programs. However, since developing countries do not fully establish their
livestock systems, they cannot make a certain planning and may experience production-related
problems (Simopoulos et al., 2012). While domestic breeds are generally at the
center of the animal production systems of developing countries, in recent
years, concentrations on hybrid and cultural breeds have begun (Gümüş and
Çınar, 2016). The fact that native breeds are genetically well adapted to
their environment and are more tolerant to changes makes them stand out in
their preference (Pym , 2010). Due to this advantage of local breeds, it can be
a good source of protein and nutrition especially for businesses and small
households that have to produce with low input (Anon, 2012).
Although domestic breeds are criticized for their low
productivity, they continue to be raised especially in small businesses (Keskin
and Demirbaş, 2012; Haque et al., 2020). Although the studies carried out
for the inclusion of high yield hybrid genotypes in the production area were
successful on the basis of large enterprises, their effect was limited as they
did not find a response in small enterprises (Gangadoo et al., 2016). Because
high-yielding genotypes could not adapt to changing environmental conditions,
they had to struggle with serious yield losses and diseases that resulted in
death (Bekele et al., 2010; Magdelaine et al., 2010). A way must be found to
improve and develop local meat and egg production. At the same time, this is a
necessary action to prevent possible problems that may be encountered in the
future ( Dessie et al., 2000; Sultan et al., 2016).
While intensive breeding systems are at the forefront
in poultry breeding around the world, semi-intensive and village systems
continue to exist even though they are decreasing. The basis for the observed
differences between these breeding systems is the difference in management
systems (ILRI, 2021). In general, commercially defined hybrid breeds are grown
in intensive or semi-intensive breeding, while small businesses raise native
breeds in the free system. It would be useful to identify potential areas of
suitability for genotypes other than native. Because the determinant of the
distribution within the country is not only the environment, but also the
knowledge of the producers and the attitude of the state on this issue (Lozano-Jaramillo et al., 2018).
Although productivity is important in poultry farming,
it is necessary to explain it with the help of mathematical models for the
continuity and standardization of production, and the most widely used models
in this field are phenotypic distribution models (Smith et al., 2017).
Phenotype distribution models are applied to determine the response of
phenotypic traits as a function of environmental conditions. Because the
environment can accelerate the emergence of some characters, while reducing
others and even preventing them from appearing (Topal & Yıldız,
2011). This is considered as a result of the interaction of the genotype and
the environment. If the phenotypic differences caused by the environmental
conditions change according to the gentypes and give different responses
according to the environment, there is an inverse relationship between the
environment and the genotype and this is called the Genotype*Environment
interaction ( Duzguneş et al., 1987). The effects of environmental factors
on genotype performances made it necessary to study adaptation in animal
husbandry. Due to the high response of commercial breeds to changes in
environmental conditions, yield loss can reach large rates. For this, it is
recommended to focus on local genotypes. Lozano-Jaramillo et al. 2019) in their
study to determine the performance of poultry with the help of the phenotypic
distribution model, stated that local genotypes performed much more
successfully under adverse conditions. Stayton (2019), on the other hand,
examined the performance of hard-shelled turtles with the help of the
phenotypic distribution model and stated that the model could successfully
explain the phenotypic distributions. Smith et al. (2017) examined species
changes in meadows under the pressure of climate change with the help of
phenotypic distribution models. As a result, they stated that the species
change started and the model was able to explain it successfully.
Our aim in this study is to predict the productivity
characteristics of different breeds locally grown in some provinces in the Euphrates
basin as a function of the environment in which they live. The Euphrates air is
one of the richest areas in Turkey in terms of diversity. Due to the large
number of small farms and their suitability for breeding, it is possible to
come across many different chickens. In this study, it was tried to determine
the performance of chickens with environmental parameters. In the study, five
different types were determined and their relations with environmental
parameters were examined with the help of the phenotypic distribution model.
The data obtained in the study may be beneficial for the enterprises working on
the subject in terms of increasing the success in breeding.
MATERIAL AND METHOD
In the study, domestic chicken genotypes found in the
provinces of Bingöl, Bitlis, Elâzığ, Muş and Tunceli, which were
selected from the Euphrates basin, which is located in the eastern region of
Turkey and has a very important agricultural production potential, were used.
The study was carried out between 2017-2019. The entire Euphrates basin was
intended to be evaluated within the scope of the study, but the emergence of
the Pandemic prevented work in larger areas. The data were obtained through
observations. The selected provinces have different agro - ecological structures.
This was enough to create sufficient diversity. All applications in the studies
were carried out in accordance with the conditions specified in the official
regulations. One genotype from each province, which can represent the province
and is in good condition in terms of desired characteristics, was defined. They
are named as Bintav , Bittav , Eltav , Muştav and Tunçtav in order to make
it easier to define them.
These selected genotypes were not selected from large
farms, but rather from family farms engaged in small-scale local production.
Attention has been paid to the fact that the chickens raised here are genotypes
that have been bred for a long time and it is accepted that they show a special
adaptation for this region. First of all, the eggs of these reared chickens
were taken. They were grown with Atax genotype in local breeding areas. In the
study, attention was paid to aquaculture with the lowest input made by local
businesses. The five selected breeds were put into breeding in a selected local
business in each of the five provinces where the study was conducted. The
offspring from the retrieved eggs were distributed to the producers and their
development was monitored. 40 chicks of each genotype were given per household.
In addition, Ataks commercial genotype was included for control. Thus, all
races were tested in the whole area where the study was carried out. Care was
taken to raise the young chickens under the same environmental and management
conditions as the local breeds owned by the enterprises.
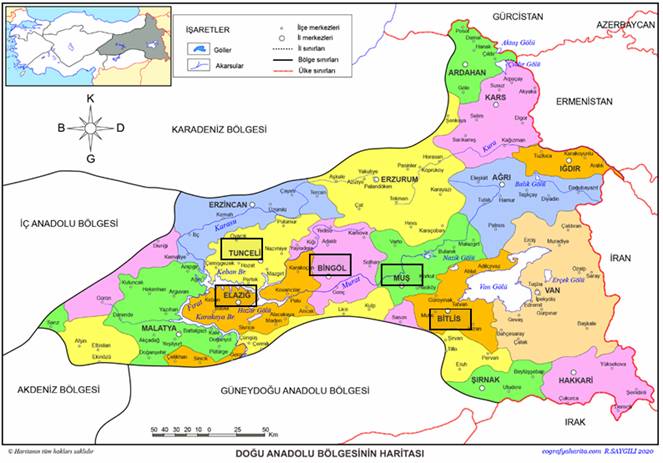
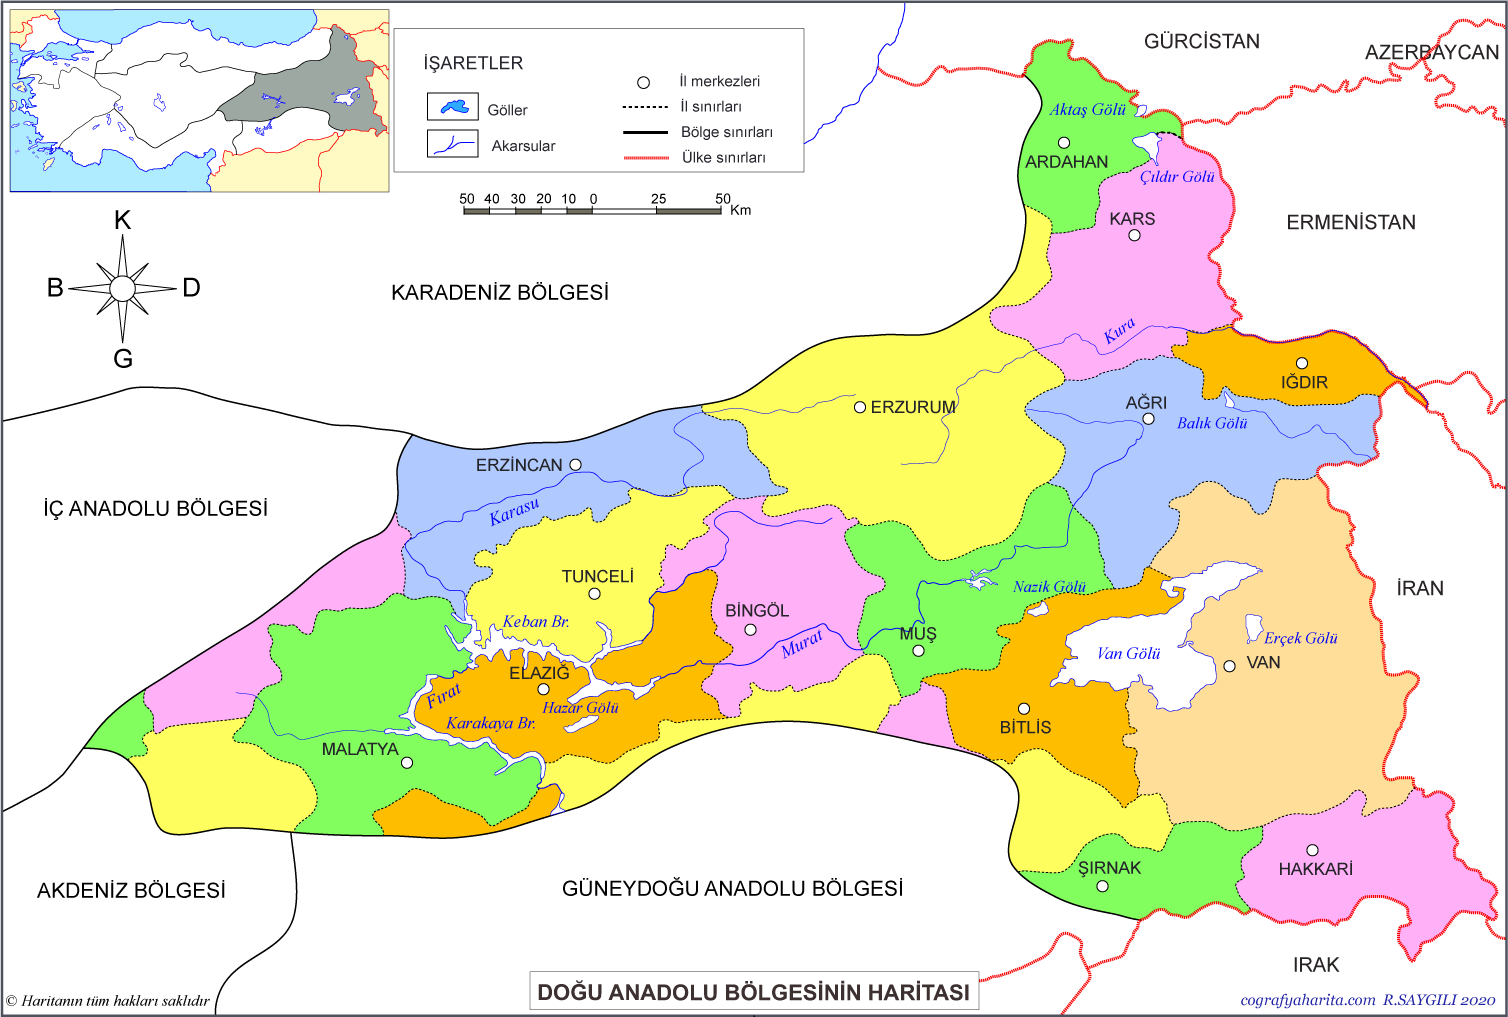
Figure 1. The provinces where
the study was conducted and the location of the region in Turkey
(cografyaharita.com)
All the genotypes collected were given to local
businesses and supported for their cultivation. Chicken fries were grown in a
controlled manner until 6 weeks of age and then delivered to the enterprises.
While male chickens are kept up to 24 weeks in the region, female chickens can
be kept up to 65 weeks. For males, 14-19 weeks are considered as the growth
period and 20-24 weeks are considered as the adulthood period and divided into
two parts. In females, it remained the same during this growth period, but the
adult period was evaluated as 20-65 weeks. But after that it is disposed of. In
the study, data continued to be collected during these periods. In the study
for men, body weight measurements were made and recorded on a regular basis,
primarily once every 15 days. Separate measurements were made for males and
females. Thus, gender differences will be seen. While the average weight of
males and females at the growth stages was 15.48 g in males, it was 16.11 g in
females. In adulthood, it was determined as 40.24 in males and 41.85 in
females. It is seen that the growth rates and amounts of females are slightly
higher than males, being statistically insignificant. The linear model given
below was used in the study;
Y = S + W + e
Here Y; Average chicken weights, S;Thenumber
at the time of measurement , W ; Measuring week
and e ; Contains random error. Care was taken to select those with the
same body weight during incubation for all chickens included in the study. The
Least Squares Mean (LMS) was calculated for chickens of all ages using the
Emmeans package in the R program for each age where the measurement was made .
The chickens used in the study were raised under the
same conditions as domestic chickens. Producers were not intervened in order to
create a special environment for feeding and irrigation, and the conditions
continued as always. The producers have continued to give their chickens the
same feed and water they have always given. Although they came from different
places, they were raised under the same conditions as domestic chickens. Some
environment variables were used during the study. These; annual average
temperatures of the provinces, average temperature ranges (highest temperature
– lowest temperature), standard deviation of seasonal variation of temperature,
highest temperature of the hottest month, lowest temperature of the warmest
month, highest temperature of the coldest month, lowest temperature of the
coldest month temperature, annual range of temperature, humidity status,
humidity status of the warmest month, humidity status of the coldest month,
annual precipitation, amount of highest precipitation, amount of lowest
precipitation, coefficient of variation of precipitation and altitude were
carefully recorded. These measured variables are the variables that can
directly affect the productivity of chickens.
The phenotype is an important feature on which the
genotype can manifest itself. There are many characters that affect the
formation of the phenotype and they are mostly in relation with each other.
Correlation and regression analyzes are used in the analysis of this type of
data. Thus, estimation equations are created and evaluations are made by
obtaining data with the help of models. However, sometimes these are not
enough. In this case, GAMs , which are expressed as generalized additive
models, come into play. GAM models can explain relationships in a more flexible
and explicable way. However, when a covariate needs to be added, the
probability of failure increases. In order to increase the success of
regression models, machine algorithms are being developed ( Maloney et al.,
2012). In order to explain the effects of the environmental variables examined
in the study on the phenotype, these variables were used as predictive
variables, while the live weight values for each growth period were taken as
the response variable. In this, the gradient increasing method, which is one of
the machine teaching methods, was applied. Gradient boosting involves an
iterative process created for predictive models that poorly fit the data.
Gradual adaptation can lead to improvement. Reinforcement algorithms were used
as tuning parameters and stop refresh was used to stop the algorithm at the
most appropriate point. The stopping point prevents data from cluttering up and
can increase accuracy. The study was carried out separately for each genotype.
The stopping process was made with the actions specified by Huber (2018). The
variable making the highest contribution was determined in the models. The
contribution of each variable to risk reduction was measured and the
significance of the variable was determined. The least squares mean was used to
determine the success of the predictions. The mboost program in the R program
was used for modeling phenotypic variation and variable selection (Hothorn et
al., 2017).
RESULTS AND DİSCUSSİON
The lowest, highest and average live weights observed
for chicken genotypes in the study area were determined. The results obtained
are given in Table 1. When the table is examined, the highest value observed in
terms of live weight was observed in Tunçtav with 702.5 g, followed by Eltav
with 693.4 g. Although Tunçtav is slightly heavier than Eltav, it has been
determined that the statistical difference is insignificant. The lowest value
was observed in Muştav with 586.7.
Considering the situation between observed and
expected values, the most successful prediction was observed in Mustav
genotypes. The coefficient of determination was quite high with 0.98. Tunçtav
genotype followed this with 0.97. As a result of the statistical comparison, it
was determined that the difference between the determination coefficients was
statistically significant. The determination coefficient of the Eltav genotype
had the lowest value with 0.92 and it was statistically significantly
separated. In general, the average determination coefficient over the whole
genotype was found to be 0.95. Since a high coefficient of determination also
means a decrease in the uncertainty coefficient, a high coefficient of
determination is considered important ( Draper and Smith, 1998). The decrease
in the uncertainty coefficient is a desirable feature as it will indicate the
high level of identification success.
Table 1. Descriptive
statistics for live weights of chicken genotypes
First Name
GCAO
( g )
BAO
( g )
R2 _
GEDCA (g)
GEYCA (g)
DG
Bintav
598.2b
602.6 cds
0.96 a
417.6
984.7
567.1
Bittaw
614.6b
627.9c
0.93 ab
408.3
1017.5
609.2
Eltav
693.4 a
671.4b
0.92b
421.2
1086.2
665.0
Mustache
586.7 c
581.2 d
0.98 a
435.4
1102.1
666.7
Tunctav
702.7 a
718.5 a
0.97 a
456.3
1181.8
725.5
Average
637.9
640.32
0.95
427.2
1074.4
646.7
GCAO; Observed Body Weight Average, BAO; Expected Weight Average, GEDCA;
Lowest Observed Body Weight, GEYCA; Maximum Observed Body Weight, DG; Change
Width
Tunçtav and Eltav have generally adapted better to all
environments and their productivity has not changed. Considering the observed
variation widths, it is seen that the variation width in chickens of Tunceli
region has the highest value. The lowest variation was observed in Bintav
genotypes. According to this, it can be said that chickens in Bingöl region
have higher tolerance to changing environmental conditions, whereas those in
Tunceli region have lower tolerance levels. Mashaly et al. (2004) stated that
environmental factors, especially temperature, have a serious effect on chicken
development and production. Zhu et al. (2015) stated that environmental
conditions should allow this in terms of growth and development of chickens and
product quality. However, Kumar et al. (2007) stated that if there is a genetic
similarity between chicken genotypes, the change would be much lower than those
without a relationship. The study shows that the high variation width in
Tunçtav is not stable in the face of changes in environmental conditions.
During the growth period,
the growth of female chickens especially, is more important. The lowest,
highest and average body weights observed for female chicken genotypes were
determined and given in Table 2. The highest live weight average observed for
female chickens was observed in Muştav with 565 g. Tunçtav followed this
with 559.4 g. It was determined that the observed difference was not
statistically significant. The lowest value was observed in Eltav with 512.7 g.
However, similarities were found between the value of Eltav and the values of
Bintav and Bittav . There was no statistically significant difference between
the average of the observed live weight and the average of the expected values.
The coefficients of determination ranged from 0.92 to 0.96. However, the
difference between the coefficients of determination was not significant. This
shows that the responses of the female chickens are similar. The determination
of the average determination coefficient as 0.94 indicates that the uncertainty
ratio is also very low, such as 0.06. Accordingly, it can be said that the
responses of females of these genotypes are more successfully described.
Table 2. The lowest, highest
and average body weights observed for female chicken genotypes during growth
periods
First Name
GCAO
( g )
BAO
( g )
R2 _
GEDCA (g)
GEYCA (g)
DG
Bintav
544.7 eu
551.9 a
0.93 a
655.8
956.8
301.0
Bittaw
538.1b
542.4 eu
0.95 a
718.2
1177.6
459.4
Eltav
512.7bc _
502.8b
0.95 a
805.5
1216.5
411.0
Mustache
565.0 a
556.1 a
0.96 a
1017.6
1356.7
339.1
Tunctav
559.4 a
545.7 a
0.92 a
1054.9
1417.0
352.1
Average
543.9
539.8
0.94
850.4
1224.9
372.1
GCAO; Observed Body Weight Average, BAO; Expected Weight Average, GEDCA;
Lowest Observed Body Weight, GEYCA; Maximum Observed Body Weight, DG; Change
Width
Unless there is a large and continuous
change in the environmental conditions of the animals in the growth and
development age, the rate of being affected by the environment remains limited.
Durmuş and Koluman
(2019) stated that depending on the change in environmental conditions, animals
firstly start hormonal changes and then other changes begin. Jolly et al
(1995), on the other hand, stated that nutritional conditions are the most
important factor triggering change and stated that improving nutritional
conditions can increase tolerance to the environment in animals. Karadavut et al. (2014) determined with mathematical models
that the changes seen during growth in birds show themselves more clearly in
females and that growth and development occur faster in females. In the study,
it was observed that the Bittav genotypes with the highest
variation width were more tolerant in terms of adaptation to environmental
conditions, while the Bintav genotype had low
tolerance but high stability. Bittav in terms of
females and in terms of adaptation to different environmental conditions, It
has been determined that the genotype is more suitable, but the Bintav genotype
is not very suitable. It may be useful to consider this feature, especially
when laying hens is planned.
The lowest, highest and average body weights observed in the families during the maturity
period of the animals were determined. The results obtained are shown in Table 3. The lowest value in terms of
live weight was obtained in the Bintav genotype with a value of 1258.1 g, while
the lowest value was observed in the Eltav genotype with a value of 1588.3 g.
The observed live weight average was determined as 1412.2 g. While the lowest
weight was observed in the Bintav genotype with 1618.3 g, the highest live weight
value was observed in the Eltav genotype with a value of 2496.9 g. The width of
variation can be a measure of the adaptability of genotypes ( Hinkelman, 1971).
The genotype with the highest variation width was Bittav genotype with 666.4 g.
This was followed by the Eltav genotype with 605.1 g. The lowest change width
value was observed in Tunçtav genotype with 396.8 g. The fact that the Tunçtav
genotype has a lower variation width than the others indicates the existence of
a familial rather than individual resistance to change. It is understood that
especially males' resistance to change is higher in Tunçtav genotypes. Maruyame
et al (2001) stated that males are more resistant to change in their study on
ducks. Hijmans et al. (2005), on the other hand, stated that it decreased
slightly in females, especially with climate change, but the resistance
continued in males. Dere and Tekeş (1996) studied growth and development
in broilers and tried to reveal the differences between males and females and
showed that females are physiologically more open to environmental changes.
Families were evaluated together during the maturity
period and the determination coefficients were found to be above 0.90 in
general. The lowest determination coefficient was obtained from the Bittav
genotype with 0.90, followed by the Eltav genotype with 0.92. The highest
determination coefficient was found in Bintav genotype with 0.96. When the
Bintav genotype is defined as a family, it is defined more successfully. The
uncertainty value is quite low. While the average determination coefficient was
determined as 0.93, the uncertainty coefficient was 0.07. It was observed that
the observed difference between the coefficients of determination was
statistically significant. Tunçtav and Bintav were statistically in the same
group. However, Bittav and Eltav were in a different group. Mustav, on the
other hand, was somewhere between the two genotypes. In other words, the
response of this genotype may resemble a subgroup depending on environmental changes,
or it may rise to the upper group under good environmental conditions.
Table 3. The lowest, highest
and average live weights observed for families in maturity periods
First Name
GCAO
( g )
BAO
( g )
R2 _
GEDCA (g)
GEYCA (g)
DG
Bintav
1258.1 d
1267.8 d
0.96 a
1618.3
2168.3
550.0
Bittaw
1376.4 c
1318.6 c
0.90b
1677.7
2344.1
666.4
Eltav
1588.3 a
1562.0 a
0.92b
1891,8
2496.9
605.1
Mustache
1411,9 bc
1455.7 b
0.93 ab
1855.3
2381.7
526.4
Tunctav
1451.2b
1438,2b
0.94 a
1890,6
2377.4
396.8
Average
1412.2
1408.5
0.93
1786.8
2353.7
566.9
GCAO; Observed Body Weight Average, BAO; Expected Weight Average, GEDCA;
Lowest Observed Body Weight, GEYCA; Maximum Observed Body Weight, DG; Change
Width
Different environmental conditions are
effective on the growth periods of chickens belonging to each genotype used in
the study. On this difference, the response of genotypes to environmental
factors is important. For each genotype,
environmental factors affecting the lowest and highest body weights measured
during the growth period of males were determined. The results obtained are
shown in Table 4. Each environmental factor has a positive or negative effect
on the growth and development of animals. However, some effects may be more
pronounced than others. The highest temperature in the hottest month was
effective on Bintav genotypes in Bingöl province . The change width was quite
high as 1070.2 g. It is noteworthy that although there are domestic chickens of
the province, they are the genotype most affected by high temperatures. In
Elazig, the Bintav genotypes came to the fore again and the average daytime
temperature made the biggest impact.
Considering the observed average values, the highest
value was obtained from Tunçtav genotypes in Bingöl province with 817.9 g. The
lowest value was observed in Bingöl province and Bittav genotypes with 673.2 g.
However, the difference between Tunçtav and Bityav genotypes grown in Bingöl
was not statistically significant. At the same time, the difference between the
mean values of Bintav genotypes grown in Bingöl and Elâzığ provinces
and Tunçtav genotypes grown in Muş province was found to be insignificant.
Considering the determination coefficient showing the success of the
estimation, the highest coefficient of determination with 0.96 was obtained
from the Bintav genotypes in the province of Bingöl, where the highest
temperature in the hottest month was affected, while the lowest value was
obtained from the Bittav genotypes in the province of Bingöl, which was
affected by the daily temperature in the environment . .
Table 4. Environmental
factors affecting the lowest and highest body weights observed and estimated
during the growth period of males for each genotype
ECF
EYCAGI
GA
GOD
TEOD
R2 _
GEDA
( g )
GEYA
( g )
DG
( g )
ESAEYS
Bingol
Bintav
673.2b
665.2
0.96 a
347.6
1417.8
1070.2
OGS
Elazig
Bintav
701.8b
678.4
0.91b
405.8
1343.7
937.9
ESAY
Mus
Tunctav
677.8b
712.8
0.91b
417.0
1309.9
1305.7
OGS
Bingol
Bittaw
788.3 a
725.5
0.90b
371.9
1484.1
112.2
VOTE
Bingol
Tunctav
817.9 a
799.6
0.94 a
443.7
1552.0
428.2
ESAEYS: Highest temperature
in the warmest month, OGS: Average daytime temperature, ESAY: Precipitation in
the coldest month, OY: Average precipitation, ECP: Effective Environmental
Factor, EYCAGİ: Province with the Highest Body Weight Observed, GA:
Genotype Name, GOD: Observed mean value, TEOD: Predicted mean value, GEDA:
Lowest Observed Weight, GEYA: Highest Observed Weight, DG: Change width,
Koç and Gökkuş (1993) stated that daytime
temperatures have a direct effect on the nutrient utilization of animals and
that very high temperatures can cause growth retardation. Sahin et al. (2013)
stated that daytime temperature can cause a serious heat stress and this will
reduce feed efficiency and productivity. Türkel (2020) stated that climate
change will negatively affect the growth and development of animals and stated
that necessary precautions should be taken. It is known that the growth and
development of animals will decrease with heat stress. However, since climate
change and global temperature increases are expected to have a negative effect
on poultry, it will be necessary to concentrate the studies on the genotypes
with the highest temperature tolerance. Thus, the genotypes that show the
highest tolerance to temperature can be determined and these can be given
priority in future studies.
Monitoring the growth of
females is particularly important. Environmental factors affecting the lowest
and highest body weights in the growth periods of the females of the gher
chicken genotype in the study were determined. The results obtained are given
in Table 5. The lowest values ranged from 297.6 g to 412.8 g, while the highest
values ranged from 1393.2 to 1604.3 g. In the study conducted in Bitlis
province, the main determinant was the annual total temperature and its effect
on Bintav was higher than the others. The lowest value obtained with the effect
of high temperature was 388.3 g, while the highest value was observed as 1556.8
g. It has been observed that the amount of precipitation in the most humid
month in Tunceli province is more effective and the most affected genotype is
Muştav. While the lowest value was 297.6 g in the Mustard genotype , the
highest value was 1393.2 g. It is seen that total precipitation is effective in
Elazig province. Eltav has been affected by the total precipitation here. The
lowest value of this genotype ranged from 412.4 g to 1407.1 g. However, in the
study conducted here on why the local genotype is affected by annual growth, it
has been seen that the precipitation is very uneven due to the deterioration of
the precipitation regime, and this causes undesirable developments. For this
reason, it is thought that it would be much more accurate to leave the concept
of annual precipitation in time and evaluate seasonal precipitation as a
priority.
In case of rapid and continuous temperature changes,
difficulties may arise in the adaptability of animals. The province with the
highest temperature changes was Bingöl and the genotype most affected by the
change here was Bittav genotype. The lowest value in the Bittav genotype ranged
from 379.5 g to 1604.3 g. The coldest day of the coldest month was effective on
the Eltav genotype in Muş province. The highest value of this genotype was
356.4, while the highest value was 1573.4. Considering the widths of variation,
it was observed that the temperature changes in Bittav genotypes in Bingöl were
ahead with a variation width of 1224.8 g.
In terms of average values observed, 836.1 g was
observed in Bittav genotype in Bingöl province where temperature change was
effective, while the lowest value was 669.0 g in Muştav genotypes in
Tunceli province, where precipitation in the most humid month was effective.
When the coefficient of determination is examined, it is seen that there is no
statistical difference between the coefficients. A high coefficient of
determination is important because it emphasizes the high level of predictive
success of the model. The uncertainty coefficient decreases and this shows that
the variables used in the study were chosen correctly ( Draper & Smith,
1998).
Table 5. Environmental factors
affecting the lowest and highest body weights observed during the growth period
of females for each genotype
ECF
EYCAGI
GA
GOD
TEOD
R2 _
GEDA
( g )
GEYA
( g )
DG
( g )
YTS
Bitlis
Bintav
715.9c
692.8
0.93 a
388.3
1556.8
1168.5
ENAY
Tunceli
Mustache
669.0c
722.8
0.93 a
297.6
1393.2
1095.6
TY
Elazig
Eltav
822.7 a
799.3
0.92 a
412.8
1407.1
994.3
SD
Bingol
Bittaw
836.1 a
810.4
0.94 a
379.5
1604.3
1224.8
ESAESG
Mus
Eltav
794.2b
812.2
0.94 a
356.4
1573,8
1217.4
YTS: Annual total temperature, ENAY: Precipitation in the wettest month, TY: Total
precipitation, SD: Temperature change, ESAESG; Coldest day of the coldest
month, ECP: Effective Environment Factor, EYCAGI: City with Highest Body Weight
Observed, CI: Genotype Name, GOD: Observed mean value, TEOD: Predicted mean
value, GEDA: Lowest Observed Weight, GEYA: Observed Maximum Weight, DG: Width of
change
In his study, Model (2017) stated that environmental
changes will be the sector that will be most affected by climate change in
global animal production, and especially the annual total temperature,
temperature changes for the year and total precipitation will be determinants.
Bayraç and Doğan (2016), on the other hand, emphasized that sudden changes
can occur with the total precipitation and temperature being effective, which
can greatly reduce productivity. Erlat and Türkeş (2012) stated in their
study that the change in the number of coldest days would affect other climatic
factors as well, and they also stated that this could increase as well as
decrease the effects of other climatic factors. Musharaf and Latshaw (1999) stated
that high temperature and rapid temperature changes may disrupt protein
metabolism in chickens, and for this, necessary treatments should be taken
against temperature increase and change in the rearing areas. Fidan (2012)
stated in his study on animal welfare that females are more sensitive in this
regard and give better results in positive conditions. Accordingly, it has
become important to determine the effects of environmental factors, especially
on females.
After
obtaining the data in the growth periods of the females, the data in the
maturity periods were obtained. Accordingly, the environmental factors affecting the lowest and
highest body weights determined in the maturity period of females for each
genotype are given in Table 6. According to the locations, the lowest
measurement values ranged from 356.6 g to 444.3 g, while the highest values
ranged from 1505.2 to 1616.4 g. In Tunceli province, precipitation in the
driest month was determined as the most effective environmental factor. The
change width was 1255.3 g. While precipitation in the hottest month was
effective in Elazig and Muş provinces, there were differences in the most
affected genotype. Bittav in Elazig and Bintav in Muş were the most
affected genotypes. In Muş province, the variation width of Bintav reached
the highest value with 1281.3 g. While the annual total precipitation has the
highest effect on Eltav in Bingöl, altitude has an effect on Bitlis.
Considering the average values observed, the highest value with 817.3 g was determined in the Eltav genotypes in Bitlis
province, where altitude is effective. The lowest value was 738.6 g in the Muştav genotype in Tunceli
province, where the rainfall in the driest month was effective. It was
determined that the observed differences between the observed mean values were
statistically significant. The values of Eltav and Bintav genotypes grown in Bitlis
and Muş provinces were found to be in the same
group statistically. The difference between the observed mean values of
chickens reared in Tunceli, Elazığ
and Bingöl provinces was found to be insignificant.
Considering the determination coefficients, the highest value was 0.96 in the Mustav genotypes in Tunceli
province, where the rainfall in the driest month was effective. The lowest
value was seen in Eltav genotypes in Bingöl province, where the annual total precipitation was
effective. The determination coefficients above 090 were considered as success
in terms of the study.
Table 6. Environmental
factors affecting the lowest and highest body weights estimated at maturity of
females for each genotype
ECF
EYCAGI
GA
GOD
TEOD
R2 _
GEDA
( g )
GEYA
( g )
DG
( g )
ICC
Tunceli
Mustache
738.6b
726.8
0.96 a
361.1
1616.4
1255.3
ESAY
Elazig
Bittaw
744.2b
711.3
0.91b
356.7
1505.2
1148.5
ESAY
Mus
Bintav
802.8a
837.9
0.93 ab
418.6
1699.9
1281.3
YTY
Bingol
Eltav
766.9b
791.0
0.90b
444.3
1543.6
1099.3
R
Bitlis
Eltav
817.3 a
796.6
0.94 a
391.1
1516.7
1125.6
ICC: Precipitation in the driest month ESAY:
Precipitation in the warmest month, Y TY: Annual total precipitation, R: Altitude, ECF: Effective Environmental
Factor, EYCAGI: Province with the Highest Body Weight, GA: Genotype Name, GOD:
Observed average value, TEOD: Predicted mean value, GEDA: Lowest Observed
Weight, GEYA: Highest Observed Weight, DG: Width of change,
CONCLUSION
Significant variations were observed
between observed and predicted weights according to genotypes. In addition to
the ecological conditions of this region, it may vary depending on the
knowledge and culture of the breeders. There are significant differences in the
performances of the early and females in the growth and maturity stages.
Determination coefficients were calculated to determine the success of the
predictions made. In addition, to evaluate the sensitivity, the
correlations between the estimated values with the help of phenotypic variation
models and the household averages of the breeding families, significant
differences were determined for all genotypes and growth stages.
The correlations also showed changes
according to the provinces and this was found to be significant. Correlation
values were determined as r=0.561** for household*region, r=0.109 for
household*genotype, and 0.499** for region*genotype interactions. Accordingly,
changes in households according to regions affect productivity, as well as the
effectiveness of genotypes according to regions, and genotype values vary
according to regions. However, positive but insignificant relationships were
found between household and genotype. Correlations ranged from 0.21 to 0.88.
The estimation of the most suitable region per genotype and the results of the
applied model gave similar results according to gender. However, it was
observed that females had slightly higher values. To determine the most
successful model, it is always necessary to know the effects of environmental
factors. As the effect of environmental factors increases, the success rate in
estimating model variables may change. Determining the individual impact
amounts of environmental variables directly affects success. In the study, the
distribution of male weights was seen as the variable most affected by
environmental factors. From here, it can be said that men are much more
sensitive to the environment, although it varies according to genotypes and
region. Temperature-related factors were decisive in the estimation of live
weights.
Phenotypic
distribution models using gradient reinforcement, one of the machine learning
methods, were used to increase the prediction ability of the GAM procedure and
accordingly to increase the chance of success. When the results obtained are
examined, it is possible to show how different genotypes respond to changing
environmental conditions. Breeding studies have reached a certain stage in the
poultry industry and successful results have been obtained. However, the necessity
of conducting studies for native genotypes has emerged. With this study, the
responses of local genotypes to changing environmental conditions were
determined.
Although the local genotypes showed a
good development in terms of growth, development and live weight, they remained
behind compared to the commercial genotype, whereas the Bintav
and Bittav genotypes were more resistant to drought
and the disease thresholds were higher than the others in the dry seasons.
Growth and development performance of our commercial genotype has been much
faster. Although the Tunçtav genotype increases its
durability as the height increases, it has been observed that Muştav and Eltav are more
positively affected by high precipitation and high humidity. It was determined
that Bintav and Bittav
genotypes were more resistant to drought and their disease thresholds were
higher than the others in dry seasons. It has been estimated that the low
performance of domestic genotypes compared to the commercial genotype depends
on the temperature and humidity in the environment. It was determined that each
degree increase in temperature had a negative effect on live weight. However,
the ambient temperature being up to 30 degrees did not make a serious change,
while each degree of 31 and above caused a 2-3 % decrease in live weight. In
addition, it was determined that the age factor was significantly effective in
the response of genotypes to the environment. It has been determined that
tolerance decreases with age, but if the temperature rises above 35 degrees,
they perform better than the commercial genotype.
REFERENCES
Anonymous (2012).Ovine livestock workshop report.Eastern Anatolia Development Agency, 8-9 June 2012, Hakkari.
Bayrac, HN, Dogan, E. (2016). The effects of climate change on the
agricultural sector in Turkey. Journal of OGUİİBF, 11(1): 23-48.
Bekele, F., Adnoy,
T., Gjoen, H., Kathle, J., Abebe, G. (2010). Production performance of dual-purpose crosses of two
indigenous with two exotic chickens breeds in sub-tropical environment.
International Journal of Poultry Science 9:702–710.
Dere, S., Tekeş, M. (1996).the
Use of Growth Physiology and Biotechnology to improve broiler production.
Eurasian Journal of Veterinary Sciences, 12 (2):5-12.
Dessie, T., Alemu,
Y., Peters, KJ (2000).indigenous chickens in Ethiopia: genetic potential and
attempts at improvement. world's Poultry Science
Journal. 56:45–54,
Draper , R., Smith, H. (1998). Applied Regression
Analysis. Willey publishing,
Durmus, M., Koluman, N., (2019). Hormonal changes caused on Ruminant
Animals exposed to High Environment Temperatur, J.
Anim. Prod., 60 (2):159-169.
Duzgunes, O., Elicine,
A. and Akman, N., (1987). Animal
Breeding. Ankara university. Faculty of
Agriculture Publications: 2003. Ankara
Erlat, E., Türkeş, M. (2012).Analysis of
observed variability and trends in numbers of frost days in Turkey for the
period 1950–2010. International Journal of Climatology, 32(12),
1889–1898.
Fidan, ED (2012). Welfare Practices Regarding Farm
Animals in Turkey.animal Health. Prod. andhyg. 1: 39 – 46
Gangadoo, S.,
Stanley, D., Hughes, RJ, Moore, RJ, Chapman, J. (2016). Nanoparticles in feed:
Progress and prospects in poultry research. trends
food sci techno _ 58:115–126.
Gümüş E., Çınar H., (2016). Comparison of Turkey, United States and European Union beef sectors
and evaluation in terms of foreign trade.Journal of
Harran University Faculty of Veterinary Medicine. 5 (2):177-183.
Haque, MH, Sarker, S., Islam, MS, Islam,
MA, Karim, MR, Kayesh , MEH, Shiddiky , MJA, Anwer, MS (2020). Sustainable Antibiotic-Free broiler meat
Production: Current Trends, Challenge, and Possibilities in a Developing
Country Perspective. Biology9, 411.
Hijmans, RJ, Cameron, SE, Parra, JL, Jones, PG, Jarvis, A.
(2005). very high-resolution interpolated climate
change surfaces for global land areas _ International Journal of Climatology
25:1965–1978.
Hinkelman, K. (1971). Estimation of Heritability from experiments with inbred and related
individuals.Bometrics. 27:183-190.
Hothorn, T., Buehlmann, P., Kneib, T., Schmid, T., Hofner, B. (2017).mboost: model - based boost _ http://CRAN.R-project. org / package = mboost. R package
version 2.8
Huber, V.
(2018).An optimized stopping rule for statistical boosting algorithms.
Ludwig- Maximilians - UniversitatMünchen ¨ Bachelor _ thesis _
ILRI, (2021). Managing the interfaces between livestock and nature
produces win-win-win results for nature, people and animals. livestock
pathways to 2030: One health Brief 6. Nairobi: International Livestock research
institute.
Jolly PD, McDougall S., Fitzpatrick, LA,
Macmillan, KL, Entwistle, KW (1995).Physiological
effect of under nutrition on postpartum anestrous in cows. Journal of
Reproduction and fertility _ Supplement 49:477–492.
Karadavut, U., Şahin,
A., Taşkın, A., Smart, A. (2014). In Japanese Quail (Coturnixcoturnix japonica) Investigation of the
Possibilities of Using Single and Multistage Analysis of Growth as Selection
Criteria. Turkish Journal of Agriculture and Natural Sciences, 1(4):539-546.
Keskin, B., Demirbaş, N. (2012).
Emerging developments in poultry meat sector in Turkey: problems and
suggestions. Journal of Uludag University Faculty of
Agriculture, 26(1), 117-130.
Koç, A., Gökkuş,
A. (1993). Plant-Animal Relations in Pasture Management.Atatürk University Faculty of Agriculture. 24 (1),
185-201.
Lozano-Jaramillo,
M., Alemu, SW, Dessie , T., H. Komen , JWM Bastiaansen
, (2019). using phenotypic distribution models to
predict livestock performance. sci
Rep9 ,1-11.
Lozano-Jaramillo, M., Bastiaansen, J., Dessie, T.,
Komen, H. (2018).Use of geographic information system tools to predict animal breed
suitability for different agro-ecological zones.animal,
1–8.
Magdelaine, P., Riffard,
C., Berlier, C. (2010). Comparative survey of the
organic poultry production in the european union _ Of
Proceedings of the XIIItheuropean
Poultry Conference, Tours, France, 23–27 August 2010; p. 9.
Maloney, KO, Schmid, M., Weller, DE (2012). applying
additive modeling and gradient boosting to assess the effects of watershed and
reach characteristics on riverine assemblages. Methods in
Ecology and Evolution 3:116 – 128.
Maloney, KO, Schmid, M.,
Weller, DE (2012). applying additive modeling and
gradient boosting to assess the effects of watershed and reach characteristics
on riverine assemblages. Methods in Ecology and Evolution3:16–128.
Maruyama, K.,
Vinvard, B., Akbar, MK, Shafer, DJ, Turk, CM, (2001).
Growth Curve Analysis in Selected duck lines _ brit _ poult _ Sci., 42:574-582.
Mashaly, MM, Hendricks, GL,
Kalama, MA, Gehad, AE, Abass,
AO, Patterson, PH (2004). Effects of heat stress on production parameters and immune
response of commercial laying hen _ Poultry Science 83: 889–894.
Model, EA
(2017).The global livestock environmental assessment model.food and Agriculture Organization of the United Nations (FAO);
p. 22-6.
Musharaf, NA, JD Latshaw,
(1999). heat increment as affected by protein and
amino acid nutrition _ World Poultry Science Journal, 55(3):233-240.
Pym, R. (2010). Of food and
Agriculture Organization of the United Nations(Poultry Development
Review, 2010).
Kumar, BST, N., Dilbaghi, SPS Ahlawat ,Bina Mishra , MS Tantia, RK
Vijh, (2007). genetics
relationship among chicken Populations of India Based on SNP Markers of Myostatin Gene (GDF 8). International Journal of Poultry
Science, 6: 684-688.
Simopoulos, AP, Faergeman,
O., Bourne, PG, (2011). Action plan for a healthy
agriculture nutrition, healthy people. Journal of Nutrigenetics
and Nutrigenomics 4(2): 65–68.
Smith, AB, Alsdurf,
J., Knapp, M., Baer, SG, Johnson, LC (2017).phenotypic distribution
models corroborate species distribution models: A shift in the role and
prevalence of a dominant prairie grass in response to climate change change. Global Change Biology 23:4365–4375.
Stayton, CT (2019).
Performance in three shell functions predicts the phenotypic distribution of
hard- shelled turtles _ Evolution 73-4: 720–734.
Sultan, S.,
Begum, R., Rahman, MA, Ahmed, MJU. Islam, MM, Haque, S. (2016). Economics analysis of _
use and vaccine program in commercial broiler farming of Tangail
district in Bangladesh.prog.
Agri. 27:490–501.
Şahin, K., Orhan, C., Tuzcu, M., Borawska, MH, Jablonski, J., Guler, O., Şahin, N., Hayrlı, A. (2013).Berberis
vulgaris root extract alleviates the adverse effects of heat stress via
modulating hepatic nuclear transcription factors in quails. British
Journal of Nutrition 110: 609– 616.
Zhu, YW, Xie, JJ, Li, WX, Lu, L., Zhang, LY, Ji,
C., Lin, X., Liu, HC, Odle, J., Luo,
XG (2015). Effects of environmental temperature and dietary
manganese on egg production performance, egg quality, andsomeplasmabiochemicaltraits of broiler breeders. J Anim Sci. 2015 Jul;93(7):3431-40.
Cite this Article: Bahadir,
B; Karadavut, U; Karadavut,
V; Inci, H (2023). Investigation of Adaptation Performances
of Domestic Chickens with Phenotypic Distribution Model to New Ecology
Created by Climate Change. Greener
Journal of Agricultural Sciences, 13(2): 80-90. https://doi.org/10.5281/zenodo.7993873.