This
study evaluated the effect of acute toxicity of three commercial inorganic
fertilizer NPK 15:15:15, NPK-1; NK 20:20:20, NPK-2; urea and Single super
phosphate on Clariasgariepinusjuveniles
in static condition. The concentration of NPK-1, NPK-2, urea and single
superphosphate that killed 50% of the African Catfish with 96-h LC50
were 6.25g/l, 7.25g,/l, 16.25 and 12.50g/l, respectively.
For water quality parameters, there was no significant difference (p<0.05)
in the mean of (temperature, Ph and alkalinity,
while there was significant difference (p<0.05) in Dissolve oxygen.
However, urea treatment parameters were found to have highest numerical value
among the treatments in the water treatment parameters. Furthermore, there
was significant difference (p<0.05) in the water treatment parameters.
Furthermore, there was significant difference (p<0.05) in the haemoglobin
percentage among the treatments while no significant difference (p<0.05)
was observed in the total count of red blood cell. Planktons were more
abundant in urea treatment but more diverse in Single Superphosphate
treatment. All the treatments caused damage on the tissues among which are;
nuclear pycnosis in the liver tissue and
hyperplasia of mucous cell of skin and gill tissue. However, the most damages
were observed on the urea treatments. The study concluded that urea is more
toxic to the fish than other inorganic fertilizers.
We first of all appreciate God the
Almighty for sustaining our lives during the research and the Federal College
of Education Pankshin for giving us the opportunity
to undertake this research work sponsored by TETFUND.
INTRODUCTION
One of the major environmental issues of our time was the growing
concern about water quality suitable for use by humans and animals Calamari and
Naeve, (2004). The daily activities of man in one way
or the other affect the aquatic environment negatively. These activities, which
include the discharge of pollutants into streams and river systems, such as
agricultural fertilizers of different types, pesticides, insecticides and
industrial effluents, pollute the water bodies and alter ecological balance,
EU, (1998).These pollutants influence the quality of these water bodies which
is of high importance in the aquatic ecosystem balance and consequently affect
the survival of aquatic organisms inhabiting such environments, Odiete, (1999). It was a known fact that water quality
conditions are constantly being threatened by pollution. The rivers and coastal
water bodies are presently exposed to increasing quantities and concentrations
of both natural as well as anthropogenically derived
contaminants Ezeka, (2004). Environmental concern
about intensive agricultural practices and excessive or inappropriate use of
chemical fertilizers calls for some global action among environmentally
conscious individuals and other stakeholders, Nychas,
(1990).
A fertilizer is any
material, organic or inorganic, natural or synthetic, that supplies plants with
the necessary nutrients for growth and optimum yield (Addiscott,
Whitmore and Powlson, 2001) or a substance
added to water to increase the production of natural fish food organisms; (Nwadukwe, 1995). Inorganic (or chemical) fertilizers are
fertilizers mined from mineral deposits with little processing for example,
lime, potash, or phosphate rock, or industrially manufactured through chemical
processes, for example NPK and Urea (Amadi, 2001).
Inorganic fertilizers vary in appearance depending on the process of
manufacture. The particles can be of many different sizes and shapes (crystals,
pellets, granules or dust) and the fertilizer grades can include straight
fertilizers (containing one nutrient element only), compound fertilizers
(containing two or more nutrients usually combined in a homogeneous mixture by
chemical interaction) and fertilizer blends (formed by physically blending
mineral fertilizers to obtain desired nutrient rates; (Alexander, (2006). For
the sake of this study, NPK, Urea and Single superphosphate will be used. The
importance of chemical fertilizers in agricultural production is highly
indispensable and is widely acceptable by an ever increasing number of farmers,
not only because fertilizers help condition the fragmented and
nutrient-depleted soil for further production and boast soil resistance to
erosion, but also that it encourages vegetal cover (Almazan
and Boyd, 1978).
LITERATURE REVIEW
Inorganic nitrogen (NH–4, NO–2
and NO–3) may be present naturally in aquatic ecosystems
as a result of atmospheric deposition, surface and groundwater runoff,
dissolution of nitrogen–rich geological deposits, and biological degradation of
organic matter, Wetzel, (2001) and Rabalais, (2002).
However, activities of human species have substantially altered global
nitrogen cycle, increasing both availability and mobility of nitrogen over
large regions of the Earth; (Vitousek, Aber, Howarth, Likens, Matson, and Schindler, (2007) and
Galloway and Cowling, (2002). Inorganic nitrogen (NH–4,
NO–2, and NO–3) enters aquatic
ecosystems via anthropogenic sources such as animal farming, urban and
agricultural runoff, industrial wastes, and sewage effluents; (Wetzel, (2001)
and Rabalais, (2002). Also, the
atmospheric deposition of inorganic nitrogen (mainly in the form of NO–3)
has dramatically increased because of the extensive use of nitrogen fertilizers
and huge combustion of fossil fuels, Moomaw, (2002)
and Boumans, Fraters and Van Drecht,
(2004). As a result, concentrations of nitrate in ground and surface
waters are increasing around the world, causing one of most prevalent
environmental problems responsible for water quality degradation on a worldwide
scale, Wetzel, (2001); Rabalais, (2002) and Smith,
(2003).
The use of fertilizer in aquaculture is important for pond fertilization
as it increases fish production as a result of nutrient availability for
primary production. In aquaculture, fertilizers have been used in various forms
and quantities to enhance fish production for greater abundance of fish food
organisms, but excessive uses of fertilizer may have adverse effect on water
quality and can also cause gill damage, Haygart hand
Jarvis, (2002).
Fish and other aquatic animals are subject to
a broad variety of stressors because their homeostatic mechanisms are highly
dependent on prevailing conditions in their immediate surroundings. The
biochemical and histological changes occurring in the body could serve as
potent indicators of stress Jhingran, (2002).The Genus Clariasis widespread in Africa and South East Asia and its utilization for fish
culture has significantly increased during the last few years Bard, et al.,
(2006)and it was widely cultivated in Nigeria Omotoyin,
(2007).
NPK, Urea and SSP which are
inorganic sources of fertilizer, are most widely used in agriculture as an
economical, balanced and effective fertilizer. Their efficacy in promoting
growth of plants and increasing production is incontestable. However, in
animals it is responsible for the manifestation of multiple disorders ranging
from inhibition of growth to mortality. Their use as fertilizer has been shown
to diminish fish production and induce mortality in aquaculture Jhingran, (2002). Applying different fertilizers in fish
ponds indicated a negative correlation between fish production and levels of
organic nitrogen, Meehean and Marzulli,
(2005).
The study was undertaken to
monitor the response of fishes to exogenous NPK, Urea and SSP fertilizers. Multiple
parameters will be examined including behavioural changes, bio chemical
changes, osmoregulation and histological changes which will help in providing
the insight to the generated response.
Sustainable Development
Goal 2 (SDG2 or Global Goal 2) aims to achieve “zero hunger”. It is one of the
17 Sustainable Development Goals established by the United Nations in 2015. The
official wording is “End hunger, achieve food security and improved nutrition,
and promote sustainable agriculture”. Sustainable Development Goal 2 is about
creating a world free of hunger by 2030. Source: This sustainable Development
Goals Report 2022.
Sustainable Development
Goal 14 is about “life below water” and is one of the 17 sustainable
Development Goals established by the United Nations in 2015. The official
wording is to “Conserve and sustainably use the oceans, seas and marine
resources for sustainable development”. Healthy oceans and seas are essential
to human existence and life on earth.
The oceans are home to
seahorse, dolphins, whales, corals, and many other living creatures. Oceans are
our planets life support as they provide water, food and help regulate the
weather. Oceans also provide jobs for more than 3 billions
people who depend on marine biodiversity for their livelihood.
STATEMENT OF
THE PROBLEM
Despite the very useful nature of
fishes as a major food nutrient in Nigeria, there has been a growing concern on
the environmental impact of water quantity and quality of fishes available to the
nation. It has been argued that pollutant discharge such as pesticides,
insecticides and other industrial effluents pollute water bodies and thus
affecting the quality of healthy aquatic animals available for human
consumption. One worrisome situation is the increase in carcinogenic infections
in Nigeria. Could this be due to excess chemical in fishes? There has also been
decline in quantity of fishes in the aquatic environments in Nigeria, what
could be responsible for this? There was an urgent need to investigate
toxicities of inorganic fertilizers on clariasgariepinus juveniles in Nigeria.
AIM AND
OBJECTIVES OF THE STUDY
The present study aims to determine
the toxicities of inorganic fertilizers on clariasgariepinus juveniles using a static test
system.
The specific
objectives are to;
i.Determine
the growth rate of clariasgariepinus
juveniles exposed to different inorganic fertilizers (NPK, Urea and SSP);
ii.Investigate
the effect of different fertilizers on haematological parameters;
iii.Examine
the impact of using different inorganic fertilizers on the plankton abundance
and
iv.Investigate
the histo-pathological effect of different inorganic
fertilizers to clariasgariepinus
juvenile
THE SCOPE OF
THE STUDY
This study was limited to the use of
inorganic fertilizers which are; NPK 15:15:15, NPK 20:10:10, Urea and Single
Superphosphate which are the common fertilizers that fish farmers normally use
to fertilize their ponds to stimulate the growth of planktons. This study was
conducted at the teaching and research farm of the Federal College of
Education, Pankshin from September 2022 to September,
2023.
THE
JUSTIFICATION OF THE STUDY/ SIGNIFICANCE
This study will be beneficial to the
following set of people; fish farmers, environmental scientist, government
agencies, and other researchers.
Fish farmers: This study will benefit
fish farmers especially those that are rearing African Cat fish, they will be
able to decide the type of inorganic fertilizer that is suitable for the
survivability of the fishes. They will also be able to know the fertilizer that
can support the growth of the clariasgariepinus. Environmental scientist will also find this
study informative, this study will x-ray acute toxicity effect of the most
common types of fertilizers available to farmers and its impact on the quality
of water, water that is not safe for fish, might not be considered suitable for
human. More so, this study will also be of benefit to government agencies that
are responsible for the regulation of the use of agricultural chemicals. This
study will expose the effect of over-using chemicals and how un-safe the
residues are.
RESEARCH
METHODOLOGY
3.1 Study
Area
The study was undertaken in the fish pond
of the Department of Agriculture, Federal College of Education Pankshin. The geographical area covered by the study is Pankshin Local Government Area. Pankshin
Local Government is one of the oldest local government area
in Plateau State. It is about 120 kilometers from Jos
and is situated on the West to Mangu Local Government
Area to the East, Mikang and Qua’an
Pan Local Government Area to the South. Pankshin
Local Government Area covers an area of 1.434 square kilometer
and has a population of about 168,718 based on the census that was conducted in
2004. The main ethnic and language groups in the Local Government Area are the Ngas, Mupun, Dyis,
Kadung, Jing, Chip and Lankan among others. The area
is blessed with socio-economic infrastructure and has agrarian economy (Centered upon the production, consumption, trade and sales
of agricultural commodities, including plants and livestock) as the mainstay of
the people who are also industrious.
3.2
Materials
-Jen
way portable Ph meter model 350
-Aqueous
bovines solution
-Improved
Neubaverheomocytometer
slide
-Leishman’s stain
-Haemoglobunometer
-Jen
way portable dissolved Oxygen meter model 970
-Hcl acid
-Saline
solution
-Methyl
indication
-Nacl Solution
-Sensitive
scale
-Thermometer
-Stopper
bottle
-Pipette
-Conical
flask
3.3 Management of the Experimental
Fish
The juvenile African Catfish were
purchased from the local hatchery in Makurdi, Benue
state. The juvenile African cat fish were acclimatized in three (3) plastic
bamboo containers before the experiment commenced. To mitigate environmental
factors as a result of the exposure of the plastic materials and the water used
for the experiment to atmospheric temperature, an open shed with rough thatched
was place over the water holding vessels with its sides rounded up with wire
mesh up to three feet high to prevent the entrance of rodents and human
factors. The fish were fed daily with 1.5mm to 4.5mm feed size of the pelleted
commercial feeds at 3% body weight throughout the twelve weeks’ experimental
period. Also measured was the temperature of the water using the thermometer
and the pH using the pH meter before the daily feeding practice.
The dissolved oxygen was monitored and measured weekly using the dissolved
oxygen meter. The volume of the water will be maintained at 0.18m3.
The top of the vessels were also covered with 5mm mesh size net to protect the
stocks from jumping out while the water in the vessels were changed bi-weekly
to avoid the build-up of nitrates and nitrites as effluent.
3.4 Acclimatization
The fishes were acclimatized for 14
days. The 3000 fishes were divided into ten (10) large plastic bamboo
containers having 300 fishes each with thirty litres of dechlorinated
water. The containers were aerated during this period, and water was renewed
daily to discard faecal material as well as left-over food. The fish were fed
twice daily with a 45% crude protein diet at 3% of their body weight, half at
08:00 and 16:00 hours, respectively. During this period, dead and abnormal
individuals were immediately removed. It was from the acclimated population
that healthy test fishes were carefully selected.
3.5 Acute
Toxicity Trial Runs
After the acclimation period trial
rounds of acute toxicity were done to determine the different concentrations of
each of the fertilizers to be used for the experiments, standard methods;
(UNEP, 1989) were used in carrying out the static bioassay with continuous
aeration experiment. Fishes were fasted 24hours prior to exposure time, the same concentration of the fertilizers was to be
delivered into the glass aquaria.
3.6 Experimental procedures
Exposure concentrations of NPK1, NPK2,
Urea and SSP fertilizers were prepared at 6.25g/l, 7.25g,/l,
16.25 and 12.50g/l respectively. Treatment 1 contained NPK 15:15:15, treatment
2 NPK 20:10:10, treatment 3, Urea, while treatment 4 contained Single
superphosphate fertilizer. Each of the treatments was replicated three times.
Twelve glass containers were randomly labelled and each filled with dechlorinated tap water up to 8 litres mark for each
treatment. The different concentrations were prepared by dissolving directly,
different weights of the fertilizers in the dechlorinated
tap water, APHA, (2005). The solution was stirred with a glass rod to obtain a
homogenous mixture. Within an hour, the containers were randomly stocked with
twenty (20) fish each using a scoop net. The test fish were not fed twenty-four
hours prior to the experiment and during the ninety-six hours’ exposure period.
Test solutions from each tank were drained out completely every morning and the
fish removed carefully with a scoop net and kept in a thirty litre plastic
container. Fresh solutions will be prepared and the fish will be carefully put
back. Fresh solutions were prepared daily.
3.7 Water quality parameters
Temperature, dissolved oxygen, pH, and
alkalinity of the various test media were determined at 24th, 48th, 72nd and
96th hours intervals during the experimental period as
suggested by APHA, (2005) and ASTM, (2004).
3.7.2 Dissolved oxygen
The dissolved oxygen content was
assessed with a Dissolved Oxygen Meter.
3.7.3
pH
The pH was determined with a digital
pH meter (Hannah product Portugal, Model HA 989).
3.7.4 Alkalinity
The procedure involved the collection of
water samples from each Aquarium in stopper bottles. 25ml of the sample were
pipetted into a conical flask and 5 drops of methyl red indicator and bromocresol green were added and titrated with standard HCL
acid (0.01N) from a 10ml burette, with continuous shaking until the colour
changed from blue to pale pink. The endpoint of pH were
read with a pH meter.
3.8 Histological analysis
Two Fish from each aquarium was
sacrificed after 15 days of exposure. Blood was collected from the post caudal
vein and serum was extracted after centrifugation and stored in -20˚C.
Liver and muscles (without skin) was quickly extracted, washed with 0.6 %
saline weighted, blotted and kept frozen at -20˚C for further biochemical
analysis. Similarly, kidney, gills, air breathing organs (ABO) and skin will
also be preserved in aqueous Bouines solution for
histological study at NVRI Jos.
3.9
Haematological Methods
Erythrocyte
Count: Total
count of RBCs were done with the help of the improved Neubauer
Haemocytometer slide and studied under light microscope (Olympus CH2Oi).
The erythrocyte count in fish blood was determined by using 0.85% NaCl diluting fluid. The dilution fluid is 1 part blood: 200 parts diluting fluid. The
counting was done in 5 of 25 small square of haemocytometer slide: 4 small
squares at four different corners and a central small square.
Calculation: The number of RBCs/mm3of
blood = the total number of cells counted X dilution X 4000 / the number of
small squares in which counting was done.
Differential
Count of Leukocyte: Blood
film was prepared with the Leishman’s stain following
the standard method used in human blood film preparation. The counting was done
in narrow longitudinal strips of the blood film starting from one end of the
film to the other end, avoiding lateral edges. While counting the number,
different types of leukocytes will be observed. The counting was replicated
three times.
Haemoglobin
Percentage: The
Haemoglobin percentage was estimated by Sahil’sHaemoglobinometer. The blood was blown out from the
haemoglobin pipette into the haemoglobin tube containing N/10 HCl. The contents of the haemoglobin tube was stirred with
glass stirrer and allowed to stand for 10 to 20 minutes. Then N/10 HCl drop by drop was added to the haemoglobin tube while
stirring with the glass rod till the colour in the haemoglobin tube match
exactly with that of the standard brown plates. Dilution of blood was read off
on the haemoglobin tube in terms g/100ml.
3.10 Plankton
Identification and Quantification
Plankton identification was done on a
light microscope (BRESSER, Germany) 100X magnification using identification
keys according to UNESCO (2007). 1 ml of water sample was taken from the
collecting bottles (200 ml bottles) using micropipette and transferred to a Sedgewick Rafter cell (Wild Supply Company, England) then
covered with slide at the top and placed under microscope. From 10 randomly
selected squares of cell, planktonic organisms were enumerated and numerical
abundance was calculated. Phytoplankton
and Zooplankton abundance will be
calculated using the following formulas as described by Greenberg et al. (1992) and Wetzel and Likens
(1991), respectively:
Phytoplankton Abundance=C/FxV
Where C is the number of organisms
counted, F is the number of fields counted and V is the volume of sample
settled.
Zooplankton /l= C x Va /VbxVc
Where C is the number of zooplankton counted, Va is the volume of the concentrated
sample (l), Vb
is the volume of counted sample (l)
and Vc is the volume of water filtered (l).
In case of plankton diversity,
Shannon-Wiener diversity index (H’) and evenness (J’) were used. Diversity
index of plankton was calculated by using the formula as described by Krebs
(2007):
H
Where k is the number of categories, fi
is the number of observations in category i,
n is the sample size.
Species evenness or homogeneity or
relative diversity (J`) was calculated from the observed species diversity and
from the equation of Hmax as described by Sundar et al. [32]. Index of species evenness was measured
by using the following formula:
J ′ =
where, H ′= ln( k)
3.11Data
Analysis
Water quality parameter was determined
at fixed intervals of 24, 48, 72 and 96 hours respectively. Mortality of the
fish species in each tank will be observed and recorded at fixed intervals of
24, 48, 72 and 96 hours, respectively. Dead fishes were removed immediately
from the test media, to prevent pollution in test media. A fish was considered
dead; when there was lack of movement and reaction to gentle prodding with a
glass rod. Other unusual signs of stress were equally monitored, such as
uncoordinated and irregular swimming pattern, vertical erection, overturning,
and restlessness, jumping out of the tank and gasping for air.
Each set of results
obtained from these experiments were analysed using analysis of variance at 5%
probability level among the four treatments. Analysis of the lethal
concentration (LC50) values for the 24th, 48th, 72nd and 96th hours with their
associated confidence intervals for the various concentrations of NPK and Urea
fertilizers were determined by Probit Analysis using
Statistical Package for the Social Sciences (SPSS) Data Editor version 25.0.
STATISTICAL
ANALYSIS
Data obtained were subjected to
analysis of variance and difference between means were separated by Duncan’s
multiple ranges test (DMRT)
4.0 RESULTS
4.1Results on growth performance exposed to
different commercial fertilizers
Data on the growth performance and
body length of African catfish raised in different fertilizer media are
presented in Table 4.1. Significant differences (p<0.05) were recorded on
the mean weight gain and mean length gain of catfish across the treatment. The
heaviest fish was found on T4 (105.6g), followed by T1(103.7g),
the least was found in T3(75.56g) while T2 had 90.75g. The average daily weight
recorded were highest in T4(2.85g), followed by T1
(2.80g), while T2 and T3 had 2.45 and 2.03g respectively. The average gain
weight recorded were highest in T4 (88.15g), followed by T1 (85.7g), while T2
and T3 had 85.7 and 69.63g respectively. The specific growth rate also showed
no significant difference at (p<0.05) with value as follows: T4 (0.49), T1
(0.48), T2 (0.46) and T3 (0.43). No significant difference (p<005) was
observed on the average final length, however, final mean length was found to
be highest in T4 (32.21cm) followed by T1 (29.01cm), the least that was
recorded was 24.7cm found in T3 while T2 had 26cm. Furthermore, the mean length
gain was also found to also be highest in T4 (25.41cm), followed by T1
(22.50cm), while the least was found in T3 (18.7cm). The highest mortality was
recorded in T3 (13.33%), followed by T2 (11.67%), T4 had 10% mortality while
the least was found in T1 (8.33%). There was no significant difference
(p<0.05) in the feed conversion ratio with a range of 1.04 - 1.61, with the
highest found in Urea (1.61), while the least was found in T2 (1.04).
Generally, on the growth performance of the fish, Urea was found to be more
toxic to the animals and it impeded the growth parameters.
Table 4.1:
Growth performance of African Catfish exposed to different fertilizers.
TREATMENTS
Parameter
N.P.K-1(T1)
N.P.K-2(T2)
UREA(T3)
SSP(T4)
Initial number stocked
60
60
60
60
Initial mean body weight (g)
18.00
21.12
20.74
17.45
Final mean body weight gain (g)
103.7
90.75
75.56
105.6
Mean body weight gain (g)/fish
85.7a
69.63b
54.81c
88.15a
Average daily weight gain (g)
2.80
2.45
2.03
2.85
Specific Growth Rate
0.48
0.46
0.43
0.49
Initial mean length (cm)
6.51
6.00
6.00
6.80
Final mean length (cm)
29.01
26.0
24.7
32.21
Mean length gain
22.50a
20.0b
18.7c
25.41a
Mortality
5.0
7.0
8.0
6.0
Mortality (%)
8.33
11.67
13.33
10.00
Mean daily feed consumed (g)/fish
2.94
2.55
3.27
3.09
Feed conversion ratio (FCR)
1.05
1.04
1.61
1.08
4.2Water quality Parameters
The result of the analysis of water
quality parameters is presented in Table 4.2, 4.3, 4.4, 4.5. Treatment with
inorganic commercial fertilizers caused changes in the water quality
parameters. Water temperature inflicts prominent effects in fish life directly
or indirectly influencing the aquatic environment. According to Kaur, Masud and Khan (2015),
every organism has specific survival range of environmental temperature for its
efficient existence and beyond these limits, conditions become lethal. Fish
being a cold blooded animal is affected by the temperature of surrounding water
in terms of the body temperature, growth rate, feed consumption, feed
conversion and other body function. Jhingran (1982)
observed that carps thrive well in the temperature range of 18.3-37.8°C.
Temperature data result is
presented in Table 4.2 and Figure 4.1. There was no significant difference down
the treatments and across the experimental week. At the first week, the highest
temperature was found in T3 (29.0oC) followed by T1 (28.42oC),
T2 and T4 had 28.33 and 28.21oC. At the second week, the highest
temperature was also found in T3 (27.89oC), followed by T1 (27.46oC)
while the least was observed in T4 (27.20oC). Similarly, after the 3rd
week, the highest temperature was also found in T3 (26.81oC),
followed by T1 (26.76oC), T2 and T4 had 26.21 and 26.11oC
respectively. Similar trend was observed from both 4th and 5th
week where the highest of temperature was found in Urea treatment while the
lowest temperature was recorded in SSP treated medium. Generally, all the
treatments have temperature (23oC - 29oC) that is optimum
for the rearing of Clariasgariepinus throughout
the period of this experiment, the same range of water temperature as suggested
Adeniji and Ovie (2009).
Table 4.2: Effect of different
commercial fertilizer on water temperature (oC)
Duration in Weeks
Treatment
1st
2nd
3rd
4th
5th
NPK-1 (T1)
28.42±7.51
27.46±4.01
26.76±3.31
24.51±3.27
23.24±2.15
NPK-2 (T2)
28.33±6.01
27.21±4.29
26.21±3.26
24.33±3.11
23.27±2,15
Urea (T3)
29.01±7.32
27.89±5.50
26.81±3.67
24.55±3.61
23.77±2.51
SSP (T4)
28.21±6.78
27.20±4.11
26.11±3.29
24.36±3.05
23.03±2.11
LOS
ns
ns
ns
ns
ns
P-value
0.1413
0.9212
0.1136
0.1083
0.9911
SSP=
Single Super Phosphate, LOS = level of significance, ns= not significant
Figure 4.1: Effect of inorganic
fertilizers on the temperature
The result of the effect of fertilizer
on pH is presented in Table 4.3 and Figure 4.2. There was no significant
different at (p<0.05) all though the treatments and across the experimental
weeks. At week 1, the highest pH was recorded on T1 (9.08) followed by T2
(9.03), T3 had (9.03) while the least was found in T4 (9.00). Whereas, by the 2nd
week, the highest was found in T1(8.95) followed by T4
(8.91), T2 had 8.52 while the least was recorded on T3 (8.33). Furthermore, at
week 3, the highest pH was recorded in T1 (8.77) followed by T4 (8.74) while T2
and T3 had pH 8.65 and 8.70 respectively. More so, at week 4, the highest pH
was recorded in both T1 and T2 (8.75), while T3 and T4 had 8.70 and 8.71
respectively. At the expiration of the experiment, the highest pH was found in
T2 (8.83) followed by T4 (8.79) while T2 and T3 had 8.83 and 8.75 respectively.
Table 4.3: Effect of different
commercial fertilizer on water pH
Duration in Weeks
Treatment
1st
2nd
3rd
4th
5th
NPK-1(T1)
9.09±0.21
8.95±0.10
8.77±0.11
8.75±0.08
8.72±0.05
NPK-2 (T2)
9.08±0.32
8.52±0.05
8.65±0.04
8.75±0.07
8.83±0.10
Urea (T3)
9.03±0.19
8.33±0.02
8.70±0.06
8.70±0.06
8.75±0.07
SSP (T4)
9.00±0.27
8.91±0.03
8.74±0.08
8.71±0.09
8.79±0.15
LOS
ns
Ns
Ns
ns
ns
P-value
0.1311
0.2214
0.1413
0.1136
0.2121
Figure 4.2: Effect of inorganic
fertilizers on pH
The result on the dissolve oxygen (DO)
is presented in Table 4.4 and Figure 4.3. The result revealed that there is no
significant difference (P<0.05) between the different means of the
treatments except at week five where the treatment had significant impact on
the DO level. At the end of the first week, the highest DO was found in T4
(6.53mg/L) followed by T3 (6.21mg/L) whereas, T1 and T2 had 5.71and 5.31 ppm
respectively. Similarly, at the 2nd week T4 also had the highest DO
(4.56mg/L) followed by T3 (4.41mg/L), the lowest was found in T1 (3.45mg/L)
while T2 had (4.12mg/L). Furthermore, it was observed at 3rd week
that the highest DO was found in T4 (4.87mg/L) followed by T2 (4.00mg/L), the
least was found in T3 (3.40mg/L) while T1 had (3.45). On the 4th
week, the T4 (5.28) followed by T2 (4.11mg/L), the least was found in T3
(3.07mg/L) while T1 had (3.08mg/L). At the end the experimental period, T4 had
the highest (5.25mg/L) followed by T2 (4.58mg/L), T1 had (3.35mg/L) while T4
had the least 2.31mg/L.
Table 4.4: Effect of different
commercial fertilizer on Dissolve Oxygen (mg/L)
Duration in Weeks
Treatment
1st
2nd
3rd
4th
5th
NPK-1 (T1)
5.71±0.07
3.45±0.05
3.45±0.05
3.08±0.01
3.35±0.06a
NPK-2 (T2)
5.31±0.10
4.12±0.06
4.00±0.06
4.11±0.02
4.58±0.05b
Urea (T3)
6.21±0.03
4.41±0.03
3.40±0.03
3.07±0.01
2.31±0.02c
SSP (T4)
6.53±0.02
4.56±0.02
4.87±0.02
5.28±0.02
5.25±0.01b
LOS
Ns
ns
ns
ns
*
P-value
0.0711
0.2214
0.1311
0.1136
0.02
Figure 4.3: Effect
of inorganic fertilizers on the Dissolve Oxygen
The result of the effect of fertilizers
on alkalinity of medium is presented in Table 4.5 and Figure 4.4. There is no
significant difference (p<0.05) in the mean of the treatments across the
experimental weeks. At the 1st week, highest value of alkalinity was
observed in T3 (51.21) followed by T2 (44.54), T1 had 40.61 while T4 had the
lowest alkalinity 38.00. Similarly, at the 2nd week, the highest
alkalinity was also found in T3 (54.11) followed by T2 (46.21), T1 (40.01)
while the least was found in T4 (41.50). It was also found that the alkalinity
is also highest in urea treatment (54.11) followed by T2 (49.42). T4 had
(44.00), the least is recorded on T1 (41.51). At the 4th week, T3
was also the highest (54.11) followed by T2 (52.01), T4 had (46.00) while the
least was observed in T1 (42.51). At the expiration of the experiment, the
highest level of alkalinity was recorded in T3 (59) followed by T2 (55.11), T3
had (47.51) while the least was found in T1 (44.51).
Table 4.5: Effect of different
commercial fertilizer on Alkalinity (mg/L)
Duration in
Weeks
Treatment
1st
2nd
3rd
4th
5th
NPK-1
40.61±49.05
40.01±48.16
41.51±47.23
42.51±47.23
44.51±48.07
NPK-2
44.54±55.45
46.21±50.11
49.42±51.01
52.01±48.16
55.11±51.14
Urea
51.21±45.21
52.17±46.21
54.11±45.31
57.14±45.41
59.11±45.31
SSP
38.00±52.14
41.50±51.37
44.00±52.14
46.00±52.14
47.00±52.14
LOS
ns
ns
ns
ns
ns
P-value
0.1141
0.1311
0.1413
0.2157
0.2214
Figure4.4: Effect of inorganic fertilizers on the Alkalinity
4.3Lethal Concentration
The table 4.6 above displays the
lethal concentration of various inorganic fertilizers (N.P.K-1, N.P.K-2, Urea,
and Single Super Phosphate (SSP)) at 50% mortality rate among Juvenile of
African Cat Fish (Clariasgariepinus).
It was observed that the concentration of N.P.K 15:15:15, N.P.K 20:10:10, Urea
and SSP that killed 50% of the African Cat Fish (Clariasgariepinus) within 96h, was 6.25g/l,
7.25g/l, 16.25g/l, and 12.50g/l, with 6.25g/l and 14.20g/l as the lower and
upper limit respectively.
Table 4.6 Lethal concentration of
different commercial fertilizers Analysis
Treatment
Conc. (g/l)
Log Conc.
No of Fish
Mortality
Mortality
(%)
Probit
N.P.K-1
6.25
0.796
10
2
20
1.0806
N.P.K-2
7.25
0.860
10
2
20
2.034
Urea
16.25
1.211
10
5
50
4.691
SSP
12.50
1.097
10
3
30
3.479
Confidence interval: 6.25g/l and
14.25g/l for lower and upper limit
4.4Impacts
of Fertilizers on the Hematological Parameters
The results
on total count (TC) of haemogblobin percentage (Hb) and red blood cell (RBC) is presented in Table 4.7. It
was observed that there is significant difference in the Hb
among the treatments (p<0.05) while significant difference was observed in
RBC. The highest value of Hb percentage was found in
T3 (10.40) followed by T2 (9.14), T1 had 9.26 while the lowest was found in T4
(8.11). Whereas, the count of RBC was highest in T3 (3.21 mm-3) followed by T1 (2.36), T2 had (2.117mm-3) while the least was also found in T4 (2.13mm-3). This result shows that Urea had
significantly higher Hb and RBC count among all the
treatment (Figure 4.5 and 4.6).
From Table 4.8 below the
highest percentage of lymphocyte was found in T4 (30) followed by T3 (24), T2
had 21 while the least was recorded in T1 (18). Heterophil
was found most abundant in T4 (15) followed by T3 (11), T2 had 10 while T1 had
the least value (7). More so, T1 had the highest eosinophil (12) followed by T2
(10), both T3 and T4 had 9%. Basophil was found highest in T1 (17) followed by
T2 (15), T3 and T4 had 15 and 7 % respectively. For monocytes, the highest
value was recorded in T4 (18) followed by T3 (15) while T1 and T2 had 10 and 13
respectively. Neutrophil was highest on T3 (14) followed by T1 (13) while T2
and T4 had 10 and 6% respectively. Finally, the highest value of thrombocyte
was recorded on T1 (14) followed by T3 (12) whereas T2 had (6), while the least
was recorded in T4 (4).
Table 4.7: Total count of RBC and
haemoglobin percentage (Hb)
Treatment
HB
TC of RBC (mm-3)
N.P.K-1 (T1)
9.260.34a
2.460.23
N.P.K-2 (T2)
9.140.21a
2.170.17
Urea (T3)
10.401.23b
3.210.21
SSP (T4)
8.110.14c
2.130.81
P-Value
0.031
0.071
LOS
*
ns
Note:
*=significant at p<0.05, ns= not significant, abc= means within the same column with no superscript
in common differed significantly
Figure 4.5: Haemoglobin
percentage
Figure 4.6: Total count of Red blood
cell
Table 4.8Differential count of White Blood Count (WBC)
Leucocytes
N.P.K-1(T1)
N.P.K-2(T2)
Urea(T3)
SSP(T4)
Lymphocyte
18
21
24
30
Heterophil
7
10
11
15
Eosinophil
12
10
9
9
Basophil
17
14
15
7
Monocytes
10
13
15
18
Neutrophil
13
10
14
6
Thrombocyte
14
9
12
4
4.5Effect
of fertilizers on plankton abundance
Table 4.9 shows the abundance of planktons
in each of the treatments. Treatment 4 (T4) had the highest
plankton diversity (p phytoplanktons and 5 zooplankton), this could account for
the high growth rate of Clariagarieoinusrecorded
in this study (Table 4.1) while treatment 1 and T2 had the lowest planktons
diversity (6 phytoplanktons and 3 zooplanktons). The phytoplanktons count for urea treatment is the highest
(11.80) followed by T2 (8.41), T1 had (8.22) while the least count was recorded
in T4 (6.36). Scenedesmusacuminatus, OedogoniumSpand Oscillation Spwere more abundant in SSP
treatments with respective value 0.61 x10³, 0.33 x10³
and 0.24x10³. While Chaetocerosdecipiens, AnabaeraSp and MicrocysitisSp
were more abundant in urea treatment with value3.51 x103,
2.31 x10³ and 3.51 x10³ respectively.For zooplanktons, urea treatment had the
highest count of ThermocyclopsSpand Rotifer with
0.49 x10³ and 0.31x10³ respectively. Zooplanktons was
most abundant in T4 (1.97) followed byT3 (0.94), T2 had (0.57) while the least
was observed in T1(0.35). The result also revealed
that T4 triggered the production of phytoplankton Cyclotollasp(0.22 x 10³) and Cosmariumsp (0.15x10³)
was absent in all other treatments. Similarly, T4 also induced the production
of Trichocoraobstusidas (0.75x10³) and Daphnia (0.20x10³)
which was also absent in all the other treatments.
Table 4.9: Plankton composition and
abundance (x103) in individual treatments
Component
N.P.K-1 (T1)
N.P.K-2 (T2)
Urea (T3)
SSP(T4)
Phytoplankton
Chaetocerosdecipions
2.310.34
2.290.20
3.110.47
2.500.22
Anabaera Sp.
-
-
2.310.22
2.200.19
Scenedesmusaccuninatus
1.040.03
1.120.10
0.520.02
0.610.01
Cyclotolla Sp.
-
-
-
0.220.02
Microcysitis Sp.
3.371.22
3.411.31
3.511.42
-
Englenaviridis
0.310.03
0.330.02
0.210.02
0.110.01
Oedogonium Sp.
0.180.1
0.220.04
1.020.01
0.330.03
Melosira Sp.
-
-
-
-
Cosmarium Sp.
-
-
-
0.150.03
Oscillation
Sp.
1.010.01
1.040.01
1.120.02
0.240.02
Pandorina Sp.
-
-
-
-
Total Abundance
8.221.74
8.411.68
11.802.18
6.360.53
Zooplanktons
Saccodernsp
-
-
0.140.02
0.720.03
ThermocyclopsSp
0.120.01
0.310.02
0.490.03
0.300.02
Trichocoraobtusidas
-
-
-
0.750.10
Rotifer
0.230.04
0.260.04
0.310.03
--
Daphnia
-
-
-
0.200.01
Total
Abundance
0.350.05
0.570.06
0.940.08
1.970.16
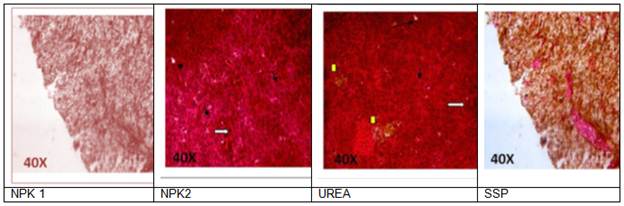
4.6 Histological Effect of fertilizers
on Clariasgariepinus
The
inorganic fertilizers used in this study altered the histology of various organs
of the fish as shown Figure 4.7, 4.8 and 4.9. Disorganization of the gill and
dilation of the blood capillary is clearly seen in treatments 1, 2 and 3,
although more marked in SSP treatment (Figure 4.7). Further changes in the
histology of skin were observed in the mucus and club cell. Hyperplasia of
mucous cell and sloughing of club cells of skin occurred at treatment with SSP.
Exfoliation of epithelial cell lining and disorganization of epithelial cell
layer was also seen. The club cell in the middle layer of skin shows
vacuolization and necrotic sections were obvious in urea NPK 2 treatment, this
could be because the level of ammonia is higher in those fertilizers than in
other.Liver is a centre for metabolism,
detoxification of xenobiotic, excretion of harmful substances,
exfoliation of epithelial cells in the lining of secondary lamellae was
observed in both urea and NPK 2 than in the other treatments.
Figure 4.7: Histopathology of gills in C. gariepinus in response to different fertilizers. Thick
arrows indicate hyperplasia of mucous cells. Excessive mucous secretion was
observed with NPK 2 and Urea in the gills. Thin arrows indicate exfoliation of
epithelial cells in the lining of secondary lamellae in both NPK1 and SSP
Figure 4.8: Histopathology of skin epidermis in response to different fertilizers
showed hyperplasia of mucous cell, sloughing of club cells and exfoliation of
epithelial cell lining and disorganization of epithelial cell layer especially
at the urea treatment
Figure 4.9: Histopathology of liver in response to different fertilizers in C. gariepinus. Urea alter liver
tissue organization and resulted in nuclear pycnosis
(white arrow) fatty degeneration (yellow arrow) necrosis & vacuolar degeneration (black arrow) in liver.
5.0
DISCUSSION
5.1 Results
on growth performance exposed to different commercial fertilizers
The growth parameters (average weight
gain and average length gain) show significant difference (p<0.05). All the
fertilizers impeded the growth of the fish, but remarkably, Urea had the
greatest impact as the fishes in that treatment had poor growth. Several
authors have reported toxicity of fertilizers on the water pond for different
fish species (Ofojekwu, Nwani,
and Ihere, 2008; Erol, Sevki, Halis and Ilhan, 2010; Essien, Asuquo and Ekpo, 2014) which had
led to high mortality. This result of this present study is consistent with the
report of Ofojekwuet al. (2008) and Essienet al. (2014) who confirmed urea as a
toxicant at lethal concentration which resulted not just in poor growth but
also remarkably higher mortality with prolonged usage. The difference in the
toxicity rate of the test medium could be because urea has more nitrogen when
compared with NPK 15:15:15 and NPK 20:10:10 while SSP has no nitrogen content.
This could be understandable because urea is known to hydrolyze
easily in water to give ammonium carbonate, which is volatile and thus releases
ammonia (Onusiriuka and Ufodike,
1992).The amount of ammonia present at a particular time would affect the
toxicity of urea as reported by Ufodike and Onusiriuka 1990.
5.2 Water
quality Parameters
5.2.1
Temperature
The result on the temperature implies
that the type of fertilizer does not have significant impact (p<0.05) on the
temperature of media. This result is similar to the findings of Kauret al.
(2015) and Asuquo, Essien-Ibok
and Abiaobo (2016) who reported that fertilizers does
not affect the thriving temperature of Cyprinuscarpioand Heterobranchusbidorsalis respectively.
Similarly, Ofojekwu et al. (1990) and Ufodike, et al. (2008) who exposed Tilapia zilli and Clariasgariepinus fingerlings respectively to acute
concentrations of inorganic fertilizers; NPK, urea, calcium hydroxide (Ca (OH)2, potassium phosphate (Na3PO4.12H2O) and sodium
nitrate (NaNO3); and reported there was no significant difference between the
various mean values of temperature and pH (P>0.05).
5.2.2 pH
The study revealed that there was no
significant difference between the various means value of pH.
This study also agrees with the work of Ufodike and Onusiriuka (1990), Ofojekwuet
al., (2008) and Kauret al. (2015). The pH during the experiment
ranged between 8.33±0.02 – 9.09±0.21in all the treatments which is within the
optimum limit for growth and health of most fresh water is in range 6.5 – 9
(Boyd, 1998). The suboptimal pH can cause stress, increased susceptibility to
disease and poor growth in fish. The findings were also in agreement with Sahu, Jena, Das, Mondal and
Das(2007) who reported that pH was found to be higher under the influence of
the application of organic and inorganic fertilization alone or in combination
of both Qin, Culver, and Yu(1995) also observed that inorganic fertilizer
enhance the primary productivity, dissolved oxygen, pH than organic
fertilization.
5.2.3
Dissolve Oxygen
Fertilizers treatments had no
significant impact on the dissolve oxygen level except at the 5th
week. However, the at the first week, the values of DO
were at the desirable limit as fresh water fish requires DO≥5mg/L for
good growth and development as stipulated by Swingle
(1969). According to Boyd (1998), oxygen concentration of less than 3.5 ppm is
fatal to carps within duration of 24 hours. However, near fatal and fatal level
of DO was recorded from 2nd to the 5th week. The most
fatal DO was recorded on Urea treatment and this could account for the high
mortality on this treatment. This result of this study negates the findings of Kauret al (2005)
who reported that inorganic fertilizer application has no impact on the DO
level of fish medium; the discrepancy could be because of the differences in
the types of fertilizer used and the duration of the experiments. Shevgooret al.
(1994) also reported that increasing level of fertilization raise all the water
quality parameters insuitable range except dissolved
oxygen which showed the variation at dawn by the application of high manuring rate.
5.2.4
Alkalinity
Generally, the present study revealed
that the total alkalinity ranged between 38-59mg/L in all the treatments during
the 5 experimental weeks which is within the suitable range for fish production
(Kaur, 2015). Alkalinity was relatively stable
throughout the experiment, with narrow fluctuations in urea treated medium.
This result is similar to the report of Essienet al. (2014) who reported alkalinity of
38-40mg/L of pond treated with chemical fertilizer of various concentrations.
Furthermore, the level of alkalinity increased with increase in the number of
weeks. Boyd et al. (1998) stated that
total alkalinity is an important environmental variable in aquatic ecosystem
because it interacts with other variables that affected the health of aquatic
animals or the fertility of the ecosystem. Boyd and Lichtkoppler
(1979) suggested that water with total alkalinities of 20 to 150mg/l contains
suitable quantities of carbon dioxide to permit plankton production for fish
culture. According to Wurts and Durborow
(1992),alkalinity between 75 to 200 mg/L, but not less
than 20 mg/L is ideal inan aquaculture pond.
According to Santhosh and Singh (2007) the idealvalue for fish culture is 50-300 mg/L.
5.3 Lethal
Concentration
The results from the study on the
lethal concentration were lower than the values reported by Ufodike
and Onusiriuka (2008) and also Mac Kinlay and Buday (1997) for
N.P.K-1 and N.P.K-2. Ufodike and Onusiriuka
(2008) estimated that the 96-h LC50 value of composite fertilizers for African
catfish (C. gariepinus) ranged from 33.9 mg/L
for Ca (OH)2 to
1.25 g/L for NaNO3. In another study, Ofojekwuet
al. (2008) reported that the 96 hr LC50 of urea
fertilizer for Tilapia zillifingerlings to be
15.85 g/L with lower and upper confidence limits being 8.85 and 28.46 g/L
respectively. In the present study, the 96-h LC50 value of urea fertilizer for C.
Gariepinusi
was 26.54 g/L with 25.99 g/L and 27.00 g/L as the lower and upper limits
respectively. This is higher than that reported by Ofojekwuet al. (2008) for Tillapiazilliwhile similar to the report of Ufodike and Onusiriuka (2008) for
C. gariepinus. The difference between this
current report and that of Ofojekwuet al.
(2008) might be related to differences between the fish species. Clariasspecies is a well-known hardy fish.
The difference might be related to fertilizer composition, fish and
physicochemical characteristics of the test water (Sahaet al., 2002; Palaniveluet al.,2005).
5.4 Impacts of Fertilizers on the Hematological Parameters
In the present study, all the
fertilizers applied to Clariagariepinusexhibited
distinguishable response of haematological variables. It was suggested that
haematological parameters reflects the ecological conditions of the habitat of
the fishes (Goel, Mishra, Gupta and Wadhwa, 1998; Maitra and Nath, 2014).The result of this study falls in line with the
works of Akinrotimiet al. (2011b) on acute
haematological study of cichlid fish. Sarotherodonmelanotheronexposed to toxicants. The rise in
WBC, neutrophils and monocytes shows an immune response to the toxicants. The
result is in agreement with work of Akinrotimi and
Gabriel (2012) on submission of remarkable richness of toxicants on the fish
blood, where they found that more of these white blood cells and its components
are recruited to combat the stressor in the blood stream of the fish. The
result shows the values of RBC, Hb, lymphocyte and neutrohil were higher in the urea group than in other treatments which was in agreement with the studies of Maitra and Nath (2014) who
reported that sub-lethal concentration of urea increase RBCs count as well as Hb at exposure for 14days. Similarly, this is also in
conformity with the observation of Sasikalaet al (2011) who observed significant
changes in haematological parameter in Channastriata.
Initial increase in both studied parameters and then gradual decrease with the
increase of doses, indicating slow recovery from adverse condition in the
fishes. Roy and Nath (2001) reported almost similar
observation in case of Thiamethoxam treated Oreochromisniloticus.
Then a gradual decrease in total count of RBCs and haemoglobin percentage
indicates anaemia that could be due to break down and destruction of RBCs
triggered by influx of urea into erythrocytes as in case of phenol-dosed fishes
Maitra and Nath
(2014).Haematological parameters have been considered as indicator of stress,
induced by pesticides and variation in RBCs count and the haemoglobin
concentration was due to the deleterious effect of pollutant on the erythropoietic tissue of Mystusvittatus(Verma, Sarita and Dable, 2002). Goger and Sawant (2009) suggested
that differential count (DC) of leukocytes is a reliable proof the negative
effect of urea on these leukocytes, though its haematological index is used to study the change in
environmental conditions.
5.5 Effect of
fertilizers on plankton abundance
The result on the effect of
fertilizers on the planktons abundance revealed that
SSP treatment is has more phytoplanktons and zooplanktons
diversity more than all other treatment and also more zooplanktons count.
However, urea had more pytoplanktons count.
Furthermore, zooplankton Trichocoraobstusidasand
Daphnia which was available in SSP treatments but absent in other
treatment has been reported to be among the preferred food for Clariasgariepinusduring
early life (Oyin, 2013). Hence the observed higher
survival of juvenile in T4 as against other treatments, similarly Boyd
and Massaut (1999) reported that inorganic fertilizers
have much higher concentrations of nutrients such as nitrogenous compounds than
manures.
5.6
Histological Effect of fertilizers on Clariasgariepinus
The
gill of C. gariepinushelps in survival under desiccation
and hypoxic condition in water. The important histopathological
alterations observed in the gill of C. gariepinusdue
to the effect of inorganic fertilizer include detachment and lifting of the
respiratory epithelia from the underlying vascular components of the secondary
lamellae and sloughing off viable epithelial cells (Fig. 4.7), which results in
haemorrhage into the lumen fuse causing reduction of volume of the lumen. The
result correlate with findings of Rajan and Banerjee
(1993) for histopathological damage to the air sac of
H. fossilisexposed to a lethal concentration
of mercuric chloride. The skin is a primary defensive organ of any organism. In
C. gariepinusexposed to NPK fertilizer, the
club cells in the middle layer of skin show vacuolization and many other
symptoms of necrosis. The disorganization of epithelial cell layer due to
hyperplasia and breakdown of a crust of a dead layer of cells increases the
barrier distance between dissolved oxygen in the media and blood in sub-epidermal
blood vessels. Further, liver which is the primary organ for metabolism,
detoxification of xenobiotics and excretion of many
harmful substances was monitored for histological changes under NPK induced
stress. The liver has the ability to degrade toxic components, but its
regulating mechanisms can be overwhelmed by elevated concentrations of these
compounds, and could subsequently result in histological changes and structural
damage (Brusle, et al., 1996). High dose of
NPK showed larger lesion area in liver than low dose.
Further,
the histopathological study of gill under different
sub-lethal doses of showed hyperplasia of primary and secondary lamellae,
degeneration of epithelium, fusion of adjacent secondary lamellae, increased
mucus production, secondary lamellae appeared thickened and shortened with
extremely rough surface and considerable mucus in both low and high dose
treatment. A similar observation was also made by Tandjunget al., and Lamchumchanget al., in
brown trout, Salmotruttaand Oreochromisniloticus.
In
conclusion, the present study provides a detailed insight of the responses
mounted by fishes to exogenous NPK fertilizer. It further provides an
understanding of the impact of employing chemical fertilizers on aquatic life.
6.0 CONCLUSION AND RECOMMENDATION
6.1
Conclusion
Sequels to the discussion of the
findings in this study, the following conclusion were made;
i.The
various fertilizer (N.P.K-1, N.P.K-2, Urea, and SSP) use inthe experiment impeded the growth of the fish
ii.There
is no significant variation among the fertilizer on the water parameter over
the period of experiment, except water for DO.
iii.Water
temperature, pH, and Alkalinity were suitable for the survival of the fish
within the period of experiment
iv.Dissolve
oxygen of the water was within the toxic value over the period of experiment
v.The
lethal concentration that killed 50% of the fishes within 96h were 6.25g/l,
7.25g/l, 16.25g/l, and 12.50g/l
vi.There
was significant variation among the fertilizer in the total count ofHaemoglobin in the fishes
vii.All
fertilizer treated on the fishes exhibited distinguishable response of
Haematological variables
viii.Single
super phosphate had highest white blood count in lymphocyte, heterophil, and monocytes.
ix.Urea
had the highest white blood count in neutrophil
x.N.P.K-1
and 2 had the highest white blood count in eosinophil, basophil, and
thrombocyte.
xi.Single
super phosphate had the highest plankton diversity
xii.N.P.K-1
and 2 had the lowest plankton diversity
6.2
RECOMMENDATION
Recommendation
From the result of this study, the
following are recommended:
i.Fish
farmers using inorganic fertilizers should endeavour to monitor the
time/duration of the application, and not exceed the days, so as to avoid acute
toxicity
ii.It is thus recommended that the
application of these fertilizers in aquatic ecosystems either in ponds,
irrigations or farms should be carefully controlled or monitored, such that
concentrations that are lethal to aquatic life could be avoided.
iii.Single super phosphate seems to be
least toxic inorganic fertilizer, so fish farmers can use it for fertilization
iv.There
is also a great need to provide further baseline data on inorganic fertilizer.
Such studies should be concerned with providing information on research such
as, the effects of sub-lethal concentrations of fertilizer on the; serum/plasma
enzymes, metabolites and hormones of C. gariepinus.
v.When
toxicities of inorganic fertilizer are minimised in our environment and water
bodies’ biodiversity will thrift thereby providing sufficient food to the
increasing human population.
REFERENCES:
2004, Standard Test Methods for
Measurement of Hydraulic Conductivity of Saturated Porous Materials Using a
Flexible Wall Permeameter, Standard D5084-03,
American Society for Testing and Materials, Philadelphia.
Addiscott TM, Whitmore AP and Powlson DS (2001):
Farming, fertilizers and the nitrate problem. C. A. B International, Willingford. 281pp.
Alexander M (2006): Introduction to soil
microbiology. John Wiley & Sons, Inc. New York.
237pp.
Almazan G and Boyd CE (1978): Effects of nitrogen levels on
rates of oxygen consumption during decay of aquatic plants. Aqua.
Bot., 5:119-120.
Amadi A (2001) Chemistry, agriculture and
the environment. In: Richardson ML (eds.), The Royal Society of Chemistry, Cambridge, USA. pp. 301
APHA 2005. Details
for American Public Health Association (APHA) 2005,.
Standard ... ASTM
APHA, AWWA, WEF (2005) Standard methods for the
examination of water and waste water. (21st Edn),
American Public Health Association, Washington, USA, pp. 1-541.
ASTM (2004) Standard guidelines for conducting
acute toxicity test with fishes. Annual book of ASTM
standards, West Conshohocken, Pennsylvania, 10: 13.
ASTM section
4 (Construction, 2013) and section 11 (Water and Environmental Technology, 2014).
Bard,
J., Dekimpe, P., Lazard, J., Lessent,
P, and Lemasson, J. (2006). Handbook of Tropical fish culture Centre technique forestier
Tropical 45 bis, AvennedelabelleGarielle 94130-Nogent Suriname France. Ed. Ministry
of Foreign Affairs Pg. 67-92.
Boumans, L. J. M., Fraters, D., & Van Drecht,
G. (2005).Nitrate leaching in agriculture to upper groundwater in thesandy regions of The Netherlands during the
1992–1995period.Environmental Monitoring and Assessment, 102(1–3), 225–241.
Boumans, L., Fraters, D., and Van Drecht, G. (2004)
Nitrate leaching by atmospheric deposition to upper groundwater in the sandy
regions of the Netherlands in 1990. Environ.
Monit.
Assess.93:1–15.
Brusle, J. and
Anadon, G. G. (1996).The Structure and Function of Fish
Liver. In: Fish Morphology. Science Publishers, pp 77-93.
Burgett A.A.,
Wright C.D., Smith G.R., Fortune D.T., and Johnson S.L. (2007). Impact of ammonium nitrate on wood frog (Ranasylvatica)
tadpoles: Effects on survivorship and behavior.
Herpetological Conservation and Biology 2:29–34.
Calamari, D. and Naeve, H.
(Eds.) (1994).
Review of pollution in the African aquatic environment. CIFA Technical Paper
No. 25, FAO, Rome, 118 pp
East Africa. In: Natarajan, P., Wondimu, L., Boyossa, T., Zuberi, M.I., Nair,
A.S., Beyeh, A. and Aga, E. (Eds.). Technical Proceedings of the International Conference on Ecosystem
Conservation and Sustainable Development (ECOCASD), Ambo University, Ambo,
Ethiopia. (pp. 85-97). Available at
http://tafiri.weebly.com/uploads/4/6/1/1/46116859/shoko_s_cv__latest_16-9-2015.pdf
[Accessed on 26th September, 2015].
Erol, C., Sevki, K., Halis,
B. and Ilhan, A.(2010).Acute
Toxicity of Some Agriculture Fertilizers to Rainbow Trout. Turkish Journal of
Fisheries and Aquatic Sciences 10: 19-25
Essien-ibok M. A, Asuquo I. E and Ekpo I. E (2014).The assessment of acute toxicity of urea
fertilizer against Heterobranchusbidorsalis
fingerlings. Global Journal of Fisheries and Aquaculture, 2(5): 169-176.
EU (1998)
‘Council Directive 98/83/EC of 3 November 1998 on the quality of water intended
for human consumption’, Official Journal of the European Communities,
Brussels, European Union.
Ezeka EC (2004): Chemical pollution, public health and
environmental sustainability in Nigeria. Journ.of
Environ. Health,1(1):43-57.
FAU, IFAP,UNICEF, WFP
and WHO (2018). The State of food security and Nutrition in
the world 2018.Building climate resilience for food security and Nutrition.
Rome, FAO
Food and
Agricultural Organization (2004) Meeting on the toxicity and bioaccumulation of
selected substances in freshwater organisms.Rovinj, Yugoslavia.
Galloway,
J.N. and Cowling. E.B. (2002) Reactive nitrogen and the world:
200 years of change. Ambio. 31:64–71.
Goel, K.A.,
B.P. Mishra, K. Gupta and S. Wadhwa, 1984.A comparative
haematological study on a few fresh water teleosts. Ind. J. Fish, 3: 108-112.
Greenberg
AE, Clesceri LS, Eaton AD (1992) Standard methods for
the examination of water and wastewater, (18thedn).American Public Health Association.Port City Press, Baltimore, Maryland.
Haygarth, P.M.
(2002) Jarvis, S.C.; Agriculture, hydrology and water quality. CABI, Wallingford, Oxfordshire, UK.pp: 8–25.
Jhingran VG
(2002) Fish and fisheries of India.Hindustan Publishing Cooperation, Delhi, India.
Jhingran, V.G., 1982. Fish and fisheries of India.Hindustan Publ. New Delhi, pp:
666.
Lamchumchang, K., Jiraungkoorskul, W., Sahaphong,
S., Tansatit, T., Kosai, P.
and Madarasmi, R. (2007).Dietary calcium reducing
effects of waterborne lead uptake in Nile Tilapia (Oreochromisniloticus).AJAVA., 2: 104-114
Meehean, O.L.
and F. Marzulli, (2005).The relationship between the
production of fish and the carbon and nitrogen contents of fertilized fish
ponds. Trans. Amer. Fish. Soc., 73(1): 262-273.
Moomaw, W.R. (2002) Energy, industry and nitrogen: strategies for decreasing
reactive nitrogen emissions. Ambio. 31:184–189.
Nychas A (1990): An EEC perspective on fertilizer use.
Chemistry and Industry, 24: 823-831.
Odiete, WO. (1999).
Environmental Physiology of Animals and Pollution.Diversified
Resources Ltd., Lagos, p. 261.
Ofojekwu, P. C., Nwani, C. D and Ihere,
R. E. (2008).Acute Toxicity of Urea Fertilizer to Tilapia zilli
Fingerlings. Bio-Research, 6(1): 298 – 300
Omotoyin, BO
(2007).Introduction to Fish Farming in Nigeria.Ibadan
University Press, Publishing House, University of Ibadan, Ibadan, Nigeria. p. 60 .
Onusiriuka, B. C.
and Ufodike, E. B. C. (1992).Acute toxicity of some
inorganic fertilizers to Oreochromisniloticus. Journal of Aquatic Sciences 7: 7 – 11.
Palanivelu V., Vijayavel K., Ezhilarasibalasubramanian
S., and Balasubramanian M.P. (2005). Impact of fertilizer (urea) on oxygen consumption and feeding
energetics in the fresh water fish Oreochromismossambicus. Environmental Toxicology and Pharmacology 19:
351–355. DOI: 10.1016/j.etap.2004.09.001.
Proceedings of All India Seminar on Ichthyology, , 1977 at Modinagar (U.P.),
India, p.35.
Rabalais, N.N. (2002) Nitrogen in aquatic ecosystems. Ambio.31:102– 112.
Rajan, M.T.
and Banerjee, T.K. (1993).Histopathological
changes induced by acute toxicity of mercuric chloride on the air- breathing
organ (branchial diverticulum) of the live fish Heteropneustesfossilis (Bloch). ActaHydrochim Hydro- biol 21:316–322
Roy, R.
and S. Nath, 2011.Some hematological
investigations on Oreocromisniloticus (Trewavas) following exposure to Thiamethoxam.Acta zool. Lituanica,
21(4): 301-305.
Sahoo, S.K., Giri, S.S. and
Chandra, S. (2008). Rearing performance of Clariasbatrachus larvae: Effect
of age at stocking on growth and survival during fingerling production.
Aquaculture, 280: 158-160.
Sasikala,G.,P.Palanisamy,D. Mallikaraj, N. BhuvaneshwariandG.M.Natarajan,
(2011) Metasystox Induced Haematological Modulation
in the South Indian snake headed Channastriata. Int.
J. Pharm. and Biol. Arch., 2(2): 775-777.
Sundar, S., Raina, H.S., Mohon, M. and Singh, B. (1995).Ecology and fisheries
potentials of the Guala River with special reference
to proposed impoundment (Jamrani dam) on the system. Journal
of Inland Fisheries Society of India, 27 (2): 33‐45.
Tandjung, S.D. (1982). The Acute Toxicity and Histopathology of Brook Trout (SalvelinusFontinalis, Mitchell)
Exposed to Aluminum in Acid Water. Fordham
University, New York, USA., Pages: 426.
Ufodike EBC, Onusiriuka BC (1990) Acute
toxicity of inorganic fertilizers to African catfish, Clariasgariepinus. Aquaculture research 21(2): 181-186.
Ufodike, E. B.
C. and Onusiriuka, B. C. (1992). Gill damage and Haematology in African catfish exposed to inorganic
fertilizers. Nigerian Journal of Biotechnology 7: 279 –282.
UNEP Regional Seas Studies and Reports
No. 3.United Nations .Reports No. 106. United Nations Environment
Programme (UNEP, 1989).
UNESCO (2007). The State
of Education in Latin America and the Caribbean: Guaranteeing Quality Education
for All “life-long learning is a right.
Unhttps://www.un.org/goal-14life-6-2022. One of
the ways to conserve our oceans is through the reduction of water pollution
such as the excess of inorganic fertilizer used in this research.
Unstats.Un.org.2022
Vitousek, P.M., Aber, J.D., Howarth, R.W., Likens, G.E., Matson, PA., and
Schindler, D.W. (1997) Human alteration of the global nitrogen cycle: sources
and consequences.Ecol Appl. 7:737–50.
Vitousek, P.M., Howarth, R.W., 1991. Nitrogen
limitation on land and in the sea. How can it occur? Biogeochemistry 13,
87–115.
Wetzel RG, Likens GE
(1991) Limnological Analyses, (2ndedn). Springer-Verlag, New York, USA.
Wetzel, R.G. (2001) Limnology. 3rd edition. New York: Academic Press.
Cite this Article: Datit, JS; Gogol, AR; Deshi,
SN (2023). Assessment of Toxicity of Inorganic Fertilizers on Clariasgariepinus Juveniles
Towards Attaining SDG No. 2 and No. 14. Greener
Journal of Agricultural Sciences, 13(2): 62-79. https://doi.org/10.5281/zenodo.7993753.