1. INTRODUCTION
Fish is the primary
source of protein in the diet of Bangladeshis, making up nearly 60% of all
animal protein (Shamsuzzaman et al., 2020). Per
capita, fish consumption in the nation is 62.58 grams, which is more than their
daily protein need (60 gm)
(Bangladesh Bureau of Statistics, 2017). The importance of fisheries to the
national economy as an agro-based nation and as the primary source of animal
protein, employment opportunities, food security, foreign earnings, and social
growth has always been undeniable (DoF, 2018). It
adds about 24.41 percent to the agricultural GDP and 3.61 percent to
Bangladesh's overall GDP (DoF,2018). The average
growth rate of this industry during the last ten years has been close to 5.43
percent. In 2018, Bangladesh was ranked third globally for inland fish output,
fifth globally for aquaculture production, and eleventh globally for marine
fish production. Bangladesh is currently self-sufficient in producing fish and
has begun to gain international prominence as one of the nations with the
largest fisheries (Shamsuzzaman et al., 2020).
Ponds play a significant
role in fish cultivation and maintaining ecology. Despite their tiny size,
Ponds have essential environmental, social, and economic services, such as
supplying drinking water, recharging groundwater, serving as sponges to
regulate floods, sustaining biodiversity, and giving livelihoods through fish
cultivation (Saha et al., 2017). Pond habitats often
teem with lush flora and a vast array of organismal life. A pond is a more
petite body of fresh water than a lake (F & O, 2017). Ponds are significant
hotspots for fish cultivation and biodiversity. Collectively, they support more
species and scarce species than any other freshwater habitat (Day &
Biodiversity, 2016). They are also more abundant than almost any other
freshwater habitat and are found in virtually all environments. Various
problems have often hampered optimum fish production in culture systems,
including a need for more information on fish cultivation setup and a lack of
knowledge about pond water quality requirements for optimal fish production (Makori et al., 2017). Various chemical characteristics
exist in low quantities in most bodies of water. This concentration level rises
due to human activity and a lack of environmental management (Ehiagbonare & Ogunrinde,
2010).
Water quality is the
water component that must be present for aquatic creatures to flourish
optimally (Ehiagbonare & Ogunrinde,
2010). Identifying the fluctuation and ideal range of limnological
parameters, such as pH, temperature, alkalinity, total hardness, potassium,
nitrate, phosphate, and dissolved oxygen (DO), is essential for improving the
primary productivity of fish cultivation pond water (Rukhsana
et al., 2021). Productivity is determined by the physicochemical properties of
the water body ( Keremah
R.I. et al., 2014).
Most fish in Bangladesh are found in wetlands,
but we have an abundance of ponds in various parts of the country, allowing us
to increase fish cultivation output and reduce the demand for fish consumption.
Not only may it assist in reducing the annual demand for fish, but it could
also contribute to economic growth and job creation. Therefore, using the urban
pond for fish farming could be a viable solution to this problem. The
investigation on the Physicochemical properties of
surface water bodies (ponds) that are still and might be used for fish culture
in the Jashore municipality of Bangladesh is
presented in this paper. This study's goal is to determine the water's
physicochemical parameters and assess the water's suitability for fish
cultivation.
2. STUDY
AREA
Jessore is a district in
Bangladesh's southern region. Khulna and Satkhira are
located to the south, Magura and Narail
to the east, and Jhenaidah to the north. The region
produces crops year-round. Employment in fish cultivation in Jashore decreased from 47,570 in 2005 to 46,050 in 2010.
The transition from agriculture to industry and commerce increases the urban
population. Urbanization continues. The population of Jashore
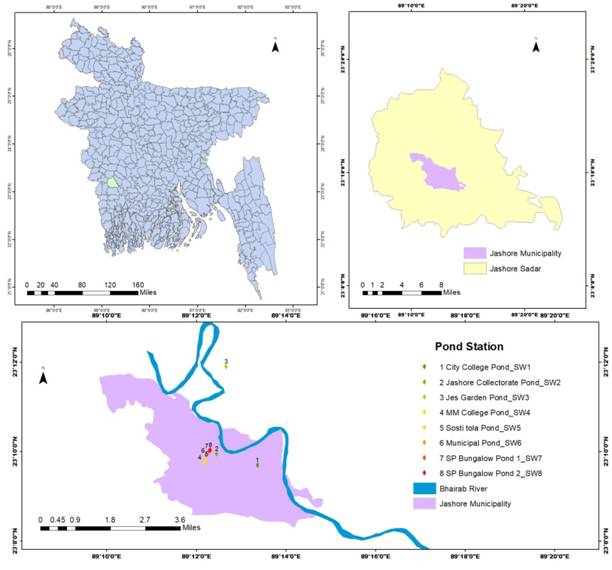
is unevenly distributed. July 2019 was the month of the study. Surveyors
investigated eight ponds in Jessore.
These ponds were
chosen for the study because they may serve as a basis for optimal fish
cultivation.
A
water sample (n=3) was obtained from each pond in a prewashed plastic container
(5 liters in each) (5 liters in each). Immediately, the temperature was
measured using a glass mercury thermometer. The conductivity/TDS electrode was rinsed
with distilled water.
Typically, the pH scale ranges from 0 to 14,
with pH seven at 25°C. A direct reading pocket pH meter electrically monitors
the pH level. For calculating the potassium concentration, the flame
photometric technique was used (ppm). Ca and Mg
concentrations were determined using the titrimetric technique. To determine
chloride, the Mohr titration technique was used. The bicarbonate concentration
was determined using a potentiometric technique. By using a spectrophotometric
technique, sulfate content was determined. The nitrate content in the sample
was determined using an ultraviolet spectrophotometric screening technique.
Using SPSS 21 software, simple correlation and regression were used to examine
the data statistically.
4. RESULTS
AND DISCUSSION
4.1 Water
quality profile
The water quality profile for different ponds
in Jeshore municipalities is provided in table 2. The
pH range for all fish farms was 6.90 to 8.24, which is considered ideal for
most species. For most freshwater organisms, a pH of 6.5 to 9.0 is considered
optimum (Boyd, 1990). The pH range for pond water should be between 7 and 8
(CUMINGS, 1962). Fish have cold blood; hence the environment's temperature
affects how hot or cold they are. It varies according to the ambient
temperature. Temperature fluctuations impact fish production because they
impact their physiology and metabolism (Kumar et al., 2017). Water
at Jashore's pond ranged in temperature from 30.8 to
34°C. Due to the sample period falling in July, the temperature was
high. Between stations, the average temperature is essentially the same.
According to reports, the ideal pond water temperature for fish survival is 20
to 30 degrees Celsius (Jonassen et al., 1999).
Water cleanliness may
be assessed using electrical conductivity (EC). It is influenced by the water's
temperature and ionic content. A water body's conductivity correlates directly
with the salts present (Bhatnagar & Devi, 2013;
Kumar et al., 2017). Averaging 450.75 µS/cm, the electrical conductivity of all
sample locations ranges from 270 to 653 µS/cm. The
study found that the BOD value ranged from 1.8 to 2.9 mg/L. If BOD levels are
high in the research region, more organic matter will be in the water body.
This organic material originates from surface runoff, agricultural and forestry
runoff, home wastewater, and municipal wastewater discharge. Less than five
mg/l of BOD is the acceptable standard for fish culture (Das, n.d.) According to ("DoE Standards," 2004), a BOD
level of 5 mg/l or more is appropriate for fish culture. The quantity of
dissolved oxygen required varies depending on the type of animal. Given the findings and the fact that the primary productivity
values at 20-30 ppm and 10-20 ppm were not significantly different. It
is suggested that to maintain the best conditions for fish culture in
wastewater fish ponds, a BOD level of 10-20 ppm may be continuously maintained
through the split application of sewage effluent (Chattopadhyay
et al., 1988). Too much or too little dissolved oxygen in the water may damage
aquatic life and alter its quality. While shallow-water fish need larger
quantities of oxygen (4–15 mg/l), bottom feeders like crabs, oysters, and worms
only require a small amount (1-6 mg/l) (Singh & Kumar, 2016). All sample locations
had TDS ranging from 241.20 to 606.20 mg/L. The research area's typical TDS
situation is 396.49 mg/L. The TDS value is depicted in Table 2 for various
stations.
By mixing oxygen and
nitrite, the autotrophic Nitrobacter bacteria make
the innocuous compound nitrate. Nitrate concentrations typically stabilize
between 50 and 100 ppm
(Bhatnagar & Devi, 2013). The range
we found in our research for nitrite concentrations is presented in Table 3
(Boyd, 1990). When sodium and potassium levels are less than ten mg/L,
potassium can equal or even exceed sodium in salt water, which has 390 mg/L.
Biological and agricultural inputs in surface water create higher potassium
concentrations (Hem, 1985). The average potassium content in the research
region is 13.14 mg/L, ranging from 4.78 to 27.51 mg/L. A pond's water should
have at least 20 ppm of calcium (hardness). More than 20 ppm of calcium is okay
and will not be problematic (Crosby et al., n.d.).
The average calcium content in the study region is 37.82 mg/L but ranges from
23.07 to 64.12 mg/L. However, the geochemical behavior of magnesium differs
significantly from that of calcium. Magnesium is often not a limiting element
in fresh water, although certain marine or brackish ponds that sustain marine
organisms may need supplementation. Hardness and alkalinity levels in most
waters are comparable and vary from less than 5 mg to over 150 mg/L (Claude E.
Boyd, 2015; Sink et al., n.d.). The average magnesium
content across all sample sites is 10.34 mg/L, ranging between 1.22 and 30.38
mg/L.
CONCLUSION
Assessing water quality is critical for
maintaining quality fish production in the pond. When the results were in, it
was evident that none of these ponds had suitable water quality for farming or
culture due to high electrical conductivity and temperature levels. However,
their nitrate levels were significantly lower than what was regarded
acceptable. The findings of every water sample taken from the ponds indicate a
very substantial concentration of bicarbonate. The correlation analysis of the
water sample shows that the quantity of oxygen in the pond water substantially
influences the level of DO and the pond water's temperature.
Similarly, chloride
and sulfate ions affect the pH and TDS levels in the pond. On the other hand,
Mg ion has a positive impact on the value of electrical conductivities. The
current research provides baseline data for farm management and the optimal
physicochemical range that aids in maintaining water quality throughout fish
production. Most of the pond sample parameter values indicate that they do not
satisfy the requirement for fish farming. We succeeded in achieving our primary
goal of this study, which was to evaluate the water quality for fish farming
suitability. However, the outcome needs to be more convincing for this purpose.
REFERENCES
Bangladesh Bureau of Statistics. (2017). Bangladesh
Statistics 2017. Bangladesh Bureau of Statistics Statistics and Informatics
Division Ministry of Planning, 1–73.
Bhatnagar, A., & Devi, P. (2013). Water quality
guidelines for the management of pond fish culture. International Journal of
Environmental Sciences, 3(6), 1980–2009.
https://doi.org/10.6088/ijes.2013030600019
Boyd, C. E. (1990). Water Quality in Ponds for Aquaculture
(2nd, illustr ed.). Auburn University, Alabama Agricultural Experiment Station.
Chattopadhyay, G. N., Saha, P. K., Ghosh, A., & Karmakar,
H. C. (1988). A Study on O p t i m u m B O D Levels for Fish Culture in W a
s t e w a t e r Ponds. 25, 79–85.
Claude E. Boyd, P. . (2015). Calcium and magnesium use in
aquaculture « Global Aquaculture Advocate. 2022.
https://www.aquaculturealliance.org/advocate/calcium-and-magnesium-use-in-aquaculture/
Clean Water Team (CWT). (2004). Dissolved Oxygen Fact,
SheetFS-3.1.1.0(DO). The Clean Water Team Guidance Compendium for Watershed
Monitoring and Assessment, 2, 1–5.
Crosby, D., Specialist, E., & Health, F. (n.d.). Hardness
- Calcium.
CUMINGS, J. N. (1962). Biochemical aspects. In Proceedings
of the Royal Society of Medicine (Vol. 55). https://doi.org/10.5005/jp/books/11431_8
Das, B. (n.d.). No Title. Fisheries and Fisheries
Resources Management. Bangla Academy, Dhaka, Bangladesh, 153-155p.
Day, I., & Biodiversity, F. O. R. (2016). Secretariat of
the Convention on Biological Diversity (CBD). International Regulatory
Co-Operation, May 2007, 116–117.
https://doi.org/10.1787/9789264244047-18-en
DoE Standards. (2004). The People’s Republic of
Bangladesh.
DoF. (2018). Fisheries statistics of Bangladesh 2017-2018. Fisheries
Resources Survey System (FRSS), Department of Fisheries. Bangladesh: Ministry
of Fisheries., 35, 129. http://www.fisheries.gov.bd
Ehiagbonare, J. E., & Ogunrinde, Y. O. (2010).
Physico-chemical analysis of fish pond water in Okada and its environs,
Nigeria. African Journal of Biotechnology, 9(36), 5922–5928.
Emerson, S., Mecking, S., & Abell, J. (2001). The
biological pump in subtropical North Pacific Ocean: Nutrient sources, Redfield
ratios, and recent changes. Global Biogeochemical Cycles, 15(3),
535–554. https://doi.org/10.1029/2000GB001320
F, O. O., & O, O. O. (2017). Physicochemical Properties
of Two Fish Ponds in Akure, Implications for Artificial Fish Culture. International
Journal of Environment, Agriculture and Biotechnology, 2(2),
977–982. https://doi.org/10.22161/ijeab/2.2.54
Hem, J. D. (1985). Study and Interpretation of the
Chemical Characteristics of Natural Water (U. S. G. S. Department of the
Interior (Ed.); Volume 225).
Hunt, M., Herron, E., & Green, L. (2012). Chlorides in
Fresh Water. Uriww 4, 1–4. www.uri.edu/ce/wq/ww
James, M. E. 2000. W. Q. and R., Systems, A. S. A.,
Technologies, LLC. New Orleans, L. 16-, & 17p, 28p. (n.d.). No Title.
Jonassen, T. M., Imsland, A. K., & Stefansson, S. O.
(1999). The interaction of temperature and fish size on growth of juvenile
halibut. Journal of Fish Biology, 54(3), 556–572.
https://doi.org/10.1111/j.1095-8649.1999.tb00635.x
Keremah, R. ., Davies, O. ., & Abezi, I. . (2014).
Physico-Chemical Analysis of Fish Pond Water in Freshwater Areas of Bayelsa
State, Nigeria. Greener Journal of Biological Sciences, 4(2),
033–038. https://doi.org/10.15580/gjbs.2014.2.042313583
Kumar, D. G., Karthik, M., & Rajakumar, R. (2017). Study
of seasonal water quality assessment and fish pond conservation in Thanjavur,
Tamil Nadu, India. Journal of Entomology and Zoology Studies, 5(4),
1232–1238.
Lasienė, K., Straukas, D., Vitkus, A., &
Juodžiukynienė, N. (2016). The influence of copper sulphate pentahydrate
(CuSO4·5H2O) on the embryo development in the guppies (Poecilia reticulata). Italian
Journal of Animal Science, 15(3), 529–535.
https://doi.org/10.1080/1828051X.2016.1209990
Makori, A. J., Abuom, P. O., Kapiyo, R., Anyona, D. N., &
Dida, G. O. (2017). Effects of water physico-chemical parameters on tilapia
(Oreochromis niloticus) growth in earthen ponds in Teso North Sub-County, Busia
County. Fisheries and Aquatic Sciences, 20(1), 1–10.
https://doi.org/10.1186/s41240-017-0075-7
Munni, M., Fardus, Z., Mia, M., & Afrin, R. (2015).
Assessment of Pond Water Quality for Fish Culture: A Case Study of Santosh
Region in Tangail, Bangladesh. Journal of Environmental Science and Natural
Resources, 6(2), 157–162. https://doi.org/10.3329/jesnr.v6i2.22112
Rukhsana, R., Rashid, S., Fatima, A., Khan, O. I., Shah, S.
B. H., Ali, M., & Abbas, G. (2021). The Status of Water Quality in Various
Fish and Shrimp Farms of Sindh Province, Pakistan: Abundance of Planktonic
Biomass in Relation to Physicochemical Properties of Pond Water. Sarhad
Journal of Agriculture, 37(3), 847–857.
https://doi.org/10.17582/JOURNAL.SJA/2021/37.3.847.857
Saha, S., Mandal, A., & Sahoo, D. (2017). Study of
physico-chemical parameters of three different urban pond water of Nadia
district , West-. International Journal of Fisheries and Aquatic Studies,
5(6), 23–27.
Sallenave, R. (2012). Understanding Water Quality Parameters
to Better Manage Your Pond. College of Agricultural, Consumer and
Environmental Sciences, New Mexico State University, Guide W-10,
4. https://aces.nmsu.edu/pubs/_w/W104.pdf
Shamsuzzaman, M. M., Hoque Mozumder, M. M., Mitu, S. J.,
Ahamad, A. F., & Bhyuian, M. S. (2020). The economic contribution of fish
and fish trade in Bangladesh. Aquaculture and Fisheries, 5(4),
174–181. https://doi.org/10.1016/j.aaf.2020.01.001
Silapajarn, K., Boyd, C. E., & Silapajarn, O. (2004). Physical
and Chemical Characteristics of Pond Water and Bottom Soil in Channel Catfish
Ponds in West-Central Alabama. 46. www.auburn.edu
Singh, B. P., & Kumar, Y. (2016). Physico-Chemical
Characteristic of Hindon River , Uttar Pradesh. Journal of Environmental
Science, Toxicology and Food Technology, 10(12), 35–38.
https://doi.org/10.9790/2402-1012043538
Sink, T., Specialist, E. F., & House, M. (n.d.). AgriLife
Extension Solutions AgriLife Extension Solutions.
T.V.R. Pillay, H. P. (1992). Aquaculture and the
Environment. an Imprint of John Wiley & Sons, 605 Third Ave., New York,
NY 10158.
TODD, D. K. (1980). Groundwater Hydrology (T. J. W.
New York, Chichester, Brisbane (Ed.); 2nd editio). John Wiley.