Smoothies
with improved sensory characteristics and microbial quality were developed
by blending watermelon-pineapple and sweet melon – cucumber. The fruits were
sorted, washed thoroughly with clean water, peeled, sliced and diced into
small cubes and blended. Smoothies from blends of
watermelon – pineapple (WMP) and sweet melon – cucumber (SMC) were formulated.
The samples were blended in different ratios: watermelon- pineapple control
(WMPC-100%), watermelon-pineapple (90:10WMP1), (80:20%WMP2), (70:30%-WMP3),
(60:40% WMP4) and (50:50%-WMP5), and the same ratios were also used for
sweet melon-cucumber blends respectively. The samples were analysed for
organoleptic properties and microbial quality. Significant (p>0.05)
differences did not exist in sensory evaluation between blends; but within
samples. The result fororganoleptic
propertiesbased on blend ratios for
watermelon-pineapple and sweet melon –cucumber in relation to the parameters
assessed, for aroma, colour, taste, flavor and
general acceptability showed that samples WMP3(70:30), WMP2 (80:20%)and SMC2 (80:20%) were the most preferred.
Microbial count result for watermelon-pineapple sample for total bacterial
cells, total coliform and fungi count ranged from; 1.5x10⁴ to 8.2x10³,
1.5x10³ to 6.4x10³ and 1.1x10⁴ to 9.2x10³ cfu/ml and for sweet melon-cucumber sample, the
count ranged from 1.5x10⁴ to 9.1x10⁵, 1.0x10⁶ to 9.6x10³ and 1.8x10⁵
to7.9x103cfu/ml. The biochemical test revealed some microbial floral such as
Bacillus, Salmonella spp, Klebsiellaspp, E.coli, and
Staphylococcus aureus. The overall sensory scores
for smoothies containing i) watermelon-pineapple
and ii) sweet melon- cucumber was very good (8.0 & 7.0) respectively.
With good manufacturing practices safe smoothie
beverages prepared and consumed regularly can assist in the enhancement and
sustainability of household food and nutrition security.
Fruits are
excellent sources of phytochemicals which are essential for human health and
relished by consumers in all seasons. The perishable nature of fruits and
vegetables leads to higher pre- and post- harvest losses during distribution
and processing. Fruits high in acidity content and astringency have a limited
scope for table consumption though they are rich in functional ingredients.
Combination of two or more fruits and vegetables will develop novel flavour and taste, which help in consumer acceptance.
Presently, blended beverages are available in different flavours
such as strawberry, chocolate, banana, vanilla, mango, raspberry, orange, etc.
Smoothie is
a thick beverage product prepared from raw fruit pulps and/or the blends.
Smoothies may include other ingredients such as vegetables, water, crushed ice,
fruit juice, sweeteners (such as honey, sugar, syrup), dairy products (such as
milk, yoghurt, low fat or cottage cheese, whey powder), plant milk (such as
coconut milk, tiger nut milk, almond nut milk, soy milk), seeds (such as celery
seeds), spices (such as ginger, garlic), tea, chocolate, herbal supplements or
nutritional supplements (Zavasta, 2009). Some
commercial smoothies, however, have added sugar, in order to increase
sweetness. In some developing countries like Nigeria, smoothies are commonly
prepared on demand and sold in big shops, hotels and other relaxation spots and
might depend on the combination of fruits. Recently, smoothie products have been
made more convenient in that consumers can carry the product out of the
point-of-purchase in packaging materials. A healthy diet should compose of an
appreciable quantity of fruits and vegetables, and regular consumption of
sufficient amounts to avert major chronic diseases (Maksuda,
et. al., 2016). Pineapple (Ananascomosus) has
an outstanding juiciness and strong flavour that
balances the taste of sweet and tart. Pineapples are also very rich source of
bioactive compound known as bromelain, which is associated
with many health benefits (Walker, et al.,
2002). Water lemon (Citrullus vulgaris)
is an excellent source of pro-vitamin A and other phytochemicals such as
lycopene, beta-carotene, lutein and zeaxanthin (Charoensiri, et. al.,
2009 and Edwards, et. al., 2003).
Cucumbers contain 95 percent water." This makes cucumbers a great way to
stay hydrated.Cucumber-based beverages
are taking part in balancing electrolyte levels, in case of dehydration.
Cucumbers contain several antioxidants, including vitamin C, beta carotene and
as well as flavonoids, triterpenes and lignans that have anti-inflammatory properties. The
anti-inflammatory compounds in cucumbers help remove waste from the body and
also reduce skin irritation.
In recent
studies, smoothies (a form of ready-to-drink beverage) have become one of
consumers’ preferred choices of drink, with suitable sensory properties in
combination with nutritional benefits (Anon 2009 and Bordia, 2010). Researchers
focused on developing different types of fruit-based smooth beverages/vegetable
purees or smoothies made from a combination of fruits and/or vegetables to
increase their contemporary value, nutritional content, and shelf life, without
altering their sensory attributes (Keenan, et
al;2010; Koutidou, et al; 2017). Therefore, this study aimed at the development of new
smoothie formulations using watermelon, pineapple, sweet melon and cucumber as
well as to investigate sensory characteristic and microbial quality of the
obtained products.
2.0MATERIALS AND METHODS
2.1Raw
materials and sources
The raw materials used in this study were
water melon, pineapple, sweet melon and cucumber. They were purchased from the
railway fruit market Makurdi, Benue State, Nigeria,
andconveyed to the Department of Food
Science and Technology, Federal University Wukari,
laboratory where all the analyses were carried out.
2.2Experimental design
The experiments were carried out based on
completely randomized design (Bower, 2013) to obtain seven samples as shown in
table 2.1 and 2.2
2.3Sample preparation
2.3.1Production of water melon-pineapple
smoothie
Water melon-pineapple smoothie was produced as described
in Figure 2.1. The fresh fruits of watermelon and pineapple were sorted,
thoroughly washed with tap water and peeled with sterile knife and diced. The
diced fruits were weighed on an electronic weighing scale and combined using
the blending ratio of table (2.1) and then frozen to get a thicker and cold
smoothie then blended together using an electric blender. Blending and
homogenization took place within 3-5 minute.
2.4 The blending formulation on
watermelon-pineapple and sweet melon-cucumber smoothie
Table 2.1: blending formulation on watermelon-pineapple
smoothie.
Table 2.2: blending formulation on sweet melon-cucumber
smoothie.
sample code
%sweet melon
%cucumber
SMC
100
0
CUC
100
0
SMC1
90
10
SMC2
80
20
SMC3
70
30
SMC4
60
40
SMC5
50
50
KEY: SMC=sweet melon control (100), CUC=cucumber
control (100), SMC1 = sweet melon-cucumber (90:10), SMC2 = sweet melon-cucumber
(80:20),
SMC3 = sweet melon-cucumber (70:30),
SMC4 = sweet melon-cucmber
(60:40),
SMC5 = sweet melon-cucumber (50:50).
Fig 2.1: Flowchart for
the production of water melon and pineapple smoothie
Source: (Victor-Aduloju et al; 2020).
2.5. Production of sweet
melon and cucumber smoothie
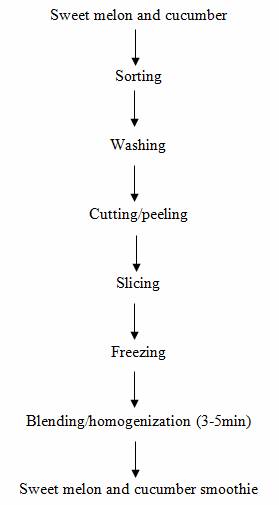
Sweet melon and cucumber smoothie was
produced as described in Figure 2.2. The sweet melon and cucumber was sorted
and thoroughly washed with running tap water and 0.5g sodium chloride (Nacl) to remove moldy and contaminating microorganisms.
Using a sterile knife, the sweet melon was cut and peeled neatly, the cucumber
was sliced leaving the peels on to give the smoothie a brighter green color and
more nutrients. The sliced sweet melon and cucumber was frozen to give a
thicker texture without losing any flavor. The ingredients were blended using
the ratio according to table 2.1, in an electric blender. Blending was done for
3-5min.
Fig 2.2: Flowchart for the production of sweet melon and
cucumber smoothie
2.6.1 Determination of pH, Titratable Acidity, Sugar
Content and Total soluble Solids (TSS) of the Smoothie Samples
The pH and titratable
acidity of the samples were determined using (AOAC, 2010) method. Sugar content
(°Brix) was determined using a hand refractometer at
20 °C according to the method of (AOAC, 2010) and the value obtained from the
reference to standard table expressed as percentage sucrose by weight (°Brix). Total
soluble solid was expressed as % Total solids ¼ (W2 x 100)/W1¼ (100 - % moisture) as described by (AOAC, 2010).Where, W1: Initial weight; W2: Dried weight.
2.7 Microbiological
Analysis
2.7.1 Isolation and
Enumeration
Total viable bacterial cells were determined
using the method as described by (Obasi et.al; 2019).
Serial dilution (10 fold) was carried out (1:10, 1: 100, 1:1000…10,0000). 0.1ml of appropriate dilutions (10-2 and
10-4) was placed on various agar plates using pour plate method and
incubated at 37⁰C for 18-24 hours for total aerobic bacteria and coliform
count. For fungi 0.1ml amount of appropriate dilutions (10-2 and 10-4)
was poured into the plates of potato dextrose agar and incubated at room
temperature at 28±1⁰C for 3 to 5 days. All enumeration were
expressed as colony forming unit (cfu/ml).
2.7.2Purification and Maintenance of Microbial
Isolate
Bacteria isolates were transferred into fresh
agar medium of isolation and incubated at 37⁰C for
24hours. Pure colonies of bacteria were maintained and stored at 4⁰C until needed.
2.7.3 Identification and Characterisation
of the Isolates
Bacteria isolates were identified and
characterized based on their morphology, structures, cell shape and appearance,
and biochemical tests as described by (Cheebrough, 2006;
Obasi et.al; 2019). Biochemical Tests determined
included- Catalase,
Oxidase ,Indole , Triple Sugar Ion (TSI) , Citrate Utilization Test
etc.
2.8. Sensory Evaluation of the Smoothie Samples
Sensory evaluation was carried out on all the
samples using the method as described by (Sukanya and
Michael, 2014). The samples were coded and served to 15 - man semi-trained
panelists consisting of students and staff from the Department of Food Science
and Technology, Federal University Wukari, Taraba State. The panelists were asked to evaluate the
samples forflavor, color, aroma, taste, and overall acceptability using a 9-point Hedonic scale, where “9”
represented extremely liked and “1” represented extremely disliked. The order of presentation of the samples was
randomized. Table water was presented to the panelists to rinse their mouth
in-between sample testing.
2.9 Statistical Analysis
The data
collected were subjected to analysis of variance in completely randomized
design using the statistical package for Social Sciences Version 17.0. Means
were separated using Duncan’s multiple range test with significance accepted at
p<0.05 (Bower, 2013).
3.1.1Physicochemical Composition of
Watermelon-Pineapple Smoothie
The physicochemical
composition of the watermelon-pineapple smoothie blend presented in Table 3.1a
showed results for pH ranging from 3.71 to 4.62, titratable
acidity ranging from 2.70 to 10.50g/l, total soluble solid ranging from 0.72 to
2.96 and ˚Brix 5.00 to 14.50 respectively. The
pH of the smoothie blend ranged from 4.04 to 4.62, with sample WMP1 (90:10)
having the lowest and WMP5 (50:50) having the highest value. The result
obtained from this study agrees with Alake et
al. (2022) who had similar result. According to literature, pH range of
ripe fruits is between 4.5 and 5.35, which is slightly acidic (Gbarakoro, 2021), based on their values, the results from
this study fall within the range. The results obtained showed slight
significant difference (p < 0.05) for all the samples. Total titratable acid is used to determine the acid content or
serves as a measurement for determining the acid content of food such as
fruits.The total titratable acidity
(TTA) of the smoothie blend ranged from 2.70 to 8.10, with sample WMP5 (50:50)
having the lowest value and WMP1 (90:10) having the highest value. The results
obtained from this study were higher than the result obtained by (Uzodinma, et al; 2020)
who obtained very low result from a similar study which also involved the
inclusion of water melon. The higher titrable acidity
values obtained in this work compared favorably with the study done by (Chaudhary, and Shanta, 2015), who
also reported higher value for TTA. The total soluble solids (TSS) for the
smoothie blend ranged from 1.19 to 2.96 with sample WMP5 having the lowest
values and WMP1 having the highest value. Total soluble solids (TSS) are
important quality indicators that relate to sweetness, often referred to as
sugar index (Balaswamy, 2011).
The results
showed a significant difference (p < 0.05) among the samples. The ˚brix
for the smoothie blend ranged from 4.73 to 8.50 with WMP1 (90:10) having lowest
value and WMP5 (50:50) having the highest value. The brix content obtained in
this study was similar to those obtained for fruit pulps/juices as reported by
(Balaswamy, 2013), especially for the major samples
used in this study pineapple. The brix indicate the degree of sweetness and the
presence of the sugar present in the fruit (Balaswamy,
2011). The result showed significant difference (p < 0.05) for all the
samples in this study.
Table 3.1a:
Physicochemical Composition of Watermelon-Pineapple Smoothie
Sample code
pH
TTA
TSS
˚BRIX
WMC
3.71c±0.01
10.50a±0.14
2.02c±0.01
5.00d±1.41
PSC
4.55a±0.36
4.05e±0.07
0.72e±0.12
14.50a±0.71
WMP1
4.04bc±0.19
8.10b±0.14
2.96a±0.04
4.73d±0.39
WMP2
4.16abc±0.23
4.80c±0.14
2.62b±0.02
5.75cd±0.35
WMP3
4.21ab±0.13
4.46d±0.20
1.30d±0.18
7.50bc±0.71
WMP4
4.29ab±0.01
4.10e±0.14
1.21d±0.01
7.50bc±0.71
WMP5
4.62a±0.02
2.70f±0.14
1.19d±0.01
8.50b±0.71
Values are mean ± standard deviation of the
physiochemical composition. Means within each column not followed by the same
superscript are significantly different (p ≤ 0.05) from each other using
Duncan multiple range test.
3.1.2Physicochemical
Composition of Sweet Melon-Cucumber Smoothie
The
physicochemical composition of the sweet melon-cucumber smoothie blend
presented in Table 3.2b showed results for pH ranging from 3.31 to 5.17, titratable acidity ranging from 0.81 to 10.58g/l, total
soluble solid ranging from 1.47 to 3.74 and °Brix 2.25 to 5.23
respectively.
The pH value
indicates the acidic or basic content of a particular substrate, the pH ranged
from 3.31 to 4.19, with sample SMC5 (50:50) having the lowest pH value and SMC1
(90:10) having the highest pH value. The results obtained showed significant
difference (p < 0.05) among the samples. Similar pH ranges from 6.75-0.15
were obtained in the work done by (Balaswamy, 2021]
that developed smoothies from selected fruit pulps/ juices. By the addition of
cucumber to the sweet melon, it reduced the acidic content of the smoothie as
shown in Table 3.2b. The total titratable acidity
(TTA) of the smoothie blend ranged from 7.47 to 10.58, with sample SMC1 (90:10)
having the lowest value and sample SMC5 (50:50) having the highest value which
is in agreement with the work of (Balaswamy, 2021)who obtained low acidity for fruit
pulps/juices for sweet melon as observed also in this study. The results showed
significant difference (p < 0.05) among the samples. TSS for SMC blends
ranged from 1.79 to 2.84 where SMC5 (50:50) had the lowest value and SMC1
(90:10) had the highest value. The results showed a significant difference (p
< 0.05). The ˚brix for the smoothie blends ranged from 3.50 to 5.23.
Where sample SMC5 (50:50) had the lowest value and sample SMC1 (90:10) had the
highest value. The brix indicates the degree of sweetness and the presence of
the sugar in the fruit. Sweet melon generally has more (content) natural sugar
when compared to cucumber and the result obtained in this study for sample SMC1
(5.23) compared favourably with the report of (Balaswamy, 2021) who obtained a value of 5.93 for fruit pulps/juices
from sweet melon sample.
Table 3.2b:
Physicochemical Composition of Sweet Melon-Cucumber Smoothie
Sample
pH
TTA
TSS
BRIX
SMC
5.17a±0.01
0.81f±0.01
3.74a±0.01
4.25a±1.06
CUC
3.59bc±0.02
6.79e±0.01
1.47g±0.01
2.25 a±1.06
SMC1
4.19b±0.69
7.47d±0.02
2.84b±0.01
5.23 a±1.09
SMC2
3.47c±0.04
8.81c±0.01
2.74c±0.01
5.00 a±1.41
SMC3
3.41c±0.01
9.38b±0.04
2.68d±0.04
5.00 a±1.41
SMC4
3.41c±0.01
9.41b±0.01
2.15e±0.01
4.00 a±1.41
SMC5
3.31c±0.02
10.58a±0.04
1.79f±0.02
3.50 a±0.70
Values are mean ± standard deviation of the
physiochemical composition. Means within each column not followed by the same
superscript are significantly different (p ≤ 0.05) from each other using
Duncan multiple range test.
3.2.1Sensory
evaluation for watermelon-pineapple smoothie
A sensory evaluation aims at measuring
consumer’s sensory perception of products as well as the effective, emotional
responses that arise from this perception (Delarue,
2022). The result presented in Table 3.3a shows the sensory evaluation of
watermelon-pineapple smoothie.
Taste ranged
from 6.47-7.60. The highest value was WMP3 (7.60) followed by WMP5 (7.27) and
the least value recorded was WMP4 (6.47). The high rating of taste for WMP3
could be as a result of the substitution of pineapple. The result obtained from
this study is similar to the findings of Teleszko and
Wojdyło, (2014) and Nowickaet al., (2016) where sweeter products
were more accepted when compared to other less sweet samples (varied ratio) and
this is because pineapple have more sugar in the base of the fruit.
The values
for aroma ranged from 6.67 to 7.33. Based on the samples analyzed, the lowest
value was WMP1 (6.67) and the highest values were obtained from samples WMP2,
WMP3 and WMP5 (7.33) respectively having the highest rated aroma value which
may be because pineapple has an outstanding juiciness and strong flavour that balances the taste of sweet and tart.
Pineapples are also very rich source of bioactive compound known as bromelain, which is associated with many health benefits
(Walker et al. 2002, in Uzodinmaet al.,
2020). The results were not significantly different (p < 0.05).
The ratings
for color by the panelists ranged from 7.07 to 7.40. The highest rating for colour was sample WMP1 (7.40) for the varied samples while
WMP4 (7.07) had the least value. The control sample PSC (7.93) was the most
appealing by the panelist because generally, pineapple has an acceptable colour used in liquid beverage such as juice as a result of
the presence of (lycopene) alpha-carotenoid Uzodinma,
(2020). The results were not significantly different (p < 0.05).
The general
acceptability of watermelon-pineapple smoothie showed that sample WMP2 (7.73)
was most preferred by consumer followed by WMP5 (7.33), WMP1 (7.07), WMP3 (7.07)
and the least was WMP4 (6.60) respectively. There was a significant difference
(p < 0.05) between the samples.
TABLE 3.3a: Mean Sensory Score of Watermelon-Pineapple
Smoothie
Sample
Code
Taste
Aroma
Colour
Flavor
General
Acceptability
WMC
6.87a±1.51
6.93a±1.53
7.80a±1.21
7.00a±1.36
7.47ab±1.25
PSC
7.27a±1.95
7.60a±1.12
7.93a±1.28
7.07a±1.27
7.89a±1.19
WMP1
7.00a±1.51
6.67a±1.35
7.40a±1.50
6.73a±1.49
7.07ab±1.49
WMP2
7.00a±1.07
7.33a±1.05
7.33a±1.23
7.27a±0.90
7.73a±0.96
WMP3
7.60a±1.12
7.33a±1.04
7.33a±1.40
6.93a±1.49
7.07ab±1.44
WMP4
6.47a±0.99
6.73a±1.22
7.07a±1.22
6.93a±1.44
6.60b±0.91
WMP5
7.27a±1.16
7.33a±1.23
7.33a±0.90
7.13a±1.30
7.33ab±0.81
Values are mean ± standard deviation of 15
panelists. Means within each column not followed by the same superscript are
significantly different (p < 0.05) from each other using Duncan multiple
range test.
3.2.2 Sensory
evaluation for sweet melon-cucumber smoothie
The
result of the sensory rating for the smoothie blend of sweet melon-cucumber is
shown in the Table 4.4b. Taste ranged from 5.67 to 7.33. The highest rating by
the panelist was recorded for sample SMC2 (7.33) and the least value was for
sample SMC4 (5.67). The result obtained from this study in terms of taste is in
agreement with the work done by Balaswamy, et al., (2013) who had a similar result (7.8). The result showedsignificant
difference (p < 0.05).
Sweet melon
is largely sought for due to its sweet refreshing fruit Harini
and Nithyalakshmi. (2017). Also, Allwoodet al., (2014) reported that the
flavor and aroma of the fruit is dictated by the amount of volatile organic
compounds present in it. Aroma ranged from 5.93 to 6.73. SMC5 had the highest
value and sample SMC4 had the lowest. The result showed a significant
difference (p < 0.05).Colour ranged from 5.86 to 6.93. Sample SMC4 had the lowest
value and sample SMC1 had the highest compared to other samples. The
result is not significantly different (p < 0.05). Flavour
ranged from 5.80 to 6.80. Sample SMC5 had the lowest and SMC2 had
highest value. The flavour of food ultimately determines its acceptance
or rejection even though its appearance may evoke initial response Ojinnaka and Nnorom, (2015).
The results were not significantly different (p < 0.05).
The general
acceptability of the control (SMC) is expected and might be due to higher
sweetness as indicated by the ºbrix value. Based on the various blends sample
SMC2 (7.00) was the most preferred in relation to all the parameters assessed.
The result was not significantly different (p < 0.05).
TABLE 3.3b: Mean Sensory Score of Sweet melon-Cucumber
Smoothie
Sample
Code
Taste
Aroma
Colour
Flavor
General
Acceptability
SMC
7.07a±2.60
7.60a±1.12
7.07a±2.02
6.87a±2.03
7.33a±1.91
CUC
6.27ab±1.94
6.73ab±1.62
6.20a±1.57
5.80a±1.70
6.33a±1.88
SMC1
7.07a±1.44
6.60ab±1.35
6.93a±0.96
6.67a±1.59
6.93a±1.49
SMC2
7.33a±1.05
6.60ab±1.50
6.80a±1.01
6.80a±1.78
7.00a±1.25
SMC3
6.13ab±1.13
6.53ab±1.13
6.33a±1.63
6.07a±1.49
6.53a±1.13
SMC4
5.67b±1.29
5.93b±1.39
5.86a±1.64
6.00a±1.36
6.20a±1.26
SMC5
6.33ab±1.84
6.73ab±1.33
6.13a±1.88
5.80a±1.52
6.33a±1.80
Values are mean ± standard deviation of 15 panelists.
Means within each column not followed by the same superscript are significantly
different (P < 0.05) from each other using Duncan multiple range test.
3.3.1Total
aerobic plate count (TAPC) of bacterial cells (cfu/ml) for watermelon-pineapple smoothie
The
result presented in table 3.4a showed the total aerobic plate count (TAPC) of
the bacterial cells, coliform and fungi counts for the watermelon-pineapple
smoothie. The total bacteria cells,coliform and fungi count(cfu/ml) for samples
analyzed at different ratios included watermelon control (WMC:100%), pineapple smoothie
control (PSC:100%), watermelon pineapple (WMP:90:10, 80:20, 70:30, 60:40 and
50:50%) ranged from 1.5x10⁴ - 8.2x10³
,1.5x103
-6.4x10³ ,1.1x104
-9.2x10³cfu/ml respectively.
The total bacteria count for all the samples were within the maximum acceptable level for any fruit
juice as listed in the microbiological criteria for foodstuffs by Gulf
Standards (2000) which is 1.0 × 10⁴ cfu/
ml.Generally smoothie production which do undergo pasteurization have been
reported to have a total bacterial count above 102 margin by Uzodinmaet al.,
(2020). However, the results obtained from this study did not surpass the
Commission Regulation (EC) No. 2073/2005 on microbiological criteria for
foodstuffs for unpasteurized fruits and vegetable juices (ready-to-eat).
The coliform
count ranged from 1.5x10³
to 6.4x10³cfu/ml
with
sample WMP5 (50:50) having a higher count which could
be as a result of non-pasteurization. The high coliform count did not exceed 1000 cfu/ml of the
sample since it is within the maximum acceptable level for any fruit smoothie
(Gulf Standards 2000; Anon, 2005).
The fungi
count ranged from 1.1x10⁴
to 9.2x10³cfu/ml
with sample WMP3 (70:30) having highest count of which agrees with the food safety and
standard authority for microbial limit for fruit juice and fruit nectar FSSAI,
(2011).
Table 3.4a: Total aerobic
plate count (TAPC) of bacterial cells (cfu/ml)
obtained from watermelon-pineapple Smoothie
3.3.2Total
aerobic plate Count (TAPC) of bacterial cells (cfu/ml)
for sweet melon-cucumber smoothie
The
result presented in table 3.4b showed the total aerobic plate count (TAPC) of
the bacterial cells, coliform and fungi counts for the sweet melon-cucumber
smoothie. The total bacteria cells,coliform and fungi count (cfu/ml) for samples
analyzed at different ratios include sweet melon control (SMC:100%), cucumber-smoothie
control (CUC:100%), sweetmelon-cucumber (SMC:90:10, 80:20,
70:30, 60:40 and 50:50%) ranged from 1.2x10⁴ to 8.0x10³
for total bacterial count, 1.3x10⁴
to7.0x105 coliform count and fungi count 1.8x10⁵
to 7.9x10³ respectively.
The total bacterial count did not surpass the Commission Regulation (EC) No.
2073/2005. The counts were below the maximum acceptable level for any fruit
juice/smoothie as listed in the microbiological criteria for foodstuffs by Gulf
Standards (2000) which is 1.0 × 10⁴ cfu/
ml. for all the samples assessed.
The coliform
count ranged from 1.3
x104 to 9.6x10³cfu/ml. Sample SMC5 (50:50), SMC4 and SMC1 were within the
acceptable limit for coliform count in any microbiological criteria for
juices and smoothies. Sample SMC3
was above the acceptable limit for coliform count, but SMC2 had no growth.
The fungi
count ranged from 1.8x10⁵
to 7.9x10³cfu/ml. The total fungi
count of the non-pasteurized smoothies did not exceed the maximum acceptable
level for any fruit juice as listed in the microbiological criteria for
foodstuffs by (Gulf Standards 2000 and Uzodinmaet al., (2020).
Table 3.4b Total aerobic plate count (TAPC)
of Bacterial Cells (Cfu/ml) obtained from sweet
melon-cucumber smoothie
3.3.3Morphological and Biochemical
Characteristics of Bacterial Strains Isolated from Watermelon-Pineapple and Sweet Melon-Cucumber Smoothie Blends
The microbial flora for watermelon-pineapple
and sweet melon-cucumber smoothies as shown in Figure 3.1 and
3.2.Watermelon-pineapple isolate revealed the following species Salmonella spp
12.96%, Klebsiella pneumonia 12.96%, Staphylococcus aureus 12.96%, E.coli 11.11%, Enterobacteriaceae11.11%, Proteus vulgaris 9.255, Pseudomonas
spp7.40%, Klebsiellaspp7.40%, Micrococcus 5.56% and Bacillus
3.70%, while sweet melon-cucumber showed the species of the microbial flora
which includes Salmonella spp12.19%, Klebsiella pneumonia
14.63%, Staphylococcus aureus17.07%, E.coli 17.07%, Enterobacteriaceae 17.07%, Proteus vulgaris 7.31%, Klebsiellaspp7.31%, Bacillus 4.87% and Shigella2.43% respectively.
The presence
of pathogenic Escherichia coli, and Staphylococcus
aureus usually constitute a direct proof of faecal contamination of irrigation water (Cheesbrough, 2006). The identified non-lactic acid bacteria
(E. coli, Bacillus species and Proteus species) reported in this study
has also been reported by other authors (Onovo et al., 2007).The Enterobacteriaceaefamily mostly involves harmless bacteria, some of them
contribute to food spoilage or exist as foodborne pathogens (Edelstein,
2014).The bacterial contamination of
plant origin in food as revealed in this study may occur through fertilizers
with animal manure, soil, and irrigation water, as well as washing, handling,
and processing vegetables or fruit during the postharvest period (Berger et al., 2010) (Seo
and Matthews2014).
Fig 3.1: Prevalence of microorganisms isolated from
watermelon-pineapple smoothie blends
Fig 3.2: Prevalence of microorganisms isolated from sweet
melon-cucumber smoothie blends
4.0CONCLUSION AND RECOMMENDATION
Smoothies could be prepared and preserved by
blending various tropical fruits and vegetables without any addition of
external sweetener. Smoothies based on fruits and vegetables viz., blends of
watermelon-pineapple and sweet melon-cucumber in this study were organoleptically acceptable. Smoothies containing:
watermelon-pineapple (WMP) and sweet melon-cucumber (SMC), WMP1: (90:10%),
WMP2:(80:20%), WMP3 and (70:30%) and
SMC1: (90:10), SMC2: (80:20), SMC3: (70:30) respectively were found to be best
combinations in terms of sensory score (˃7.0). A variety of smoothies can
be prepared depending on availability of seasonal fruits/vegetables leading to
new product development. The microbial counts since it was not above the
allowable limit by Commission Regulation (EC) No. 2073, may not pose any threat
to the health and safety of consumers.
Disclosure
of conflict of interest
No conflict of interest to disclose.
REFERENCES
Alake, O.T., Abraham, D.O., Akinola,
T.O., Fatunmibi, O.O., Agboola,
T.O., & Akua, S.I. (2022). Production and
evaluation of smoothies made from various fruits sold in Lagos market. International Journal of Innovative Science and Research
Technology, 7(1), 642-646.
Allwood JW, Cheung W, Xu Y, Mumm R, De Vos RC, Deborde C, Biais B, Maucourt M, Berger Y, Schaffer AA, Rolin
D, Moing A, Hall RD, Goodacre
R. Metabolomics in melon: A new opportunity for arome
analysis. Phytochemistry.2014; 99: 61-72.
AOAC (2010).Official
Methods of Analysis.Association of Official Analytical Chemists (18th eds.),
Washington D. C., United States of America.
AOAC Association of Official Analytical Chemist (2005).Official Methods of Analysis of AOAC International.18th ed.
(AOAC-925.10), (AOAC-2003.05), (AOAC-923.03), (AOAC-960.52) (Nx6.25).
AOAC International, Maryland, USA.111-333
Balaswamy, K., PrabhakaraRao, P. G., Nagender, A. and Satyanarayana,
A. 2011.Preparation of sour grape (Vitisvinifera)
beverages and evaluation of their storage stability.Journal
of Food Processing and Technology 2:3 http://dx.doi.org/10.4172/2157-
7110.1000116.
Balaswamy, K., Prabhakara, R. P.
G., Nagender, A., Narsing,
R. G., Sathiya, M. K., Jyothirmayi,
T., Math, R. G. and Satyanarayana, A. (2013).
Development of smoothies from selected fruit
pulps/juices. International Food Research
Journal, 20 (3): 1181-1185
Bower, J. A. (2013).Statistical
Methods for Food Science: Introductory Procedures
for the Food Practitioner, 2nd edition. Wiley Blackwell,
United Kingdom. pp. 165-170.
Charoensiri, R.,
Kongkachiuchai, R., Suknicom,
S. and Sungpuang, P. (2009).Beta-carotene, lycopene alpha-tocopherol
contents of selected Thai fruits.Food Chemistry, 113:202-207.
Chaudhary, P. S.
and Shanta, P. (2015).Development
of smoothies from banana pulp and orange juice.International Journal of Applied Research, 1 (9): 261-263.
Cheesbrough M. (2006). District
Laboratory Practice in Tropical Countries, Part 2. London: Cambridge
University Press, UK; 22-31
Edelstein,
M.; Sundborger, C.; Hergens,
M.P.; Ivarsson, S.; Dryselius,
R.; Insulander, M.; Jernberg,
C.; Hutin, Y.; Wallensten,
A. (2014) Barriers to Trace-back in a Salad-associated EHEC Outbreak, Sweden,
June 2013. PLoS Current. 6, 1–18.
Edwards,
A. J., Vinyard, B. T. and Wiley, E. R. (2003).
Consumption of watermelon juice increases plasma concentrations of lycopene and
beta-carotene in humans. Journal of Nutrition, 133 (4): 1043-1050.
Food Safety and Standards (Licensing and Registration of
Food businesses) Regulation, 2011.
Gbarakoro, S.L.,
Adooh, L.S.K., & Akinfolarin,
O.M. (2021).Effects of natural and artificial fruits
ripening agent on the pH of selected fruits in Port Harcourt Nigeria.Asia Journal of Science and Technology, 12(2), 11535-11539.
Gulf Standards (2000).Microbiological
criteria for foodstuffs, Part 1.GCC, Riyadh, Saudi
Arabia. pp. 27-30.
Harini K, Nithyalakshmi V. Phytochemical Analysis and Antioxidant
Potential of CucumismeloSeeds.International Journal of Life-Sciences Scientific
Research. 2017; 3(1):
863-867.