This research investigates the distribution
of markets and the accessibility of farms to agricultural markets in the Ido Local Government Area of Oyo State, Nigeria. It
combines primary and secondary data sources, utilizing GPS coordinates,
administrative maps, satellite imagery, and road data to analyze
spatial relationships.
The study reveals a clustered distribution
of markets, predominantly along major roads, while farmland is concentrated
around rural settlements. Proximity to roads plays a vital role in farm
accessibility, with closer proximity benefiting transportation efficiency.
The
study highlights the importance of road infrastructure in promoting
agricultural productivity and recommends road improvements, storage
facilities, and the upgrading of minor roads to facilitate efficient
farm-to-market transportation. These findings have significant implications
for agricultural development and economic growth in the region.
Accessibility of markets to agricultural products is a
critical aspect of achieving SDG Goal 2, which is "Zero Hunger."
Agriculture plays a significant role in driving Nigeria's socio-economic
development, particularly in rural areas where a substantial portion of the
population relies on farming for their livelihoods (TE Olagunju, 2015). Ido Local
Government Area, situated in Oyo State, South-western Nigeria, stands out for
its agricultural potential and serves as a prominent agricultural hub in the
region. With its fertile lands, diverse agro-ecological zones, and cultivation of
various crops by local farmers, the area holds great promise for agricultural
productivity and economic growth (K Adebayo, 2018).
Despite this agricultural potential, farmers
in Ido Local Government Area encounter numerous challenges in accessing
suitable markets to sell their agricultural products (B Wahab and O Abiodun,
2018). Market accessibility is a critical factor
directly influencing agricultural productivity, economic growth, food security,
and poverty reduction (B Shiferaw, J Hellinand G Muricho 2011).
The lack of well-developed transportation infrastructure, particularly roads,
hampers the efficient movement of agricultural goods from production areas to
markets, resulting in post-harvest losses, limited market opportunities, and
reduced income for farmers (V Kiaya, 2014).
Furthermore, the role of markets in
facilitating the exchange of goods and services significantly affects market
accessibility ( Y Bakos, 1998). As economic mechanisms that determine prices and
connect buyers and sellers, markets play a crucial role in the overall
functioning of an economy (O Regev, N Nisan, 1998). Over time, the evolution of market demands has
transformed certain regions surrounding market centers
into central places within their respective areas (B Cohen, 2004). The activities in markets attract people from neighboring regions, making market centers
integral to the settlement system (R Burgess,
2002).
In Ido Local Government Area, markets can be
classified as rural or urban, with the urban center
primarily relying on the rural area to supply its agricultural needs (Ç Keyder, Z Yenal,2011). However, marketing systems are dynamic and continuously
evolving, impacting rural development, income generation, and gender issues. To
improve market access and address challenges faced by farmers, effective
planning of market design and site selection is essential.
Agricultural marketing encompasses various interconnected
activities involved in transferring agricultural produce from farms to end
consumers (G Mendoza, 1995). It involves
production, cultivation, harvesting, grading, packaging, transportation,
storage, food processing, and the final sale of agricultural products. Rural
assembly markets play a crucial role in connecting farmers with traders,
providing a platform for agricultural transactions.
Market centrality, influenced by distance,
plays a significant role in consumer behavior, as
consumers tend to choose the shortest routes to access goods from the market.
The location and accessibility of markets have a direct impact on farmers'
ability to reach potential buyers and participate in economic activities (MT Makhura,2002).
Understanding the interlinkages between local
markets and farming in Africa and Nigeria is essential, as markets play a
pivotal role in the growth and sustainability of the agricultural sector.
Despite the dominance of oil in the Nigerian economy, agriculture remains the
main source of livelihood for most Nigerians (OO
Izuchukwu, 2011). However, smallholder farmers
often face challenges accessing inputs, selling their produce, and adding value
to their products, hindering their potential for increased yields and incomes.
Improving market access for farmers requires favorable policies, farmer-to-market linkages, and access
to timely market information. Organizing farmers and enhancing their knowledge
of market engagement are crucial steps towards enhancing food security and
economic growth at both family and national levels (S Odini, 2014). This research seeks to address the issues of
market accessibility for agricultural products in Ido Local Government Area,
providing valuable insights for policymakers and stakeholders to foster
sustainable agricultural development and economic prosperity in the region, in
line with the United Nations' Sustainable Development Goal 2 - "Zero
Hunger". By enhancing market access for agricultural products, this study
aims to contribute to eradicating hunger, promoting food security, and
improving the livelihoods of farmers in Ido Local Government Area and beyond.
Statement of the problem
SDG number 2, one of the Sustainable Development Goals,
focuses on eradicating hunger, ensuring food security, improving nutrition, and
promoting sustainable agriculture. In Oyo State, one of the prominent
agricultural hubs in southwest Nigeria, farmers encounter significant
challenges related to accessing suitable markets to sell their products. The
lack of well-developed transportation infrastructure, particularly roads, poses
numerous detrimental effects on both food security and the local farmers'
economic prospects. Insufficient road access hampers the farmers' ability to
transport their goods, resulting in increased vulnerability to theft and other
security concerns (V Kelly, AA Adesina, A Gordon -
Food Policy, 2003). Additionally, inadequate marketing sites, limited
distribution channels, and a lack of proper storage facilities contribute to
spoilage of farm products, diminishing farmers' profits and exacerbating food
shortages in local communities and urban areas.
Aim
The aim of this study is to enhance the accessibility of
agricultural products to markets in Ido Local Government Area, Oyo State.
Objectives
·To identify the distribution of existing
market in the study area.
·To access the accessibility of farmers farm
lands to the agricultural markets.
·To analyze the market linkage to the farm.
Study Area
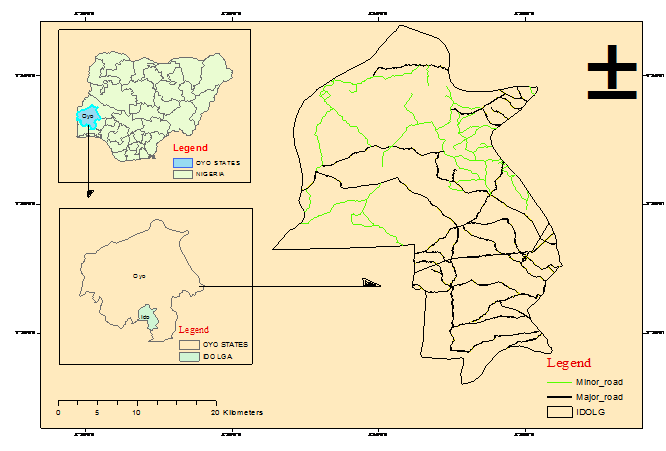
Ido Local Government Area is located in Oyo State, Nigeria.
It is situated in the southwestern part of the country. The geographic
coordinates of Ido Local Government Area are approximately latitude 7.536°N and
longitude 3.242°E.
Ido Local Government Area is positioned within the Ibadan
metropolis, which is the capital city of Oyo State. It is bordered by other
local government areas, including Akinyele to the north, Ibadan North to the
west, Ibadan Northeast to the east, and Oluyole to
the south.
Fig 1a:showing
location of the study area.
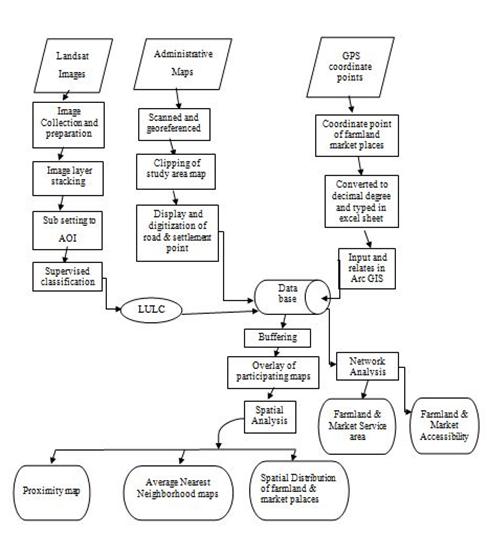
METHODOLOGY
The section outlines the research design, population of
the study, sample size, and the sampling procedure utilized. It also discusses
the instrumentation used, including the validity and reliability of the
instruments. The process of data collection is described, along with the
acquisition of spatial data. Furthermore, the data processing and analysis
methods are explained. The flow diagram depicting the sequential steps of the
research process is presented below.
Figure 2: Methodology Flow Diagram
Data Sources and Acquisition
This study employed a combination of primary and
secondary data sources. The primary data consisted of GPS coordinate points
specifically collected for the markets in the study area. These points were
utilized to accurately map and illustrate the locations of the markets. To
further enhance the clarity of the area's boundaries, topographic and
administrative maps were utilized. These maps, obtained from the Ido Local
Government Area Geographic Information Service (NAGIS), were at a scale of
1:250,000. Additionally, Landsat 8 OLI imagery from 2018 was utilized to assess
the land use and land cover within the study area.
Table 1:
summary of data type & sources
S/N
DATA TYPE
DATA
SOURCE
SCALE/ RESOLUTION
RELEVANCE
1.
GPS Points(market & farm location)
N/A
Field survey
Garmin eTrex 10
Map out and show the distribution of
Markets & farmland
2.
Administrative Map
N/A
ADVANCED SPACE TECHNOLOGY APPLICATION
LABORATORY ( SOUTH-WEST)COPINE
1:250.000
Delineate the boundaries of the study area
3.
Google Earth
Imagery
N/A
www.googleearth.com
15m
Extracting road in the study area
4.
Sentinel
Satellite Data
15/8/2021
https://scihub.copernicus.eu/dhus
10m
Land use land cover 2021 (to identifyfarmland & differentiate from
vegetation)
The integration of these primary and secondary data
sources enabled a comprehensive analysis of the accessibility of agricultural
products to markets in the Ido Local Government Area, Oyo State.
a)Primary data
The data collected for this study primarily consist of:
·The locations of markets and farmland were
determined by capturing coordinate points using handheld GPS devices.
b)Secondary data
·The study made use of secondary data sources,
which included...
·The study obtained road layers by downloading
them from Bing Satellite Map.
·The study obtained the boundary shapefile of
the study area from ADVANCED SPACE TECHNOLOGY APPLICATION LABORATORY (SOUTH-WEST)
COPINE.
During the field survey using the Garmin eTrex 10 device, GPS coordinate
points of the market were collected and converted into decimal degrees. These
points were then recorded in a Microsoft Excel sheet and integrated within the
ArcGIS environment through joining and relating procedures. The Topographic and
administrative maps were scanned and georeferenced to the Universal Transverse
Mercator (UTM) coordinate system, specifically the WGS-84 ZONE 32N, using
on-screen digitization techniques to extract road information. The road layer
encompassed attributes such as street name, street type, street length, speed
limit, direction, and minute details.
To establish the spatial relationship between
the market and the surrounding area, the boundary shapefile of the Local
Government Area (LGA) was superimposed onto the coordinate points and road
layers. Proximity analysis, utilizing the Proximity analyst tool, was performed
to determine the distances between the farmland and the roads leading to the
market. Distances of 1km, 5km, and 10km from the roads were measured to assess
accessibility. Proximity analysis is a valuable technique for assessing spatial
relationships, often employed in business marketing and site selection to analyze demographics and infrastructure for identifying
trade areas.
For image classification and interpretation
purposes, a false-color composite image was generated
by stacking and combining Landsat bands 4, 3, and 2. The study area was clipped
using the IDO Local Government Area shapefile to enhance the spectral
characteristics and features present in the Landsat 8 OLI imagery. Image
interpretation was conducted to identify various land use/land cover
categories, including built-up areas, bare surfaces, croplands, grasslands,
tree cover areas, and water bodies.
To achieve accurate classification, a
training site was established, and an accuracy assessment was performed using
ERDAS software. Ground truth data, obtained through field surveys with a GPS
receiver, assisted in validating the interpretation of satellite imagery and
verifying significant areas and features. The resulting classified image was
converted into a vector format and exported to ArcGIS for layout creation. The
road layer and market location were overlaid on the land use/land cover map,
facilitating spatial and network analysis within the ArcGIS environment for
this research.
Method of data analysis
I.Geo-referencing
The process of geo-referencing involves determining the
precise spatial location of a phenomenon in physical space by defining its
position using map projections or coordinate systems. This term is utilized
when establishing the relationship between raster and vector images, as well as
coordinates, and when determining the spatial location of other geographical features.
II.Network Analysis
This study utilized the Network Analysis tool,
specifically the new service area (drive time analysis) and closest facility
tools. The service area is defined as the geographic region that includes all
the streets accessible within a specified travel time. In this research, the
service area analysis was conducted to assess the extent of market coverage
within a predetermined time frame. By employing this analysis, the study aimed
to identify areas within the study area that had limited market accessibility
within the designated time and geographical boundary. This information was
valuable in identifying gaps in market coverage and determining areas that
require interventions to enhance accessibility.
III.Analysis of the distribution pattern of the
market and farmland
The market and the farmland locations obtained from field
surveys were plotted on the district layers to examine their spatial
distribution. To analyze the distribution pattern,
the nearest neighbor analysis was conducted using the
ArcGIS 10.3 Spatial Statistics Tools, specifically the "Analyzing pattern" function.
Using the Average Nearest Neighbor
tool, the distances between each market's centroid and the centroids of its
nearest neighbors were calculated and averaged to
determine the average nearest neighbor distance. By
comparing this average distance to what would be expected in a random
distribution, the analysis determined whether the market locations showed
clustering or dispersion. The average nearest neighbor
ratio was computed by dividing the observed average distance by the expected
average distance, which was based on a hypothetical random distribution with
the same number of features and total area.
The nearest neighbor
analysis is a versatile technique applicable to various types of features, both
human and physical, to assess their proximity. The nearest neighbor
index, ranging from 0 to 2.58, was used to quantify the spatial dispersion.
This index helped identify whether the market and farmland locations exhibited
clustering, randomness, or a regular pattern.
Table 2:
nearest neighbor analysis, rating scale (0 to 2.58)
S/N
Rating
value
Interpretation
from the chart symbol
Interpretation
1
± 0
±0<1
Clustered feature
2
1.0
=1
Random feature
3
2.58
1>2.58
Regular feature
The formula for nearest neighbor can be expressed as follows:
·For each
market and farmland, calculate the straight-line distance to its nearest neighbor.
·Sum up all
the distances calculated in step 1.
·Divide the
sum by the total number of market and farmland to find the mean distance of
features
Rn-2dVn/a Where:
Rn is
the nearest neighbor value.
d is
the mean distance of nearest neighbor in kilometers.
n is
the total number of features to be studied.
a is
area of study in kilometer square
The z-score typically falls within the range of -2.58 to
2.58. A negative z-score below -2.58 suggests a significant clustering with a
0.01 probability level. Conversely, a positive z-score above 2.58 indicates
significant regularity or dispersal with a 0.01 probability level, as described
by (Getis and Ord in 1998).
Table 3: nearest neighbor
analysis, rating scale (0 to 2.58) and Z-score
Proximity
analysis is a method used to assess the spatial relationships between features
by measuring the distances between them and other neighboring
features. One commonly employed technique in proximity analysis is buffer
analysis, which helps identify areas surrounding geographic features. This involves
creating a buffer zone around existing features and determining which features
fall within or outside the buffer boundary. By utilizing such tools, one can
identify the nearest neighboring features, calculate
distances within and between them, monitor events in specific areas, determine
the service area of a facility, or identify features impacted by a particular
activity.
RESULT AND
DISCUSSION
This section presents and discusses the
findings of the study in relation to its main objective, which was to analyze the distribution of market locations and assess the
accessibility of farms and farmers to agricultural markets based on land use
and road infrastructure. To achieve this, a supervised classification method
was employed to identify and classify four land use land cover classes in the
study area. These classes include farmland, water body, settlement, and
vegetation. The analysis and discussion in this chapter revolve around these
aspects, shedding light on the spatial patterns of market distribution and the
impact of land use and road infrastructure on agricultural market accessibility
for farms and farmers.
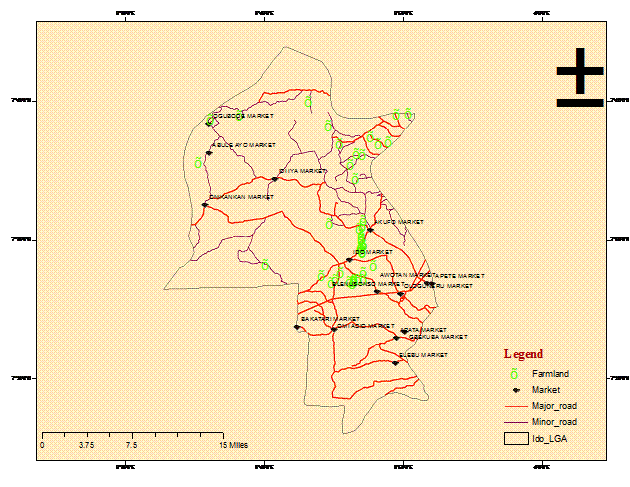
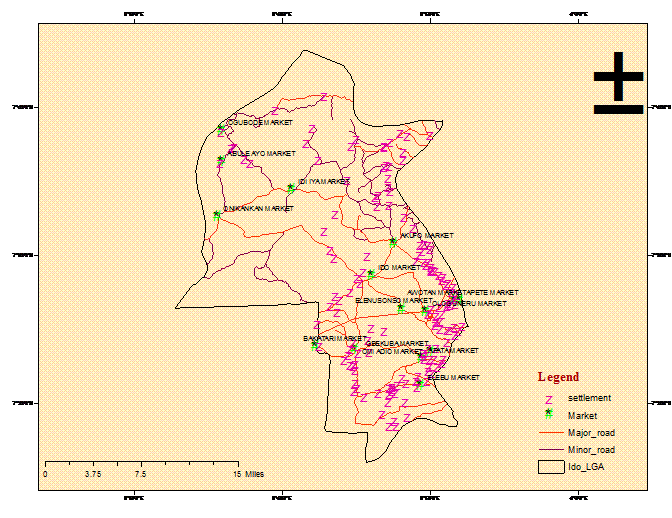
Figure
3: showing farmland, market, major & minor road.
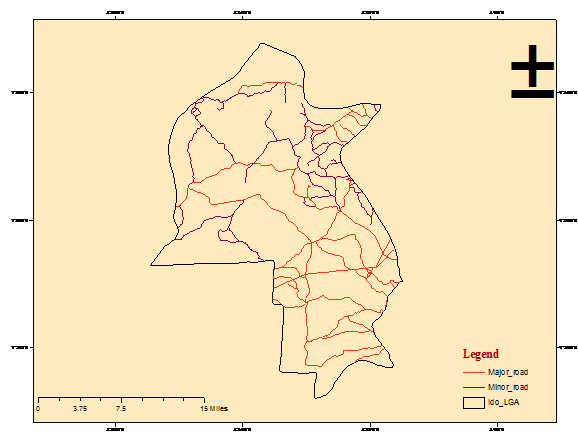
Figure
4: showing major & minor road
The process of extracting the road network is being
described
The findings from the on-screen digitization of roads in
the study area revealed a total of 821 road segments with a combined length of
278.69 km. This is due to the digitization process stopping and continuing at
each junction. The extracted road segments consisted of 191 paved segments and
630 unpaved segments. These road segments were categorized into three major
classes: major road segments (15 segments) with a total length of 75.58 km,
minor road segments (258 segments) totalling 92.31 km, and unpaved road
segments (372 segments) covering a total distance of 110.8 km (as shown in
Figure 4).
The
results obtained from the network dataset analysis indicated the presence of
902 junctions and 1804 edges. The connectivity of the road network, as
calculated by the network analysis, was determined to be 1. A value of 1 for
connectivity implies that the entire study area is well connected in terms of
road infrastructure.
The location of markets is influenced by the size and
distribution of the population
The location of markets in Ido Local Government, Nigeria, is
influenced by several factors including population, urbanization, proximity to
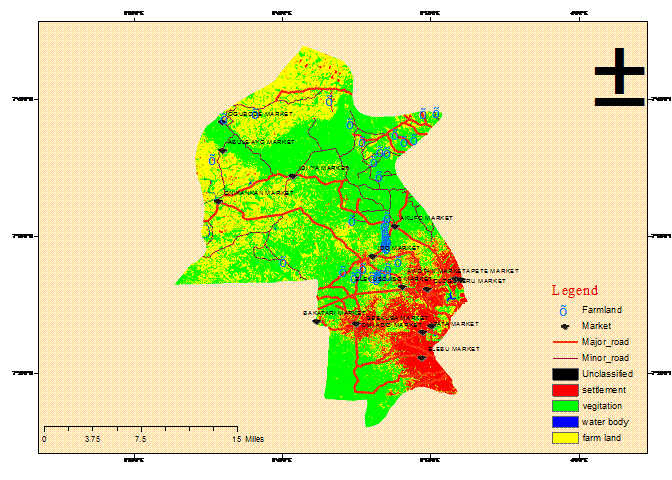
roads, and levels of industrialization and agricultural productivity. Figure 5
depicts the market locations, highlighting a distinct pattern wherein the
majority of the markets are situated in the southern part of the study area.
Additionally, a few markets can be found in the central region, particularly in
areas that exhibit relatively higher levels of urbanization. Notably, there is
a noticeable scarcity of markets in the northern part of the study area.
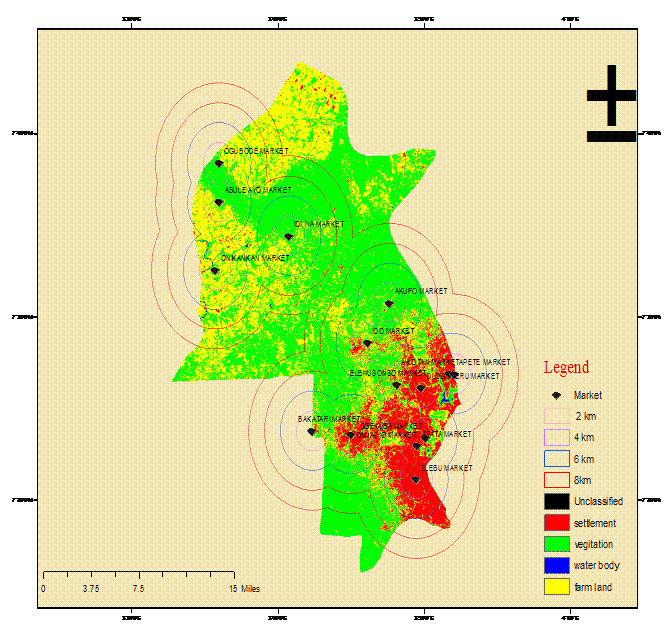
Figure 6: showing the
spatial distribution of market analysis.
Spatial distribution of market
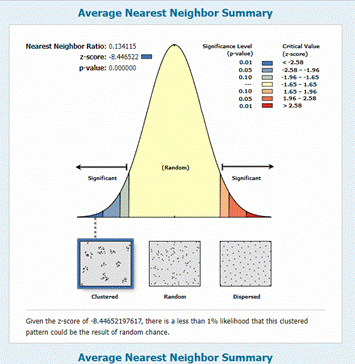
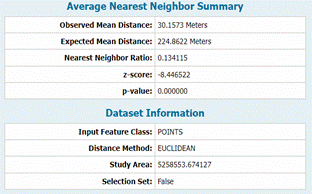
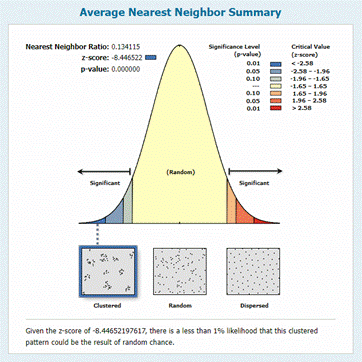
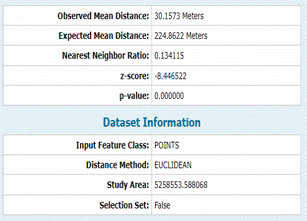
The markets in the study area demonstrate a discernible
spatial distribution pattern, indicating that their locations are influenced by
various factors. The Average Nearest Neighbor (ANN) technique was employed to
analyze this distribution pattern. The results reveal that the distribution of
markets in the study area follows a clustered pattern, meaning that they are
not randomly dispersed. Figure 6 supports this finding, as it illustrates a
concentration of markets along the roads. Specifically, there are 13 markets
situated along major roads and 2 markets along minor roads. These markets along
major roads serve not only the local residents but also offer accessibility to
travelers from other areas, including interstate or inter-LGA travelers.
Consequently, markets located along roads are easily reachable by individuals
from different locations, in contrast to those located in the interior regions
that face challenges in terms of limited access due to poor road conditions.
Figure 7 showing the
spatial distribution of farmland analysis.
Spatial distribution of farmland
The distribution of
farmland in the study area exhibits a distinct spatial pattern, indicating that
various factors influence its location. The Average Nearest Neighbor (ANN)
technique was employed to analyze this distribution. The results demonstrate
that farmland in the study area tends to cluster rather than being randomly
dispersed. This observation is supported by Figure 7, which depicts a
concentration of farmland surrounding rural settlements.More specifically, a significant portion of farmland is
situated in the rural region, maintaining a moderate distance from major roads.
In contrast, there are relatively fewer farmland areas located at a considerable
distance from both major and minor roads, albeit the condition of these roads
might pose challenges to motorists, particularly during the rainy season. The
farmland areas along major and minor roads not only serve the local population
but also provide accessibility to travelers from other regions, including those
traveling between different regions or local government areas (LGA).Consequently, farmland located in the rural area is less
readily accessible to individuals from diverse locations compared to those in
interior regions. However, the farmland in interior regions faces limitations
in terms of access due to poor road conditions, particularly during unfavorable
weather conditions such as heavy rainfall. Figure 4.6 showing the land
use land cover (LULC) classes of the study area.
Figure 8 showing LULC
with roads, market & farmland classes in the study area
Analysis
of LULC of Ido Local Government Area.
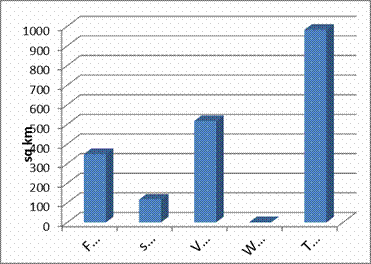
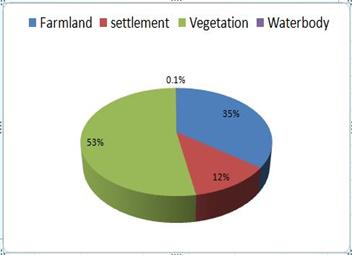
Figure 8 illustrates the extent of Land Use Land Cover
(LULC) in Ido Local Government Area. The predominant LULC category is farmland,
covering an area of 348.143 km², which represents 35.46% of the total area.
Settlement areas account for 115.894 km², equivalent to 11.81% of the area.
Water bodies make up a small portion of 0.9846 km², representing 0.10%.
Vegetation covers the largest area of 516.775 km², making up 52.64% of the
total area. Table 4 presents the overall accuracy assessment of the classified
images for the study area, indicating that the results achieved an accuracy of
over 88%. This suggests that the image analysis conducted was successful, as
stated by Herold,
Clarke, and Scepan (2005).
Table 4: showing the
summary of LULC classes.
Classes
Area (H)
Area (sqkm)
Area (%)
Classes
Farmland
34814.3
348.143
35.45979
Farmland
settlement
11589.4
115.894
11.80428
settlement
Vegetation
51677.5
516.775
52.63565
Vegetation
Water
body
98.46
0.9846
0.100286
Water
body
Total
98179.66
981.7966
100
Total
Figure 9: showing bar
chart representation of LULC classification.
Figure 10: chart
showing LULC classification.
Table 4: showing the
Classification accuracy assessment report.
S/N
Class
Name
Reference
Totals
Classified
Totals
NumberCorrect
Producers
Accuracy
UsersAccuracy
1
Unclassified
27
28
27
----
---
2
settlement
1
1
1
100.00%
100.00%
3
vegetation
14
14
13
92.86%
92.86%
4
water body
0
0
0
----
----
5
farm land
8
7
6
75.00%
87.71%
Overall Classification Accuracy = 94.00%
Overall Kappa Statistics =
0.8994
Farmland / Market Service area
The service area of a facility refers to the accessible
area for people within the facility's perimeter. It determines the efficiency
of the facility and its ability to serve the local community without causing
inconvenience. The proximity of farms to markets plays a crucial role in
supporting the local economy and the income of farmers. By analyzing the
distances and travel times, it was found that certain farms are located within
0-2 square kilometers of the market and can reach it within a 6-minute drive, assuming
no obstacles such as bad roads. Additionally, there are farms situated within
2-4 square kilometers, requiring approximately 12 minutes of driving time to
reach the market. Moreover, some farms fall within 4-6 square kilometers from
the market, with an estimated travel time of 18 minutes, while others are
within 6-8 square kilometers and require a 24-minute drive.
Figure 11: showing
service areas of the market
Figure 12: showing
service areas of the farmland.
Figure
13: showing the proximity of the farmland & market to major road in kilometers.
Figure
14: showing the proximity of the farmland & market to minor road in kilometers.
Proximity to
road
Roads are the primary
mode of transportation in Nigeria, and their quality is crucial for the
efficient movement of goods, products, and people. For farmers, roads are vital
in transporting their agricultural produce from rural areas to urban markets.
Additionally, roads serve as the primary means of connecting individuals to
different regions of the country. Figure 13 and 14
emphasize the significance of having farms located near roads for farmers. When
farms are in close proximity to roads, farmers can easily and conveniently
transport their products to the market, unlike those situated in remote areas
with limited road access.In the study
area, certain farmers have limited choices and must rely on minor roads that
are close to their farms. Although these minor roads may not be major highways,
they act as connectors between the farms and the main road network. Farms
located at various distances, such as 1km, 2km, 3km, and beyond, can access
these minor roads, enabling them to reach the main road (highway) and utilize
it for transportation purposes.
Figure
15: showing the market Accessibility index.
Figure 15
provides a visual representation of the market access index in Ido Local
Government. The index indicates the level of market influence in different
areas, with the highest influence observed near large urban areas. As the
population density decreases, the market influence diminishes until it reaches
zero in areas with minimal or no human settlements. In particular, the market
access index approaches 1.0 in significant villages and towns, especially in
the urban parts of the local government where the population is larger. These
areas enjoy easy accessibility to markets, allowing the residents to benefit
from convenient access to goods and services.
Conversely,
the market index is relatively low in certain areas, particularly in the
northeastern part of the study area. This indicates that farmers residing in
these areas would have to travel longer distances and incur higher costs to
reach any of the markets within the study area.
CONCLUSION
The study conducted
in Ido Local Government has revealed a clustered distribution of markets and
farmland, with the market locations following the urban settlement pattern and
the farmland aligning with rural settlements. On average, the markets are
spaced approximately 2 to 8 kilometers apart, while the farmland is spaced
approximately 2 to 6 kilometers apart. It is worth noting that over 65% of the
markets are situated along major roads or highways, with roadside locations
also being preferred. However, a larger portion of the farmland is located far
away from major roads.
These
findings emphasize the importance of accessibility as a crucial factor in
determining market locations. They are in line with the perspective put forth
by White and Gleave (1978), which suggests that markets can be established in
various settings, including bush areas, pathway junctions, hamlets, villages,
roadside areas, as well as towns and cities.
Furthermore,
the study highlights the critical role of proximity to roads for farmers in
efficiently transporting their agricultural produce from the farm to the
market. Farms that are situated near roads benefit from easier access to
transportation, enabling them to deliver their products to the market more
effectively. Conversely, farms located far away or lacking proper road
infrastructure face challenges in transporting their agricultural goods, which
can lead to product spoilage and discourage farmers from actively participating
in agricultural activities.
Recommendation
The improvement of
access roads in the study area would have significant positive effects on
agricultural production, business opportunities, and the overall economic
growth of the country. The study area is blessed with fertile lands that can be
effectively utilized by farmers to increase food production and stimulate
economic development. By linking roads in areas like Akufo,
Kusela, and other regions within the Ido Local
Government area to major highways, the abundant arable land in these localities
could be fully utilized for cultivating crops such as maize, beans, yam,
cassava, and pepper. These agricultural products can be preserved and
transported to various parts of the country, expanding their market reach.
To
support agricultural activities and prevent spoilage of perishable goods, it
would be beneficial for the government to consider establishing cold room
depots along major roads or strategically near farmland. These facilities would
allow farmers and marketers to store perishable goods, reducing wastage and
losses.
There
is an urgent need to upgrade certain minor roads to major roads and construct
unpaved roads that connect to the minor ones. This would facilitate the
efficient movement of agricultural produce from farms to consumers by providing
accessible transportation routes. Currently, many of the roads used by farmers
are poorly developed, posing challenges to the transportation of agricultural
goods. Enhancing the road network would also contribute to the establishment of
a reliable farm transport system, catering to the requirements of long-distance
agricultural production. Presently, farm products in the study area primarily
rely on manual labor, motorbikes, or trucks for transportation.
In
conclusion, the enhancement of road infrastructure in the study area would not
only positively impact agricultural production and create business
opportunities but also improve the overall efficiency of the farm-to-market
transportation system.
REFERENCES
Adebayo, K. et al. "Shaping, adapting and
reserving the right to play: Responding to uncertainty in high quality cassava
flour value chains in Nigeria." Journal of Agribusiness in Developing
and Emerging Economies 8.1 (2018): 54-76.
Bakos, Y.
(1998). The emerging role of electronic marketplaces on the
Internet.Communications of the ACM, 41(8), 35-42.
Besley,
T., & Burgess, R. (2002). The political economy of government
responsiveness: Theory and evidence from India. The
quarterly journal of economics, 117(4), 1415-1451.
Cohen, B. (2004). Urban growth in developing
countries: a review of current trends and a caution regarding existing
forecasts. World development, 32(1), 23-51.
Izuchukwu, O. O.
(2011). Analysis of the contribution of agricultural sector
on the Nigerian economic development.World review
of business research, 1(1), 191-200.
Kelly, V., Adesina, A. A., & Gordon, A. (2003). Expanding
access to agricultural inputs in Africa: a review of recent market development
experience. Food Policy, 28(4), 379-404.
Keyder, Ç., & Yenal, Z. (2011). Agrarian
change under globalization: Markets and insecurity in Turkish agriculture. Journal
of Agrarian Change, 11(1), 60-86.
Kiaya,
V. (2014).Post-harvest losses and strategies to
reduce them.Technical Paper on Postharvest Losses, Action Contre la Faim (ACF), 25,
1-25.
Makhura, M. T.
(2002). Overcoming transaction costs barriers to market participation of
smallholder farmers in the Northern Province of South Africa (Doctoral
dissertation, University of Pretoria).
Mendoza, E. G. (1995).The terms of trade, the real exchange rate, and economic
fluctuations.International Economic Review, 101-137.
Odini,
S. (2014).Access to and use of agricultural
information by small scale women farmers in support of efforts to attain food
security in Vihiga County, Kenya.Journal of emerging trends in economics and management sciences,
5(2), 80-86.
Olagunju, Temidayo Ebenezer. "Drought, desertification and the
Nigerian environment: A review." Journal of Ecology and the Natural
Environment 7.7 (2015): 196-209.
Regev,
O., & Nisan, N. (1998, October). The POPCORN market—an
online market for computational resources. In Proceedings
of the first international conference on Information and computation economies
(pp. 148-157).
Shiferaw, B., Hellin, J., & Muricho,
G. (2011). Improving market access and agricultural productivity growth in Africa:
what role for producer organizations and collective action institutions?.Food security, 3,
475-489.
Wahab,
B., & Abiodun, O. (2018).Strengthening food security through peri-urban agriculture in
Ibadan, Nigeria.Ghana Journal of Geography, 10(2), 50-66.
Wikipedia. (2019). Retrieved
from https://en.wikipedia.org/wiki/Market_(economic)
Cite this
Article: Adebayo, AA; Ehisienmhen,
NO; Ashiru, SK; Sedenu, HA;
Haruna, RS; Isa, A; Odediran,
OO; Adewale, ET; Amos, IS; Aribilola,
TR; Omisore, OO; Afiz, RA
(2023). Accessibility of Market to Agricultural Products in
Ido Local Government Area Oyo State.Greener Journal of Agricultural Sciences,
13(4): 258-273.