INTRODUCTION
Electrocardiogram
(ECG or EKG) is the recorded electrical activity and rhythm of the heart (Hall
and Hall, 2012). Resting ECG gives report of electrocardiographic changes when
a patient is at rest. Exercise ECG is during exercise. Ambulatory ECG is when
the patient is moving around. ECG is useful in making diagnosis of
cardiovascular diseases (Dahal, 2023).
ECG can be used to diagnose the following cardiovascular diseases:
Q-wave pathology, QRS axis abnormality, left ventricular hypertrophy (LVH),
T-wave abnormality, ST-segment abnormality, AV block, bundle branch block
(BBB), sinus rhythm abnormality, atrial enlargement (Ezeude
et al., 2023).
The process of producing electrocardiogram is called
electrocardiography (Tarak and Ajam,
2017). ECG is widely used in many hospitals in Nigeria. It is relatively cheap,
readily available, and non-invasive. A study conducted in Port harcourt, South-South, Nigeria
reported a high utilization of ECG in private hospitals (83.2 %) (Alikor and Nwafor, 2018).
This research was carried out to evaluate the electrocardiographic
patterns at Dr. Joe Nwilo Heart Foundation located at
Adazi-Nnukwu, Anambra
State, Nigeria.
METHODOLOGY
Research Design:
The research conducted at the cardiovascular
unit of Dr. Joe Nwilo Heart Centre, Adazi-Nnukwu, Anambra State, was
a four year retrospective study (2014, 2015, 2016, and 2017).
This involved examining the case files of the
patients within the time period.
Area of the Study
This study took place at the cardiovascular unit of Dr. Joe Nwilo
Heart Centre, Adazi-Nnukwu, Anaocha Local Government, Anambra State.
Methods of Data Collection
Case files of the patients were retrieved. A total of 400 case files were examined. The
following vital information (bio-data) was recorded: number
of files, age, gender, occupation, high blood pressure, pulse, height, weight and
cardiac disease diagnosable with electrocardiogram.
Ethical Consideration
Ethical approval was obtained from the Ethical Committee of Faculty of
Basic Medical Sciences, COOU, Uli
Campus.
Statistical Analysis
The Data obtained were analyzed statistically using statistical package
for social sciences (SPSS, version 25.0) categorical
variables were summarized by frequency counts and percentages. Data
were expressed as mean ± SD. Univarite
comparisons were made for the study variables. ANOVA F-tests were used to
evaluate differences in means. The significance level for
all tests was set at P< 0.05. Multiple logistic regression methods were used to fit models to
each of the dependent variables.
RESULTS
Data Analysis and Presentation
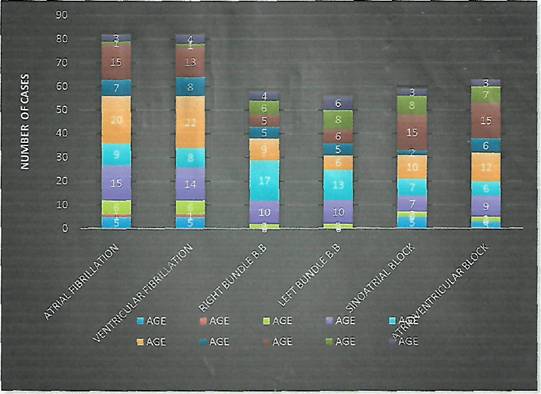
In the baseline demographics of participant by diagnosis categories, the
total mean age of all patients for four years who suffered from
atrial fibrillation was 56±2.1.
For ventricular fibrillation, it was 56±2.2; 61±1.9 for
right bundle branch block. It was 63±2.5 for sinoatrial
block and 64±2.2 for atrioventricular block.
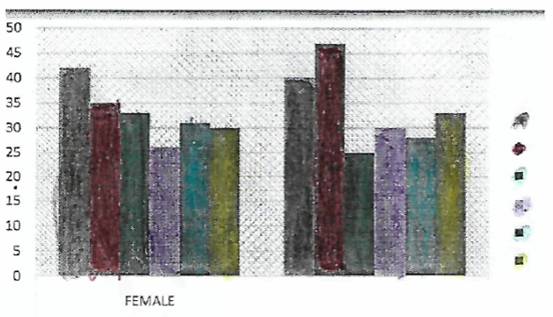
The percentage of male who suffered from atrial
fibrillation for four years was 48.8% for
ventricular fibrillation; it was 57.3%, 43.1% for right
bundle branch block, and 53.6% for left bundle branch block, 52.5% for sinoatrial block
and 52.4% for atrioventricular block.
The percentage of females
who suffered from atrial fibrillation for four years was 51.2%,
42.7% for ventricular fibrillation, and 56.9% for right bundle branch block, 46.4% for left bundle branch block, 47.5%
for sinoatrial block and 47.6% for atrioventricular block.
DISCUSSION
The ECG changes in this Heart
Center were investigated. Atrial fibrillation was the most common type of
arrhythmia found here (20.75 %). This figure differs from 15.3 % that was
reported by Unamba et al (2020). Other researchers
reported 16 % (Karaye and Sani
(2008), 8.9 % (Owusu et al., 2014). However, atrial
fibrillation was the most common type of arrhythmia in their studies. The
differences in figures can be attributed to differences in etiologic factors
underlying the heart diseases of their study population. Next to atrial
fibrillation was ventricular fibrillation at 20.25%, atrioventricular
block was 15.5%, RBBB and sinoatrial block were 14.75%.
Lastly was LBBB with 14%.
Investigating
ECG patterns in a specialist hospital usually reflects the predominant diseases
found in the study population. For example a study population of diabetic
patients (irrespective of type) will have ECG changes that reflect this
condition (Simova et al., 2015; Harms et al., 2021; Sinamaw et al., 2022). Similarly, a predominantly
hypertensive sample population will produce ECG changes consistent with some of
the complications of this illness (Agomouh and Odia, 2007; Newaz et al., 2016).
Both hypertension and diabetes are risk factors for cardiovascular diseases.
Our study did not focus
on any special category of patients. We simply examined the case files of all
the patients that presented to the center who were treated, got well and
discharged. This explains the variations in most ECG patterns when compared
with that reported by some authors. For instance, the commonest ECG abnormality
as reported by Unamba et al., (2020) was left atrial
enlargement (45.95%). Their emphasis was on heart failure patients. In the study
conducted by Ayoola et al., (2019) left ventricular
hypertrophy (LVH) was reported as their commonest ECG abnormality. This is due
to the fact that they focused mainly on newly diagnosed hypertensive patients.
In the measured study variables, the result showed that it was only body
mass index (BMI) that was statistically significant with p<0.5
while other measured variables did not show statistically
significance. Therefore, BMI has a positive correlation to the diagnosis. In
the non- measured study variables,
from the data we observed that gender, occupation,
education status were all not statistically significant as p> 0.5, while age
showed to be statistically
significant with p< 0.05.
Therefore, age has a positive
correlation to the diagnosis.
RECOMMENDATIONS
§ Philanthropists
in the state should donate more equipment to the center to enable it function
more efficiently.
§ Anambra State government should sponsor some of the
healthcare workers there for further training either in Nigeria or abroad.
§ ECG
is highly recommended in people with history of heart disease or cardiac
surgery who experience the following symptoms: pain in the chest,
difficulty in breathing, feeling
tired or weak.
CONCLUSION
ECG is a non-invasive, cost-effective tool for
detecting cardiac abnormalities. At Dr. Joe Nwilo
Heart Foundation, Adazi-Nnukwu, Anambra
State, ECG has been utilized in the diagnosis of the following heart diseases:
atrial fibrillation, ventricular fibrillation, right bundle branch block, left
bundle branch block, sinoatrial block, and atrioventricular block. Our study revealed that atrial
fibrillation was the commonest ECG abnormality in that center within the period
under review. This was closely followed by ventricular fibrillation.
REFERENCES
Agomouh D, Odia O (2007). Pattern
of ECG abnormalities in Nigeria hypertensive patients. Port Harcourt Med J 2: 22-26.
Alikor CA and Nwafor
EC (2018). Availability and utilization of electrocardiogram as cardiac
diagnostic tool in private hospitals in Port Harcourt. Nig
J Cardiol 15: 94-97.
Ayoola YA, Ayanbisi
IO, Ejeh AB, Ejeagba O, Adamu A, Okolie HI (2019).
Electrocardiographic changes in newly diagnosed hypertensive patients at
federal teaching hospital Gombe. Borno
Medical Journal, 16(1): 1-5.
Dahal P (2023). Electrocardiogram (ECG):
parts, principle, procedure, types. Available at :
https: //www.microbenotes.com.
Ezeude CM, Nkposi
MO, Abonyi MC, Onwuegbuna
AA, Okechukwu UC, Anyanwu
AC, Ikeabbah HE, Ezeude AM
(2023). Association of electrocardiographic abnormality in stable type 2
diabetes subjects: experience from a tertiary health facility in South-East
Nigeria. Journal of Drug Delivery and Therapeutics 13(1): 62-72.
Hall JE and Hall ME
(2021).Guyton and Hall textbook of medical physiology. 14th ed. Int’l edition.
Philadelphia, Elsevier.P135.
Harms PP, van der Heijden AA, Rutters F, Tan HL, Beulens JWJ, Nijpel G
(2021).Prevalence of ECG abnormalities in people with type 2 diabetes.The Hoorn Diabetes Care System Cohort. J Diabetes
Complications 25(2): 107810.
Karaye KM, Sani MU
(2008).Electrocardiographic abnormalities in patients with heart failure. Cardiovasc J Afr 19: 22-25.
Newaz R, Hud S, Syed M, Maula G, Saiful-Islam (2016). Electrocardiographic changes in
different grades of hypertensive patients. Experience of 400 cases in
Bangladesh. J Sc Found 14: 26-9.
Owusu IK, Adu-Boakye
Y, Appiah LT (2014). Electrocardiographic
abnormalities in heart failure patients at a teaching hospital in Kumasi,
Ghana. J Cardiovasc Dis Diagn , 2:2. Doi: 10.4172/2329-9517, 1000142.
Simova I, Christov
I, Bortolan G (2015).A review on electrocardiographic
changes in diabetic patients. Curr Diabetes Rev
11(2): 103-6.
Sinamaw D, Getnel
M, Abdulkadir M, (2022). Pattern and associated
factors in Amhara National Regional State Referral
Hospitals, Ethiopia: a multicenter institution-based cross-sectional study BMC Cardiovasc Disord 22: 230.
Tarak Ajam, (2017). Electrocardiography. www.medicinenet.corn/electrocardiogram'-ecg'-or'-ekg/
article.htm).
Unamba NN, Edeogu
JU, Orji MI (2020). The functional class and electrocardiographic abnormalities
in heart failure patients in southern Nigeria: a retrospective observational
study. The Nigerian Health Journal, 20(2): 44-53.