Greener Journal of Environment Management and Public Safety
ISSN: 2354-2276
Vol. 14(1), pp. 19-30, 2026
Copyright ©2026, Creative Commons Attribution 4.0 International.

|
Greener Journal of Environment Management and Public Safety ISSN: 2354-2276 Vol. 14(1), pp. 19-30, 2026 Copyright ©2026, Creative Commons Attribution 4.0 International. |
|
Development and Evaluation of a Low-Cost Biosand Filter Enhanced With Plant-Based Antimicrobial for Safe Drinking Water in Rural Communities
Alpha, Henry Ebiowei1; Ezem, Sebhaziba Benjamin2; Ameafule, Princewill Chijioke3; Olagoke, Blessing Ade4; Tuaboboh, Grace Timipre5
1 Department of Biology, Faculty of Science, Bayelsa Medical University; henryalpha04@gmail.com
2 Department of Microbiology, Faculty of Science, Bayelsa Medical University; benseb@gmail.com
3 Department of Medical Microbiology University of Port Harcourt Teaching Hospital, princewillameafule@gmail.com
4 Faculty of Science, Bayelsa Medical University. Kericious16@gmail.com
5 Grace Timipre Tuaboboh; Department of Microbiology, Bayelsa Medical University.
|
ARTICLE’S INFO |
|||
|
Article No.: 070126111 Type: Research Full Text: PDF, PHP, HTML, EPUB, MP3 DOI: 10.15580/gjemps.2026.1.070126111
Accepted: 04/07/2026 Published: 10/07/2026
Keywords: Water quality, biosand filter, turbidity, coliforms, Yenagoa, Bayelsa State, Nigeria.
|
*Corresponding Author
Alpha, Henry Ebiowei
E-mail: henryapha04@gmail.com |
Article’s QR code
|
|
|
|
|
|
|
|
ABSTRACT |
|
This study evaluated the physicochemical and microbiological quality of water samples collected from five communities in Yenagoa, Bayelsa State, Nigeria, namely Amarata, Ekeki, Okaka, Kpansia, and Agudama-Epie. The effectiveness of conventional and enhanced biosand filtration systems in improving water quality was also assessed. Raw water samples were analyzed for pH, turbidity, total dissolved solids (TDS), and total coliform counts using standard procedures in accordance with APHA (2017) methods. Results showed that raw water samples were slightly acidic, with pH values ranging from 6.1 ± 0.11 to 6.5 ± 0.12. Turbidity levels (15.2 ± 0.70 to 20.3 ± 0.90 NTU) exceeded WHO permissible limits, while TDS values (195 ± 5.8 to 225 ± 7.1 mg/L) remained within acceptable standards. Microbiological analysis revealed high total coliform counts ranging from 150 ± 10 to 200 ± 15 CFU/100 mL, indicating significant contamination and unsafe drinking conditions. Following treatment, both filtration systems improved water quality; however, the enhanced biosand filter demonstrated superior performance. Turbidity was reduced to 1.9 ± 0.25–2.4 ± 0.40 NTU, while total coliform counts decreased to 6 ± 1–10 ± 2 CFU/100 mL. Removal efficiencies for turbidity and total coliforms were 88.5 ± 1.8% and 95.5 ± 1.2%, respectively, for the enhanced system, compared to 68.1 ± 2.4% and 74.5 ± 3.1% for the conventional filter. Statistical analysis confirmed that differences between the two systems were significant (p < 0.05). The study concluded that while both systems improved water quality, the enhanced biosand filter was more effective in reducing both physicochemical and microbial contaminants, though additional disinfection may be required to fully meet WHO drinking water standards.
|
|
|
1.0 INTRODUCTION
Access to safe drinking water remains a major global public health challenge, particularly in developing countries where water resources are abundant but unevenly distributed, poorly managed, and frequently contaminated. Despite global recognition of water as a fundamental human right, millions of people still lack access to safely managed drinking water services, with rural populations being the most affected due to weak infrastructure and limited treatment capacity (Isukuru et al., 2024). In Nigeria, the water crisis persists despite the country’s significant freshwater resources distributed across coastal, central, and northern hydrological zones. Surface and groundwater bodies remain among the country’s most important natural resources; however, accessibility to safe drinking water remains limited. A large proportion of rural communities depend on untreated water from rivers, shallow wells, and boreholes that are highly vulnerable to contamination from industrial discharge, agricultural runoff, domestic waste, and flooding events (Isukuru et al., 2024). The global freshwater system is further threatened by increasing pollution from human activities and environmental degradation. Water pollution remains one of the most critical environmental and public health challenges globally, often considered more impactful than air and soil pollution due to its direct effects on human consumption and ecosystem health (Verma & Ratan, 2020). Despite advancements in water supply systems and sanitation infrastructure, water pollution continues to pose a persistent risk, emphasizing the need for continued intervention and investment.
Nigeria is naturally endowed with abundant water resources and is classified into three major hydrological zones: coastal, central, and northern. The coastal zone includes states such as Bayelsa, Rivers, Delta, and Lagos, where riverine and swampy conditions dominate. Despite this abundance, access to safe drinking water remains limited due to poor infrastructure, pollution, and inadequate management systems (Aliyu & Amadu, 2017).
Water quality studies remain essential in environmental science because they determine the suitability of water for domestic, agricultural, and industrial purposes (Ewuzie et al., 2021). However, only a small proportion of the Nigerian population has access to safe drinking water. Estimates show that while urban areas have relatively better access, rural communities remain significantly disadvantaged, with a much higher dependence on unsafe water sources (Ehinomen et al., 2018). The demand for freshwater continues to increase due to rapid population growth, urbanization, and industrial activities, placing additional pressure on already stressed water systems (Pona et al., 2021). Urban expansion has also led to environmental degradation and increased pollution loads, resulting in public health challenges, particularly among urban poor populations (Aliyu & Amadu, 2017).
Studies have documented the presence of nitrates, heavy metals such as lead and cadmium, and microbial pathogens in groundwater sources across various regions. These contaminants pose significant health risks, including cancer, kidney damage, and infectious diseases, especially among children and vulnerable populations (Egbueri et al., 2023a; Ayejoto et al., 2023a; Agbasi et al., 2023a). Water quality in Nigeria is further influenced by seasonal variations, agricultural activities, industrial discharge, and climate change. However, recent reviews indicate that many studies focus on specific regions or limited parameters, leaving significant gaps in nationwide assessments and integrated pollution analysis (Agbasi et al., 2024; Omeka et al., 2024).
Existing literature identifies major pollution sources including oil and gas exploration, mining, agricultural runoff, domestic waste, sewage discharge, and landfill leachates (Ighalo & Adeniyi, 2020). More recent studies also highlight the role of greenhouse gas emissions and climate-induced flooding in worsening water quality across southern Nigeria (Ayejoto et al., 2023c). However, less attention has been given to the combined effects of natural disasters, social conflicts, and water scarcity on water resource sustainability. In addition, water scarcity has been linked to socio-political tensions, including farmer-herder conflicts in northern and central Nigeria, where declining water availability has forced migration and competition over limited resources (Gürsoy, 2024). These dynamics demonstrate that water challenges in Nigeria extend beyond environmental concerns to include social stability and security issues.
Despite numerous studies on water pollution and scarcity, key gaps remain. Many studies fail to integrate anthropogenic, natural, and social dimensions of water challenges or to propose practical, low-cost solutions suitable for rural communities. Furthermore, there is limited research on integrated household-level water treatment technologies that combine physical filtration with natural antimicrobial enhancement. Therefore, this study is situated within the need to address these gaps by developing and evaluating a low-cost biosand filter enhanced with plant-based antimicrobial agents for improved drinking water quality in rural communities. This approach combines technical innovation with locally available natural resources to provide a sustainable solution to rural water insecurity.
Aim and Objectives
The aim of thecstudy was to develop and evaluate a low-cost biosand filter enhanced with a plant-based antimicrobial for improving drinking water quality in rural communities. The specific objectives of the study was to:
i. To design and construct a low-cost biosand filter using locally available materials
ii. To prepare a plant-based antimicrobial extract for water treatment
iii. To evaluate the physicochemical quality of water before and after filtration
iv. To assess the microbial removal efficiency of the enhanced biosand filter
v. To compare the performance of the enhanced filter with a conventional biosand filter.
2.0 MATERIALS AND METHODS
2.1 Study Area
The study was conducted in Yenagoa, the capital of Bayelsa State, located in the Niger Delta region. The area lies within a low-lying coastal environment characterized by a tropical rainforest climate, with high annual rainfall (approximately 2,000–3,000 mm) and a distinct wet and dry season. The terrain is predominantly swampy, with numerous creeks and rivers, making surface and shallow groundwater the primary sources of domestic water supply. Due to inadequate centralized water treatment infrastructure, many households in Yenagoa rely on untreated water from wells, boreholes, and nearby surface water bodies. These sources are highly susceptible to contamination from surface runoff, poor sanitation practices, and anthropogenic activities, increasing the risk of waterborne diseases. Five sampling locations were selected within Yenagoa metropolis based on population density, accessibility, and dependence on untreated water sources:
i. Amarata Community – characterized by high population density and reliance on shallow wells
ii. Ekeki Community – a mixed residential and commercial area with borehole usage
iii. Okaka Community – peri-urban settlement with limited access to treated water
iv. Kpansia Community – residential area with both wells and surface water usage
v. Agudama-Epie Community – semi-urban area with high dependence on groundwater sources
At each location, water samples were collected from commonly used sources such as hand-dug wells, boreholes, and nearby surface water bodies. Sampling was conducted in sterile 500 mL bottles, following standard procedures to avoid contamination. Samples were transported in ice-packed containers to the laboratory and analyzed within 6 hours of collection.
2.2 Materials
Materials used for the construction of the biosand filter comprised locally sourced fine sand, coarse sand, and gravel obtained from clean, uncontaminated deposits. The filter housing consisted of a cylindrical plastic container with a height of 80–100 cm and an internal diameter of 25–30 cm. Supporting materials included polyvinyl chloride (PVC) pipes (12–20 mm diameter), outlet valves for flow control, and nylon or stainless-steel mesh screens for separation of filter media layers and prevention of material loss.
The filtration media were prepared by thorough washing with clean water to remove silt, clay, and organic impurities, followed by air-drying prior to use. The fine sand was sieved to obtain an effective grain size of 0.15–0.35 mm, while coarse sand and gravel were graded to appropriate sizes (0.5–2 mm for coarse sand and 5–20 mm for gravel) to ensure proper hydraulic conductivity and structural stability of the filter.
The plant-based antimicrobial used in this study was derived from seeds of Moringa oleifera, selected based on its well-documented coagulating and antimicrobial properties. Mature seeds were sourced locally, dehulled, and processed into fine powder for extract preparation.
Laboratory materials and analytical equipment included sterile polyethylene sampling bottles (500 mL capacity) for water collection, an incubator for microbial culture, an autoclave for sterilization of media and equipment, and standard instruments for physicochemical analysis. These included a digital pH meter for hydrogen ion concentration measurement, a turbidity meter for determination of water clarity, and a conductivity meter for assessing total dissolved solids (TDS) and ionic content.
Microbiological analysis was conducted using standard culture media, including nutrient agar and selective media for coliform detection, to evaluate bacterial contamination levels before and after filtration.
2.3 Design and Construction of the Biosand Filter
The biosand filter was designed as a gravity-driven, intermittent flow filtration system following standard household biosand filter principles with minor modifications to incorporate plant-based antimicrobial enhancement.
2.3.1 Filter Configuration
The filter unit consisted of a cylindrical plastic container with a height of 80–100 cm and an internal diameter of 25–30 cm. An outlet pipe made of PVC (12–20 mm diameter) was installed approximately 5 cm above the base of the container to maintain a constant standing water level within the filter, which is essential for sustaining biological activity. A diffuser plate (perforated plastic or aluminum) was positioned at the top of the filter to distribute influent water evenly and prevent disturbance of the filter media during operation.
2.3.2 Layered Media Arrangement
The filter media were arranged in layers from bottom to top as shown in Figure 1:
i. Gravel Layer (Support Layer): A 5–10 cm thick layer of coarse gravel (5–20 mm diameter) was placed at the base to support overlying layers and facilitate drainage.
ii. Coarse Sand Layer: A 5–10 cm thick layer of coarse sand (0.5–2 mm grain size) was added above the gravel to prevent fine sand migration and improve flow distribution.
iii. Fine Sand Layer (Filtration Layer): A 40–50 cm thick layer of fine sand (0.15–0.35 mm grain size) was placed above the coarse sand. This layer served as the primary filtration zone responsible for removal of suspended solids and microorganisms.
iv. Standing Water Layer: A water layer of approximately 5 cm was maintained above the sand surface to support the development of the biological layer (schmutzdecke).
2.3.3 Development of Biological Layer
A diffuser plate was installed at the top to prevent disturbance of the sand layer during water pouring. An outlet pipe was fixed at a height to maintain a standing water layer (~5 cm) above the sand surface, facilitating the formation of a biological layer (schmutzdecke). The filter was conditioned by running raw water through it daily for 14–21 days to allow for the development of the biological layer before experimental use.
2.3.4 Integration of Plant-Based Antimicrobial
The enhanced biosand filtration system incorporated a pre-treatment stage using extract derived from Moringa oleifera. The extract was prepared separately and applied to raw water prior to filtration to improve treatment efficiency. A measured dose of the plant extract was added to the influent water at a concentration of 50–150 mg/L (depending on initial turbidity levels). The mixture was rapidly stirred for 1–2 minutes to ensure uniform dispersion of the coagulant, followed by slow mixing for 10–15 minutes to facilitate floc formation through coagulation and aggregation of suspended particles. After mixing, the treated water was allowed to undergo sedimentation for a period of 15–30 minutes to enable settling of formed flocs. The clarified supernatant was then carefully decanted and introduced into the biosand filter for further treatment. The integration of the plant-based antimicrobial pre-treatment was designed to:
i. Enhance turbidity removal through coagulation and flocculation mechanisms
ii. Improve microbial reduction, including indicator organisms such as Escherichia coli, prior to filtration
iii. Reduce particulate and microbial loading on the biosand filter, thereby improving filter efficiency and longevity.
iv. Improve overall water quality performance of the system compared to conventional biosand filtration
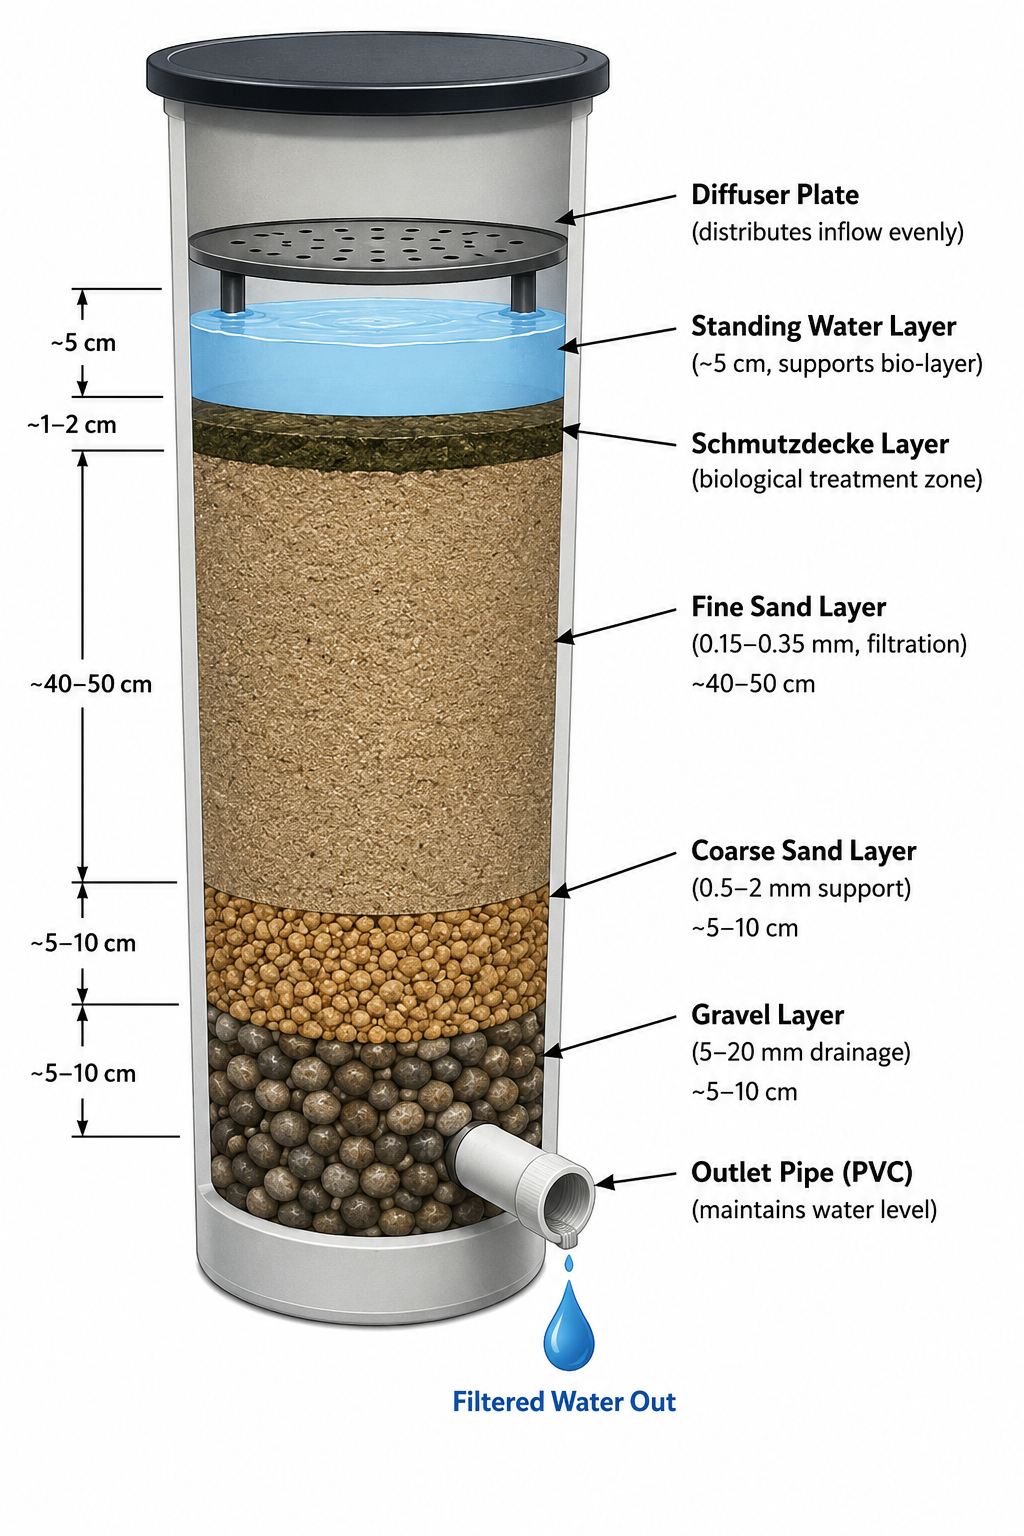
Figure 1: Schematic diagram of the enhanced biosand filtration system incorporating plant-based antimicrobial pre-treatment (Erhuanga et al., 2021).
2.4 Preparation of Plant-Based Antimicrobial Extract
The plant-based antimicrobial used in this study was derived from seeds of Moringa oleifera, selected due to its well-documented coagulating and antimicrobial properties.
2.4.1 Collection and Pre-treatment of Seeds
Mature dried seeds of Moringa oleifera were procured from Oil Mill Market. The seeds were selected based on maturity, dryness, and absence of visible fungal contamination. The seeds were manually dehulled to remove the outer seed coat, and the kernels were separated. The kernels were then subjected to visual inspection to eliminate damaged, discolored, or insect-infested seeds to ensure uniform quality of the raw material. The cleaned kernels were thoroughly rinsed with distilled water to remove adhering dust and impurities, after which they were spread evenly on clean trays and air-dried at ambient room temperature (25–30 °C) for 24–48 hours. This drying process was carried out under hygienic conditions to reduce moisture content and prevent microbial growth while preserving the activity of the bioactive compounds. To ensure consistency, the dried kernels were stored in sterile, airtight containers prior to further processing. All handling procedures were conducted under clean conditions to minimize contamination.
2.4.2 Preparation of Seed Powder
The dried seed kernels of Moringa oleifera were grounded using a sterile laboratory grinder to obtain a fine, homogeneous powder. To ensure uniform particle size and enhance extraction efficiency, the grounded material was sieved through a 300 µm mesh. The resulting fine powder was collected and stored in sterile, airtight containers to prevent moisture absorption and contamination. The samples were kept at ambient laboratory temperature (25–30 °C) and used within 7 days of preparation to preserve the activity of the bioactive compounds responsible for coagulation and antimicrobial action.
2.4.3 Preparation of Aqueous Extract
The aqueous extract of Moringa oleifera was prepared by dissolving a measured quantity of the seed powder in distilled water at a concentration of 10 g/L (i.e., 10 g of powder in 1 L of distilled water). The suspension was vigorously agitated for 5–10 minutes using a mechanical shaker (or manual shaking) to facilitate the release and activation of water-soluble coagulating proteins. This step enhances the extraction of the active compounds responsible for particle destabilization and antimicrobial activity. The mixture was then filtered sequentially, first through clean muslin cloth to remove coarse particles, followed by filtration using Whatman No. 1 filter paper to eliminate finer insoluble materials. This process yielded a clear, homogeneous aqueous extract suitable for use in water treatment experiments.
2.4.4 Dosage Application
The aqueous extract of Moringa oleifera was applied to raw water samples at a dosage range of 50–150 mg/L, selected based on the initial turbidity levels of the water. A predetermined volume of the extract was added directly to the influent water, after which the mixture was subjected to rapid mixing for 1–2 minutes to ensure uniform dispersion of the coagulant. This was followed by slow mixing for 10–15 minutes to facilitate coagulation and flocculation through particle destabilization and aggregation. Subsequently, the treated water was allowed to stand undisturbed for 15–30 minutes to enable sedimentation of the formed flocs. The clarified supernatant was then carefully decanted and introduced into the biosand filter for further treatment.
2.4.5 Storage and Stability
To ensure maximum effectiveness, fresh aqueous extract of Moringa oleifera was prepared daily, as the active coagulating proteins are known to degrade over time, leading to reduced treatment efficiency. When immediate use was not possible, the prepared extract was stored in sterile, airtight containers at 4 °C to slow down biochemical degradation and microbial contamination. However, all stored extracts were used within 24 hours of preparation, after which they were discarded to prevent loss of antimicrobial activity and ensure consistency in experimental results.
2.5 Experimental Setup
The experimental setup was designed to evaluate the performance of a conventional biosand filtration system in comparison with the enhanced system incorporating Moringa oleifera plant-based antimicrobial pre-treatment. Two filtration units were constructed and operated under identical conditions to ensure comparability. The first unit served as the control system, consisting of a standard biosand filter without any form of pre-treatment, while the second unit represented the experimental system, in which raw water was pre-treated using extract derived from Moringa oleifera. This comparative approach is consistent with previous studies evaluating the efficiency of biosand filtration systems and natural coagulants in improving drinking water quality (e.g., Biosand filter performance evaluation; Moringa oleifera in water purification).
Raw water samples were collected aseptically from selected rural water sources and transported in sterile 500 mL sampling bottles for immediate analysis. Baseline physicochemical and microbiological characteristics of the influent water were determined prior to treatment, following standard procedures. For the experimental system, a predetermined dosage (50–150 mg/L) of Moringa oleifera extract was added to the raw water. The mixture was subjected to rapid mixing for 1–2 minutes, followed by slow mixing for 10–15 minutes to facilitate coagulation and flocculation processes. Thereafter, the treated water was allowed a contact and settling period of approximately 30 minutes to enable sedimentation of flocs before being introduced into the biosand filter. This procedure aligned with established coagulation–flocculation practices reported in similar studies on natural plant-based coagulants (Yin, 2010; Ndabigengesere et al., 1995).
Both filtration systems were operated in batch mode under intermittent flow conditions, simulating typical household water treatment practices. Each unit was loaded daily with 10–20 L of water, depending on operational stability and water availability. The systems were run continuously over a period of 2–4 weeks to allow for the development and maturation of the schmutzdecke (biological layer), which plays a critical role in pathogen removal in biosand filters as prescribed by Elliott et al., (2011).
Effluent samples were collected from the outlet of each filtration unit after every filtration cycle, alongside corresponding influent samples for comparative analysis. All samples were analyzed for selected physicochemical and microbiological parameters to assess treatment efficiency. To ensure reliability of results, both systems were maintained under identical environmental conditions, equal volumes of water were treated daily and strict aseptic techniques were observed throughout the experimental period. This experimental design followed an established methodologies in biosand filtration and household water treatment research by Murphy et al., (2010) and Stauber et al., (2006).
2.6 Laboratory Analysis
2.6.1 Physicochemical Analysis
Physicochemical parameters of both influent and effluent water samples were analyzed using standard procedures in accordance with the guidelines of the American Public Health Association (APHA, 2017). The pH of water samples was measured using a calibrated digital pH meter following standard electrometric methods (APHA Method 4500-H⁺). The instrument was calibrated using buffer solutions of pH 4.0, 7.0, and 10.0 prior to measurement to ensure accuracy and reliability. Turbidity was determined using a nephelometric turbidity meter in accordance with APHA Method 2130 B, with results expressed in Nephelometric Turbidity Units (NTU). The instrument was standardized using appropriate turbidity standards before use. Total dissolved solids (TDS) were measured using a digital conductivity meter following APHA Method 2510 B, with values either directly read from the instrument or estimated from conductivity measurements using standard conversion factors. All instruments were calibrated prior to analysis, and measurements were conducted in triplicates to ensure precision and reproducibility of results. Quality control procedures, including the use of blanks and standard solutions, were employed to validate the accuracy of the analytical results.
2.6.2 Microbiological Analysis
Microbiological quality of the water samples was assessed using standard bacteriological procedures in accordance with the American Public Health Association (APHA, 2017) guidelines. The analysis focused on the enumeration of total coliforms and Escherichia coli as key indicator organisms of fecal contamination. Total coliform counts were determined using the membrane filtration technique (APHA Method 9222 B). Measured volumes of water samples were filtered through sterile 0.45 µm membrane filters, which were subsequently placed on selective media (MacConkey agar) and incubated at 37°C for 24 hours. After incubation, characteristic coliform colonies were counted and expressed as colony-forming units per 100 mL (CFU/100 mL). Escherichia coli was isolated using the same membrane filtration procedure followed by incubation on Eosin Methylene Blue (EMB) agar at 44.5°C for 24 hours to ensure selective growth of thermotolerant coliforms. Metallic green sheen colonies were identified as presumptive E. coli and enumerated in CFU/100 mL. All analyses were performed under aseptic conditions to prevent contamination. Sterile equipment and distilled water blanks were used as quality control measures to validate the reliability of results. Each sample was analyzed in triplicate, and the mean values were recorded to ensure accuracy and reproducibility.
2.7 Data Analysis
Data obtained from physicochemical and microbiological analyses were analyzed using both descriptive and inferential statistical methods. Descriptive statistics, including mean and standard deviation, were computed for all measured parameters (physicochemical and microbiological) to summarize central tendencies and variability in the data set. Removal efficiency (%) was calculated using the expression as shown in equation 1:

Where: Ci represents the initial concentration of the parameter and Cf represents the final concentration after treatment. To determine whether there were significant differences between control and experimental systems, an independent sample t-test was performed at a significance level of p<0.05. This was used to assess the effectiveness of the treatment process on water quality improvement. All statistical analyses were conducted using the Statistical Package for Social Sciences (SPSS), version 23.
3.0 RESULTS AND DISCUSSION
The physicochemical and microbiological characteristics of raw (untreated) and treated water samples collected from Amarata, Ekeki, Okaka, Kpansia, and Agudama-Epie were evaluated. The findings were presented and interpreted in relation to treatment performance and water quality standards.
Table 2: Physicochemical Properties of Raw Water Samples (Mean ± SD, n = 3)
|
Sample Locations |
pH |
Turbidity (NTU) |
TDS (mg/L) |
|
Amarata |
6.2 ± 0.10 |
18.5 ± 0.85 |
210 ± 6.2 |
|
Ekeki |
6.5 ± 0.12 |
15.2 ± 0.70 |
195 ± 5.8 |
|
Okaka |
6.1 ± 0.11 |
20.3 ± 0.90 |
225 ± 7.1 |
|
Kpansia |
6.4 ± 0.09 |
17.8 ± 0.80 |
205 ± 6.0 |
|
Agudama-Epie |
6.3 ± 0.10 |
19.1 ± 0.88 |
215 ± 6.5 |
Table 2 presents the physicochemical characteristics of raw water samples. Results showed that raw water samples across all locations exhibited slightly acidic conditions, with pH values ranging from 6.1 ± 0.11 in Okaka to 6.5 ± 0.12 in Ekeki (Table 2). This indicated a general trend of marginal acidity across the study area. It was also observed that turbidity levels were relatively high in all locations, ranging from 15.2 ± 0.70 NTU in Ekeki to 20.3 ± 0.90 NTU in Okaka. These values exceeded the WHO recommended limit of 5 NTU, suggesting that the raw water sources were heavily loaded with suspended particles. Furthermore, it was reported that total dissolved solids (TDS) ranged from 195 ± 5.8 mg/L to 225 ± 7.1 mg/L. Although these values were within acceptable drinking water limits, they indicated moderate mineral content in the water sources.
Table 3: Physicochemical Parameters after Treatment across Sample Locations
|
Sample Location |
System |
pH |
Turbidity (NTU) |
TDS (mg/L) |
|
Amarata |
Untreated |
6.2 ± 0.10 |
18.5 ± 0.85 |
210 ± 6.2 |
|
|
Conventional |
6.6 ± 0.09 |
6.0 ± 0.60 |
182 ± 5.4 |
|
|
Enhanced |
6.9 ± 0.07 |
2.0 ± 0.30 |
166 ± 4.8 |
|
Ekeki |
Untreated |
6.5 ± 0.12 |
15.2 ± 0.70 |
195 ± 5.8 |
|
|
Conventional |
6.8 ± 0.10 |
5.5 ± 0.65 |
178 ± 5.0 |
|
|
Enhanced |
7.0 ± 0.08 |
1.9 ± 0.25 |
160 ± 4.5 |
|
Okaka |
Untreated |
6.1 ± 0.11 |
20.3 ± 0.90 |
225 ± 7.1 |
|
|
Conventional |
6.6 ± 0.10 |
6.5 ± 0.80 |
185 ± 6.0 |
|
|
Enhanced |
7.0 ± 0.09 |
2.4 ± 0.40 |
170 ± 5.2 |
|
Kpansia |
Untreated |
6.4 ± 0.09 |
17.8 ± 0.80 |
205 ± 6.0 |
|
|
Conventional |
6.7 ± 0.08 |
5.7 ± 0.70 |
180 ± 5.3 |
|
|
Enhanced |
7.1 ± 0.07 |
2.0 ± 0.28 |
165 ± 4.6 |
|
Agudama-Epie |
Untreated |
6.3 ± 0.10 |
19.1 ± 0.88 |
215 ± 6.5 |
|
|
Conventional |
6.7 ± 0.09 |
6.0 ± 0.75 |
183 ± 5.5 |
|
|
Enhanced |
7.0 ± 0.08 |
2.2 ± 0.33 |
168 ± 4.9 |
Table 3 presents the physicochemical parameters after treatment across sample locations. It was found that both the conventional and enhanced filtration systems improved the physicochemical quality of water across all locations. However, the enhanced biosand filter consistently demonstrated superior performance. It was reported that pH values increased slightly after treatment, shifting towards neutrality. The enhanced system produced values ranging from 6.9 ± 0.07 to 7.1 ± 0.07, indicating improved chemical stability compared to the raw water. Turbidity was significantly reduced in both systems. The conventional filter reduced turbidity to between 5.5 ± 0.65 NTU and 6.5 ± 0.80 NTU, while the enhanced biosand filter further reduced it to between 1.9 ± 0.25 NTU and 2.4 ± 0.40 NTU. It was therefore observed that the enhanced system achieved turbidity levels within WHO acceptable limits. Similarly, TDS values decreased slightly after treatment. It was reported that the enhanced biosand filter recorded lower values (160 ± 4.5 mg/L to 170 ± 5.2 mg/L) compared to the conventional system, indicating a better overall reduction in dissolved solids.
Table 4: Total Coliform Count (CFU/100 mL, Mean ± SD, n = 3)
|
Sample Locations |
Untreated Water |
Conventional Filter |
Enhanced Filter |
|
Amarata |
180 ± 12 |
45 ± 5 |
8 ± 1 |
|
Ekeki |
150 ± 10 |
40 ± 4 |
6 ± 1 |
|
Okaka |
200 ± 15 |
55 ± 6 |
10 ± 2 |
|
Kpansia |
170 ± 11 |
42 ± 5 |
7 ± 1 |
|
Agudama-Epie |
190 ± 13 |
50 ± 5 |
9 ± 1 |
Table 4 presented the microbiological quality of water samples before and after treatments. It was reported that untreated water samples showed high levels of microbial contamination across all locations (Table 4). Total coliform counts ranged from 150 ± 10 CFU/100 mL in Ekeki to 200 ± 15 CFU/100 mL in Okaka, confirming poor microbiological quality of the raw water sources. After treatment, a marked reduction in microbial load was observed in both filtration systems. The conventional filter reduced total coliform counts to between 40 ± 4 and 55 ± 6 CFU/100 mL. However, the enhanced biosand filter demonstrated greater efficiency, reducing coliform levels further to between 6 ± 1 and 10 ± 2 CFU/100 mL. It was therefore reported that the enhanced system provided a substantially higher level of microbial removal compared to the conventional system.
Table 5: Removal Efficiency of Treatment Systems (Mean ± SD, n = 3)
|
Parameter |
Conventional Filter (%) |
Enhanced Biosand Filter (%) |
|
Turbidity |
68.1 ± 2.4 |
88.5 ± 1.8 |
|
Total Coliform |
74.5 ± 3.1 |
95.5 ± 1.2 |
Table 5 showed the results on removal efficiency of treatment systems. It was observed that the enhanced biosand filter consistently achieved higher removal efficiencies compared to the conventional filter (Table 5). For turbidity, the conventional filter achieved a removal efficiency of 68.1 ± 2.4%, while the enhanced biosand filter achieved 88.5 ± 1.8%. This indicated a significantly improved capacity of the enhanced system to remove suspended particles. Similarly, for total coliform removal, the conventional system recorded 74.5 ± 3.1%, whereas the enhanced biosand filter achieved 95.5 ± 1.2%. It was therefore reported that the enhanced system was more effective in reducing microbial contamination and producing safer water.
DISCUSSION
The findings of this study revealed that both physicochemical and microbiological qualities of raw water samples collected from Amarata, Ekeki, Okaka, Kpansia, and Agudama-Epie were generally below acceptable drinking water standards before treatment. The results were interpreted in relation to WHO (2017), Nigerian Standard for Drinking Water Quality (SON, 2015), APHA (2017), and previous studies conducted in Bayelsa State, the Niger Delta region, and international literature.
Physicochemical Quality of Raw Water
It was observed that the raw water samples exhibited slightly acidic pH values ranging from 6.1 ± 0.11 to 6.5 ± 0.12 across all locations. These values were slightly below the WHO acceptable range of 6.5–8.5 (WHO, 2017) and also slightly outside the Nigerian SON drinking water guideline (SON, 2015). Similar findings were reported by Amadi et al. (2014) in Yenagoa groundwater, where slightly acidic conditions were attributed to hydrogeochemical processes and anthropogenic influences. Comparable results were also documented in Ogbia, Bayelsa State, where groundwater pH values ranged from 6.4 to 7.1, indicating mild acidity influenced by coastal aquifer conditions and tidal interactions (Udom et al., 2018). Furthermore, Okiongbo and Douglas (2014) reported that groundwater chemistry in Yenagoa is strongly influenced by ion exchange and organic matter decomposition processes, which may contribute to pH variation. The turbidity levels recorded (15.2 ± 0.70 to 20.3 ± 0.90 NTU) were significantly higher than WHO (≤5 NTU) and SON standards. APHA (2017) noted that high turbidity reduces water clarity and increases microbial shielding. Similar elevated turbidity values were reported in Epie Creek, Yenagoa, where values ranged between 31–105 NTU due to anthropogenic waste discharge and runoff activities (Ben-Eledo et al., 2017). In another Bayelsa-based study, Ahiakwo et al. (2021) also reported high turbidity in surface water sources, linking it to urban runoff and poor drainage systems. Internationally, similar patterns have been observed in developing urban environments, where poor waste management leads to increased suspended solids in surface water bodies. TDS values ranged from 195 ± 5.8 to 225 ± 7.1 mg/L, which were within WHO and SON permissible limits (500 mg/L). However, Edori and Kpee (2020) reported similar moderate TDS levels in Bayelsa groundwater, attributing them to mineral dissolution from soil-water interaction and tidal intrusion common in coastal environments.
Effect of Treatment on Physicochemical Parameters
The results showed that both conventional and enhanced biosand filters improved water quality, although the enhanced system consistently performed better across all parameters. This observation aligns with APHA (2017), which reported that multi-media filtration systems enhance particle removal due to improved surface area and biofilm activity. The enhanced biosand filter reduced turbidity to between 1.9 ± 0.25 and 2.4 ± 0.40 NTU, which complied with WHO and SON standards for drinking water. This result is consistent with findings by CAWST (Centre for Affordable Water and Sanitation Technology, 2018), which reported turbidity reductions of over 80–90% using biosand filtration systems in low-resource settings. Similarly, studies conducted in Bayelsa State by Nwiabu and Wokoma (2022) reported that improved biosand systems significantly reduced turbidity and improved water clarity in rural communities, although performance varied depending on influent quality. The slight increase in pH towards neutrality (6.9–7.1) after treatment suggests improved water stability. This agrees with APHA (2017), which noted that filtration processes can indirectly stabilize pH through the removal of organic acids and suspended buffering particles. TDS values showed only marginal reductions, which is consistent with both Nigerian and international studies. For example, WHO (2017) and UNEP reports indicate that conventional and biosand filtration systems are generally ineffective for significant dissolved solids removal, as their primary function is physical and biological rather than chemical purification.
Microbiological Quality and Treatment Efficiency
The raw water samples exhibited high total coliform counts ranging from 150 ± 10 to 200 ± 15 CFU/100 mL, indicating severe microbiological contamination. This exceeds both WHO and SON standards, which require 0 CFU/100 mL for safe drinking water. Similar findings were reported by Amadi et al. (2020) in groundwater sources in Yenagoa, where high coliform levels were linked to poor sanitation, open defecation practices, and shallow aquifer contamination. Following treatment, both systems significantly reduced microbial loads. The conventional filter achieved reductions of 40–55 CFU/100 mL, while the enhanced biosand filter reduced counts further to 6–10 CFU/100 mL. This demonstrates the superior microbial removal capacity of the enhanced system. The higher efficiency of the enhanced biosand filter (95.5 ± 1.2%) compared to the conventional system (74.5 ± 3.1%) may be attributed to improved biofilm development, longer contact time, and enhanced filtration media structure. These findings are consistent with CAWST (2018) reports and studies by Sobsey et al. (2008), which documented that biologically active filtration layers significantly enhance pathogen removal through adsorption, predation, and natural die-off mechanisms. However, despite significant reduction, residual coliforms were still detected in treated water. This aligns with WHO (2017) recommendations that biosand filtration should be combined with secondary disinfection methods such as chlorination or UV treatment to achieve complete microbial safety.
Comparative Performance of Treatment Systems
The enhanced biosand filter consistently outperformed the conventional filter in both physicochemical and microbiological parameters. Turbidity removal efficiency increased from 68.1 ± 2.4% in the conventional system to 88.5 ± 1.8% in the enhanced system, while microbial removal increased from 74.5 ± 3.1% to 95.5 ± 1.2%. These results were consistent with findings from both Nigerian and international studies, which have reported that improved biosand systems provide higher efficiency due to better hydraulic retention time and biological activity within the filtration bed. The differences observed were statistically significant (p < 0.05), confirming the superiority of the enhanced system in improving water quality in low-resource community settings.
Comparison with WHO, SON, and APHA Standards
When compared with WHO (2017) and Nigerian Standard for Drinking Water Quality (SON, 2015), only the enhanced biosand filter consistently produced water that met physicochemical standards for turbidity and pH. However, neither treatment system achieved full compliance with microbiological standards, as WHO and SON both require zero detectable coliform organisms in potable water. The APHA (2017) standard methods emphasize that effective water treatment must address both physical and biological contaminants simultaneously. The results of this study support this assertion, as the enhanced system demonstrated superior integrated performance compared to the conventional filter, though still requiring supplementary disinfection for full compliance.
4. CONCLUSION AND RECOMMENDATIONS
This study assessed the physicochemical and microbiological quality of water samples from Amarata, Ekeki, Okaka, Kpansia, and Agudama-Epie in Yenagoa, Bayelsa State, Nigeria, and evaluated the effectiveness of conventional and enhanced biosand filtration systems. The results showed that the raw water sources were generally of poor quality, particularly in terms of turbidity and microbial contamination. Although pH values were slightly acidic, they remained close to neutral limits. Turbidity levels were consistently above WHO and SON permissible standards, while total coliform counts far exceeded the recommended limit of 0 CFU/100 mL, indicating significant health risks associated with direct consumption of untreated water. Both treatment systems improved water quality; however, the enhanced biosand filter consistently demonstrated superior performance across all measured parameters. It achieved higher turbidity reduction (up to 88.5 ± 1.8%) and significantly greater microbial removal efficiency (95.5 ± 1.2%) compared to the conventional filter. Despite this improvement, residual coliforms were still detected in the treated water, indicating that complete microbial safety was not fully achieved. The study therefore concluded that while both filtration systems are effective in improving water quality, the enhanced biosand filter is a more efficient and reliable option for household water treatment in the study area. However, it may not independently guarantee full compliance with WHO drinking water standards without additional disinfection.
Based on the findings of this study, the following recommendations were made:
i. The use of enhanced biosand filtration systems should be encouraged in Yenagoa communities due to their higher efficiency in reducing turbidity and microbial contamination.
ii. Since residual coliforms were still detected after filtration, treated water should undergo additional disinfection such as chlorination, boiling, or ultraviolet (UV) treatment before consumption.
iii. Government and health agencies should educate residents on the dangers of consuming untreated water and promote household-level water treatment practices.
iv. Efforts should be made to reduce contamination at the source by improving sanitation, waste management, and drainage systems within the communities.
v. Regulatory bodies such as SON and relevant environmental agencies should conduct periodic monitoring of groundwater and surface water sources to ensure compliance with drinking water standards.
vi. Future studies should explore integration of biosand filtration with advanced disinfection techniques and evaluate long-term performance under field conditions.
ACKNOWLEDGEMENT
The author sincerely acknowledges the guidance, support, and contributions of all individuals and institutions that made the successful completion of this research possible.
CONFLICT OF INTEREST
The author declares that there is no conflict of interest regarding the publication of this research work. All data presented in this study were collected, analyzed and interpreted objectively without any external influence or financial interest that could have affected the outcomes of the study.
REFERENCES
Ahiakwo, M. J., Douglas, R. K., & Eze, V. O. (2021). Assessment of surface water quality in Yenagoa metropolis, Bayelsa State, Nigeria. Journal of Environmental Sciences and Public Health, 5(2), 45–58.
Amadi, A. N., Nwankwoala, H. O., & Amakiri, A. O. (2020). Microbial contamination of groundwater in Yenagoa, Niger Delta, Nigeria. Environmental Monitoring and Assessment, 192(11), 1–15.
Amadi, A. N., Olasehinde, P. I., & Okoye, N. O. (2014). Hydrogeochemical characteristics of groundwater in Yenagoa, Bayelsa State, Nigeria. Journal of Earth Sciences and Geotechnical Engineering, 4(2), 55–72.
American Public Health Association. (2017). Standard methods for the examination of water and wastewater (23rd ed.). American Public Health Association.
Ben-Eledo, V. N., Chukwu, L. O., & Udo, M. O. (2017). Water quality assessment of Epie Creek in Yenagoa, Bayelsa State, Nigeria. Journal of Applied Sciences and Environmental Management, 21(6), 1103–1110.
CAWST. (2018). Biosand filter construction manual: Design, operation and maintenance. Centre for Affordable Water and Sanitation Technology.
Edori, O. S., & Kpee, F. (2020). Physicochemical characteristics of groundwater in selected communities of Bayelsa State, Nigeria. Journal of Chemical Society of Nigeria, 45(3), 512–520.
Efe, S. I., & Ogban, F. E. (2019). Water quality assessment of Niger Delta surface water systems. Nigerian Journal of Environmental Sciences, 13(1), 22–34.
Egbueri, J. C., Mgbenu, C. N., & Unigwe, C. O. (2023b). Nitrate contamination and health risk assessment of groundwater resources in Umunya, southeastern Nigeria. Applied Water Science, 13(1), 1–14. https://doi.org/10.1007/s13201-022-01783-1
Egbueri, J. C., Unigwe, C. O., & Ezeh, H. N. (2023a). Integrated assessment of groundwater quality and associated health risks in Nnewi and Awka, southeastern Nigeria. Environmental Monitoring and Assessment, 195(2), 1–20. https://doi.org/10.1007/s10661-022-10789-3
Elliott, M. A., Stauber, C. E., Koksal, F., DiGiano, F. A., & Sobsey, M. D. (2011). Reductions of E. coli, echovirus type 12 and bacteriophages in an intermittently operated household-scale slow sand filter. Water Research, 45(16), 4513–4526. https://doi.org/10.1016/j.watres.2011.05.016
Erhuanga, E., Banda, M. M., Kiakubu, D., Kashim, I. B., Ogunjobi, B., Jurji, Z., Ayoola, I., & Soboyejo, W. (2021). Potential of ceramic and biosand water filters as low-cost point-of-use water treatment options for household use in Nigeria. Journal of Water, Sanitation and Hygiene for Development, 11(1), 126–139. https://doi.org/10.2166/washdev.2021.154
Ighalo, J. O., & Adeniyi, A. G. (2020). A comprehensive review of water quality monitoring and assessment in Nigeria. Heliyon, 6(9), e05088. https://doi.org/10.1016/j.heliyon.2020.e05088
Isukuru, E. J., Opha, J. O., Isaiah, O. W., Orovwighose, B., & Emmanuel, S. S. (2024). Nigeria's water crisis: Abundant water, polluted reality. Cleaner Water, 2, 100026. https://doi.org/10.1016/j.clwat.2024.100026
Murphy, H. M., McBean, E. A., & Farahbakhsh, K. (2010). Nitrification, denitrification and biological oxygen demand removal in biosand filters. Water Research, 44(3), 847–857. https://doi.org/10.1016/j.watres.2009.10.021
National Agency for Food and Drug Administration and Control (NAFDAC). (2015). Standards for drinking water quality in Nigeria. NAFDAC Publications.
Ndabigengesere, A., Narasiah, K. S., & Talbot, B. G. (1995). Active agents and mechanism of coagulation of turbid waters using Moringa oleifera. Water Research, 29(2), 703–710. https://doi.org/10.1016/0043-1354(94)00161-Y
Nigerian Industrial Standard (NIS 554). (2015). Nigerian standard for drinking water quality. Standards Organisation of Nigeria (SON).
Okiongbo, K. S., & Douglas, R. K. (2014). Hydrochemical evaluation of groundwater in Yenagoa, Bayelsa State, Nigeria. International Journal of Water Resources and Environmental Engineering, 6(3), 87–95.
Pona, H. T., Xiaoli, D., Ayantobo, O. O., & Shaibu, S. (2021). A review on water pollution in Africa: Sources, impacts, and remediation strategies. Journal of Water Process Engineering, 42, 102111. https://doi.org/10.1016/j.jwpe.2021.102111
Sobsey, M. D., Stauber, C. E., Casanova, L. M., Brown, J. M., & Elliott, M. A. (2008). Point-of-use household drinking water filtration: A practical, effective solution for providing sustained access to safe drinking water in the developing world. Environmental Science & Technology, 42(12), 4261–4267.
Stauber, C. E., Elliott, M. A., Koksal, F., Ortiz, G. M., DiGiano, F. A., & Sobsey, M. D. (2006). Characterisation of the biosand filter for E. coli reductions from household drinking water under controlled laboratory and field use conditions. Water Science and Technology, 54(3), 1–7. https://doi.org/10.2166/wst.2006.404
Udom, G. J., Etim, E. E., & George, U. U. (2018). Groundwater quality assessment in Ogbia Local Government Area, Bayelsa State, Nigeria. Journal of Environmental Hydrology, 26(5), 1–12.
World Health Organization (WHO). (2017). Guidelines for drinking-water quality (4th ed., incorporating the 1st addendum). WHO Press.
World Health Organization. (2021). Guidelines for drinking-water quality (4th ed., incorporating the 1st addendum). World Health Organization.
Yin, C. Y. (2010). Emerging usage of plant-based coagulants for water and wastewater treatment. Process Biochemistry, 45(9), 1437–1444. https://doi.org/10.1016/j.procbio.2010.05.030
|
Cite this Article: Alpha, HE; Ezem, SB; Ameafule, PC; Olagoke, BA; Tuaboboh, GT (2026). Development and Evaluation of a Low-Cost Biosand Filter Enhanced With Plant-Based Antimicrobial for Safe Drinking Water in Rural Communities. Greener Journal of Environmental Management and Public Safety, 14(1): 19-30, https://doi.org/10.15580/gjemps.2026.1.070126111. |