Following the
processing of data from earthquakes in the area from 2016 to 2021, the
researchers discovered the following: The model developed specifically the
scale designed for characterization of the areas surrounding Nyamulagira (29.0°E-29.5°E; 1.2°S-1.5°S) and Nyiragongo (29.0°E-29.5°E; 1.45°S-1.75°S), is valid,
logical, and reasonable, as are the assumptions made. The concept of
"volume density" of earthquakes or seismic energy was introduced in
the the application of these hypotheses, along with
other parameters, has allowed the craters of these two volcanoes to be
located in accordance with field observations: the crater ofNyamulagira
volcanois located at [29.15°E; 1.35°
S] and the crater ofNyiragongo volcano is located at [29.25°E; 1.50° S].
Structures of Nyamulagira and Nyiragongo are
strikingly similar, indicating that Nyamulagira is
a subset of Nyiragongo, with the latter showing
particularly striking similarities in its Western crater. Structures of Nyamulagira and Nyiragongo are
strikingly similar, indicating that Nyamulagira is
a subset of Nyiragongo, with the latter exhibiting
particularly striking similarities in its Western crater.
The similarity
rate between the two is 75%, based on structural factors shared by Nyiragongo and Nyamulagira. Nyiragongo has a 25% singularity. Justified by its
extremely complex shape (stratovolcano with a
crater made up of three platforms,). With a few exceptions, there is a
correlation between minimum volume density of energy and maximum volume
density of the number of earthquakes at the same location for both Nyamulagira and Nyiragongo, and
the characterization around the craters according to quadrants notes that the
degree of heterogeneity is 100% for Nyamulagira, as
opposed to 75% for Nyiragongo, with high activity
on the left (West).
Findings indicate
that the magma reservoirs of the volcanoes are predominantly spherical for Nyamulagira and cylindrical for Nyiragongo.As a result, the geological characteristics
in the area have been highlighted by this model; the geological implications
of this model can be used for geological prospecting.
These results,
and others above, show that the structure of the Nyamulagira
Volcano is a substructure of (included in) the Nyiragongo.
It would be necessary to confirm the hypotheses suggestedearlier. Besides, this necessitates
the expansion or continuation of research into other areas with
volcanic-seismic activity. We note that the model effectively compares
various structures with seismo-volcanic activity.
The East African Rift System is described as
a continental extension of the global system of lithospheric fractures that run
across the Atlantic and Indian Oceans and into the eastern half of the African
continent via the Gulf of Aden and the Red Sea (Mukange,
2016; Boden et al. 1988; Bantidi,
2014a).
This fracture
system has two branches, specifically: - The eastern branch, which originates
in the Afar triangle and travels across Ethiopia and Kenya to the northern
Tanzanian divergence (Figure 1; Mukange, 2013).
The western branch
is made up of a network of fractures that span the Great Lakes daisy chain,
from Lake Albert (617 m) to Lake Edward (912 m), Lake Kivu (1462 m), Lake
Tanganyika (780 m), Lake Rukwa (782 m), Lake Malawi
(460 m), and south to Mount Beira in Mozambique and south-west to Lake Kariba, Zimbabwe .This branch thus encompasses
the majority of the Eastern provinces of the DRC between latitudes 4°N and 8°S.
The East African
Rifts are more than 6,000 km long and 40–60 km broad, extending from the Red
Sea to the Zambezi. The Aswan Lineament is where the two branches separate, and Lake Malawi is where they converge (Figure
1).The "Congolese craton," or the entire
Congolese basin, is affected by the typical intra-plate cracks that are part of
the DRC's seismic activity.
Figure 1 : Major
faults in the East African Rift System are represented as solid lines, with the
oceans being blue and the volcanoes being red.
The Congolese Rift has
three main volcanic provinces: Toro-Ankole Province
in the north, Virunga Province (Nyiragongo,
Nyamulagira volcanoes) in the center, and South Kivu
Province in the south. Basin boundary faults are typically normal, and the
volcanic provinces (Figure 2) are located in the inter-basin zones (Wafula and al, , 2009).
Figure 2 : The
volcanic region of the Virungas is located in the exterme North of Lake Kivu.
Eight volcanoes make
up this area, which is separated into three groups known as volcanic provinces.
The eastern group, which includes the Muhavura, is
comprised of these volcanoes (4127 m),
The eastern group consists of Nyiragongo (3470
m) and Nyamulagira, while the middle group consists
of Visoke (3911 m), Karisimbi
(4506 m), and Mikeno (4437 m). The western group
consists of Muhavura (4127 m), Gahinga
(3474 m), and Sabinyo (3647 m) (3056 m).
Except for the brief eruption of Mugogo on
August 1, 1957, the volcanoes in the first two subgroups are dormant at the
moment. Mugogo, which is 11 kilometers to the north
of Visoke and sits at a height of 2350 meters, is
regarded as a satellite cone of the latter (Visoke).
The western group of volcanoes, particularly Nyamulagira
with its frequent eruptions (on average every two years), and Nyiragongo with its permanent lava lake in the center
crater, are among the most active in the world today (Wafula,
1999,2011; Zana,1977)
Additionally, it should be noted that Nyiragongo
is regarded as one of the most dangerous volcanoes on Earth due to its
proximity to the city of Goma (15 km from the crater,
with an estimated population of over one million) and the superfluidity
of its lava, which can flow at speeds of up to 40 km/h (Wafula,
thesis).
In the same area of the Rift Valley cracks, both volcanoes are situated
(Figure 3).
Despite the fact that Nyiragongo and Nyamulagira volcanoes are just 13 km apart (figure 3) Both
the chemical composition of their lavas and the way in which they erupt show remarkabledifferences.
Basalts, which are
abundant in alkaline elements and have a high concentration of potassium, make
up the volcanic rocks of these two volcanoes and are the reason why lavas are
so fluid.
These two volcanoes' volcanic activity is of
the Hawaiian variety, characterized by an effusive and passive emission of lava
that has a low viscosity (100–1000 poise) and a very high temperature (1000°C).
There are three other similar volcanoes in the
world: Erta Alee in Ethiopia, Mount Erebus in the
Arctic, and Kilauea in the Pacific. Similar to the Redoubt volcano in Alaska,
the Virunga region's seismograms are classified as
type A (4-10 Hz), type B (1-4 Hz), and type C (peak at
2.6 and 8 Hz) based on frequency.
Along with tremors
(1-2 Hz), earthquakes are recorded (Wafula, 2009. Nyiragongo's final eruption occurred on May 22, 2021, while
Nyamulagira's last eruption occurred on April 18,
2018.
The seismic structure
near the Nyiragongo and Nyamulagira
volcanoes has been categorically described in recent papers (Mukange, 2023a-b).
In short, the current
work compares the two structures to identify their similarities and
differences.
2. DATA ANALYSIS ANDMETHOD
2.1. Data analysis
TheVolcanological Observatory of Goma
(VOG) collected the basic data for the Nyiragongo and
Nyamulagira volcanoes throughout the time period
2016–2021 in the region between 29.00°E and 29.50°E longitude and 1.20°S and
1.75°S latitude (Figure 3).
Prior surveys were conducted on the volcanoes Nyamulagira (29.0°E-29.5°E; 1.2°S-1.5°S) and Nyiragongo (29.0°E-29.5°E; 1.45°S-1.75°S), separately (Mukange, 2023a-b).
Figure 3 shows seismic
activity and geological structure following the eruption of the Nyamulagira volcano in 1981.
- Tiny solid circle: Earthquake of Type (A).
- Tiny open circle: Earthquake with low frequency.
- The solid triangle indicates the volcano's eruptive sites of 1976, MR: Murara cone, and HR: Harakandi
cone.
- The sizable solid circle indicates the 20 November 1990 earthquake,
which had a magnitude of 4.5.
- RG: The 1981 Nyamulagira volcanic cone (Rugarambiro).
- RUG: Temporary Seismographic Station Rugarambiro
More than 1,300 volcanoes serve as a marker for the planet's underlying
activity. They are generally all engaged.
One of the most active volcanoes in Africa is Nyamulagira, which is located in the Democratic Republic of
the Congo (DRC). It is a volcano in the Great Rift Valley's western branch and
a part of the Virunga Mountains. The internal
activity of the globe is marked by more than 1,300 volcanoes. A majority of
them are engaged.
One of Africa's most active volcanoes is Nyamulagira
in the Democratic Republic of the Congo (DRC). It is a volcano on the western
branch of the Great Rift Valley and a part of the Virunga
Mountains. The Nyamulagira volcano is surrounded by
the towns of Burungu in the northwest, Nyiragongo in the south-southeast, Lake Kivu in the south
by 25 kilometers, and Sake in the southwest. The Nyamulagira
volcano rises to a height of 3058 meters, and its peak caldera measures 2.3
kilometers in length and two kilometers in width.
In contrast to its close neighbor, the Nyiragongo
volcano, the Nyamulagira volcano's slopes, which are
typical of shield volcanoes, are not particularly steep and give the volcano a
volume of 500 km3. These slopes are broken up by fissures and scoria cones, and
1500 km2 of basaltic lava flows with a high potassium
content cover them. These lava flows are exceptionally long and extensive,
sometimes extending for up to 30 kilometers.
On the south-eastern flank of the caldera, a strikingly enormous fissure
runs in the direction of (NNW-SSE).
The Nyamulagira volcano is thought to be
weakest along this fissure. So, of the Nyamulagira
and Nyiragongo volcano fields, it is the most active
zone. The magma chamber's accumulation of magma is what causes the earthquakes
that are caused by the Nyamulagira volcano.
Numerous micro-earthquakes (tremors) caused by ruptures in compacted
rock or the degassing of magma are captured by seismographs.
A sign that Nyamulagira is about to awaken and
that an eruption is about to occur is the progressive rise of the hypocentres (related to the rise of magma).
As a shield volcano, Nyamulagira produces
polygenic lava because it possesses hot and fluid magmas that enable a
two-phase conviction that keeps the chimney from shutting by solidifying the
material.
The Nyamulagira volcano has the ability to
emit tens of millions of cubic meters of lava in a single eruption in the form
of flows that can travel more than 20 kilometers from the source of emission,
notably by obliterating everything in their path. The wind can carry the
volcanic products released, such as slag, volcanic ash, Pelee's
hair, etc., over considerable distances, burning and contaminating meadows,
farms, and river waters.
Three volcanoes make up the Nyiragongo volcano complex, which is aligned in a
north-south direction: Baruta (3,100 m) in the north,
Nyiragongo main cone (29, 25°E, 1.50°S, 3,470 m) in the middle, and Shaheru
(2,800 m) in the south (Figure 4).
The shape of Nyiragongo
is comparable to that of a stratovolcano, which is a
volcano with an undulating shape and a layered structure caused by the accumulation
of volcanic elements making up the cone (Simkin et
al., 1981).
Because of the lake that was discovered in
1928, the Nyiragongo volcano is well recognized (Tazieff, 1977; Hamaguchi et al.,
1982).
The three platforms that made up the Nyiragongo crater up until 1977 were as follows: the top
platform was 180 meters away, the second was 180 meters below it, and the third
was 60 meters below.
Since the level of this
lava lake was continually changing, by December 5, 1976, it had reached the
first platform's critical level (Pouclet, 1973, Tazieff, 1977).
Seismic anomalies that are fairly spectacular frequently occur before
the volcanic eruptions of Nyiragongo and Nyamulagira.Finding anomalies can help us find signs of
impending eruptive activity by revealing features.
Additionally, because both volcanoes are part of a very active tectonic
system, the local seismic activity has a significant effect on how they behave.
The eruptive activity and its impact go hand in hand.
Furthermore, the eruptive activity of one volcano may have an impact on
the activity of another volcano.
Figure 4: Depth distribution (North-South) of the volcanic earthquakes
in Figure (3).
Even though the volcanoes Nyiragongo and Nyamulagira are just 13 km apart
(Fig. 4-5), their lava's chemical composition and eruption mechanisms differ
noticeably (Wafula).
Figure 5: View from the West of Nyiragongo (left) and Nyamulagira
(right) volcanoes.
The eruptions of the Nyamulagira
volcano are a real disaster for the Virunga National
Park, with the loss of many animals and the destruction of large areas.
The plume of smoke and dust emitted during
each eruption can rise into the atmosphere to the base of the stratosphere, hindering
air navigation and causing damage to aircraft if they are not warned to avoid
the area affected by this volcanic cloud.
Since 1980, the Nyamulagira
volcano has erupted on average every two years. Since the beginning of the last
century, the Nyamulagira volcano has erupted more
than 30 times on its flanks with lava flows
2.2. Méthod of analysis
2.2.1.Presentation of previous results
As the foundation for
any characterization, previous research on the two volcanoes has produced the following
seismic species (Table 1-2 and Figures 6-10). I strongly suggest reading the
previously stated works in order to properly comprehend this study (see
references).
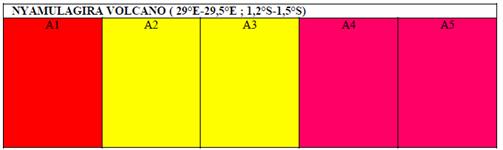
Table 1 :lists the color code,
seismic species, and seismic level for each sub-zone in the Nyamulagira
region.
Sub-areas
Seismicspecies
Seismiclevel
Colour
code
A1
IIIbc
7
Light red
A2
Ibc
4
yellow
A3
Ibc
4
yellow
A4
Iab
1
Pink
A5
Iab
1
Pink
B1
IIIbb
6
Orange
B2
Ibc
4
Yellow
B3
IIIbc
7
Light red
Table 2: Code des couleurs, espèce sismique et niveau sismiqueassociés à chaque sous-zone pour la région du
Nyiragongo.
Sub-areas
Seismicspecies
Seismiclevel
Colour
code
A1
IIIbb
6
orange
A2
Ibc
4
Yellow
A3
Ibc
4
Yellow
A4
Ibb
3
Light green
A5
Iac
2
Light blue
B1
Ibc
4
Yellow
B2
Iab
1
Pink
B3
IIIbc
7
Light red
Figure 6:Seismic
zoning map, vertical subdivision of the Nyamulagira
area.
Figure 7: Seismic zoning map, horizontalsubdivision
of the Nyamulagira area.
Table 3 :
degree of heterogeneity of the Nyamulagira volcano sub-areas
Sub-areas
Degree
of heterogeneity
Degree
of heterogeneity in %
Ai
3/5
60 %
Bj
3/3
100 %
Average
80%
Table 4 :
Overall degree of heterogeneity of the Nyiragongo
volcano sub-zones
Sub-areas
Degree
of heterogeneity
Degree
of heterogeneity in %
Ai
4/5
80 %
Bj
3/3
100 %
Average
90%
Figure
10a : caractérisation de l’activité sismique : carte de zonage
sismique de la zone Nyamulagira
Figure 10b :characterisation of seismic activity: seismic zoning map
ofNyiragongo
area
2.2.2.Standardization of seismic levels ,
modulusand of colourcode
It is essential to standardize these parameters
because the work was done independently with various seismic levels (Table
1-2), making it difficult to compare the results (Tables 5-6).
Table 5 :seismic
species, seismic levels andrelated
colors of two areasbeing investigated
NYIRAGONGO
NYAMULAGIRA
SUB-AREA
SEISMIC SPECIES
SEISMIC LEVEL
COLOUR CODE
SUB-AREA
SEISMIC SPECIES
SEISMIC LEVEL
COLOUR CODE
A1
IIIbb
6
Orange
A1
IIIbc
7
Light red
A2
Ibc
4
Vert
A2
Ibc
4
Green
A3
Ibc
4
Vert
A3
Ibc
4
Green
A4
Ibb
3
Violet
A4
Iab
1
Pink
A5
Iac
2
Bleu clair
A5
Iab
1
Pink
B1
Ibc
4
Vert
B1
IIIbb
6
Orange
B2
Iab
1
Rose
B2
Ibc
4
Green
B3
IIIbc
7
Rouge clair
B3
IIIbc
7
light red
D1
Ibb
3
Violet
D1
IIIbc
7
Light red
D2
IIIbb
6
Orange
D2
IIIbb
6
Orange
D3
Ibc
4
Vert
D3
Iab
1
Pink
D4
Ibc
4
Vert
D4
Ibc
4
Green
NB : For details of
sub-areas D1, D2, D3 and D4, see figures (24-25).
Table 6 : Modulus, quantum seismic
levels and grid-area colours (Cij)
of the twoareas being investigated.
NYIRAGONGO
NYAMULAGIRA
GRID-AREA Cij
MODULUS
QUANTUM LEVEL
COLOUR
GRID-AREA Cij
MODULUS
QUANTUM LEVEL
COLOUR
C11
9
5
YELLOW
C11
9
5
YELLOW
C12
7
4
GREEN
C12
7
4
GREEN
C13
8
4
GREEN
C13
7
4
GREEN
C14
7
4
GREEN
C14
6
3
PURPLE
C15
6
3
PURPLE
C15
6
3
PURPLE
C21
7
4
GREEN
C21
8
4
GREEN
C22
4
2
LIGHT BLUE
C22
6
3
PURPLE
C23
5
3
PURPLE
C23
6
3
PURPLE
C24
3
2
LIGHT BLUE
C24
4
2
LIGHT BLUE
C25
2
1
PINK
C25
4
2
LIGHT BLUE
C31
11
6
ORANGE
C31
10
5
YELLOW
C32
9
5
YELLOW
C32
8
4
GREEN
C33
10
5
YELLOW
C33
8
4
GREEN
C34
9
5
YELLOW
C34
7
4
GREEN
C35
8
4
GREEN
C35
7
4
GREEN
The results in the two tables above, particularly with
regard to the quantum level, can be achieved by using the table below. We
assign a quantum level and a color to each modulus slice.
Tableau
7 : Quantisation des modules et ode des couleurs
y associée
Module interval
(M)
Quantum level
Colour code
0<M≤2
1
PINK
2<M≤4
2
LIGHT BLUE
4<M≤6
3
PURPLE
6<M≤8
4
GREEN
8<M≤10
5
YELLOW
10<M≤12
6
ORANGE
Thus, the unification of the results through the use
of table (6) transforms figures (10) into figures (11 and 13) with their
corresponding structures in figures (12 and 14).
Figure 11 : Seismic
zoning map ofNyiragongo
area after standardisation
Below is the
corresponding geo-seismic signature
Figure 12 : Seismic
structure curve ofNyamulagira
area
Figure 13 :
Seismic zoning map ofNyiragongo area after standardization
Below is the corresponding geo-seismic signature.
Figure 14 : Seismic
structure curve ofNyiragongo
area
3.2. Discussion ofresults
Results fromNyamulagira
and Nyiragongo areaswill be compared byusing a
variety of parameters that were gathered in each area and are described above. These
include :
3.2.1. About seismic species
The results of the table(5)
are shown in the Venn diagrams below.
Figure 15a : Venn
diagram showing a comparison of seismic species.
It appears that all
species of Nyamulagira are included in the Nyiragongo. The latter has only two species (Iac and Ibb).These two species,
which are unique to Nyiragongo, were discovered in
vertical sub-areas A5 and A4, respectively (Table 5). So, in comparison to Nyamulagira, we may argue that these places behave in a particular
way. This peculiarity is also shown in figures (12) and 14,
where there is an excessively large gap between curves B2 and B3 (see point
3.2.3). Thus, it appears that Nyamulagira is a 67%
similar subset of Nyiragongo (four out of six species
are common)
According to the
structure factors (in seismic species indices), the above figure becomes
Figure 15b :
A Venn diagram is used to compare the structural factors of seismic species.
In terms of structural factors, it appears that only
the (ac) factor distinguishes the two volcanicareas; thus, the similarity is 75%. 25%
of Nyiragongo'speculiarity is justified by its extremely complex
shape (stratovolcano with a crater made up of three
platforms, .....)
3.2.2. On the zoning maps
and quantum level of the areas – grids.
On the zoning maps
and quantum level of the grid areas. The zoning maps and relatedquantum level
curves (Figures) reveal :
·A grouping of grid-zones (Cij),
based on colours, into four groups for the Nyamulagira zone (Table 8).
Table 8 : Color statistics for Nyamulagira
(module)
N°
COLOUR
AREAS-GRIDS
CONTRIBUTION(%)
1
PURPLE
C14, C15,
C22, C23
4/15 (27%)
2
BLUE
C24,C25
2/15 (13,3%)
3
GREEN
C12,C13,C21,C32,C33,C34,C35
7/15 (47%)
4
YELLOW
C11,C31
2/15 (13,3%)
·A grouping of grid areas (Cij),
based on colours, into six groups for the Nyiragongo zone (Table 9).
Table 9 :
Color statistics for Nyiragongo (module)
N°
COLOUR
AREAS-GRIDS
CONTRIBUTION(%)
1
PURPLE
C23,C15
2/15 (13,3%)
2
BLUE
C22,C24
2/15 (13,3%)
3
GREEN
C12,C13,C14,C21,C35
5/15 (33,3%)
4
YELLOW
C11,C32,C33,C34
4/15 (27%)
5
PINK
C25
1/15
(6,7%)
6
ORANGE
C31
1/15 (6,7%)
·The table
results (8-9) are depicted in the figure below.
Figure 16: A
comparison of the color weights of the Nyamulagira
and Nyiragongo areas.
The two curves in Figure (16) show that:
- Except for the purple color, the two structures are
nearly identical (same shape).
- The Nyiragongo structure
is stronger or more abundant than the Nyamulagira
structure because its curve is wider on the x-axis representing the color
spectrum.
- The proportion of blue color is the same in both
areas (intersection point at 13%).
- The proportion of blue color is the same in both
areas (intersection point at 13%), and there are green and purple
singularities; interestingly, these are the locations of the Nyiragongo and Nyamulagira
craters, respectively.
- What these two curves have in common is that they
all have a green peak. They all have a bell shape with a point of symmetry on
the abscissa, which is green. As a result, all of the green areas (Figures 11
and 13) for Nyiragongo and Nyamulagira
have the same structure. Let us now look at the quantum level curves derived
from the table (6):
Figure 17: Quantum
level ofNyamulagira and Nyiragongo
areas on the first line (B1i)
Figure 18 : Quantum level ofNyamulagira and Nyiragongo
areas on the second line (B2i)
Figure 19 : Quantum level ofNyamulagira and Nyiragongo
areas on the third line (B3i)
The observation of
these curves shows that :
·The first lines (Figure 17,11 and 13) of Nyiragongo and Nyamulagira are
80% identical,
·The second lines (Figure 18, 11 and 13) of the Nyiragongo and Nyamulagira are
identical at 60%,
·The third lines (Figure 19, 11 and 13) of Nyiragongo and Nyamulagira are
20% identical and have similar shapes at 80%, and become identical (same value)
at the end (at C35),
·The third line of Nyiragongo
is 80% identical to the first line of Nyamulagira
(Figure 11 and 13). The strong resemblance is due to the fact that these two
areas are located between two craters (Figure 33).
·The first line of Nyiragongo
is 100% similar to the third line of Nyiragongo
(Figure 11 and 13).
Finally, the degree
of heterogeneity is 70% and 88% for Nyamulagira and Nyiragongo respectively.
3.2.3. Structural curves
Let us analyse the following
structural curves.
3.2.3. Structural curves
Let us analyse the following
structural curves.
Figure 20 : Seismic
structure curve ofNyamulagira
area
Figure 21 : Seismic
structure curve ofNyiragongo
area
The observation of these geo-seismic signatures shows that :
- The gap between curves B2 and B3 becomes twice as
large at A4 and A5 for both Nyamulagira (Figure 20)
and Nyiragongo (Figure 21): twice as large as at A1,
A2, and A3 for the same curves (B2 and B3). Craters are more likely to be found
at the latter locations (A1, A2 or A3).
- The curves generally descend from west (A1) to east
(A2) (A5).
- The structure of both Nyiragongo
and Nyamulagira decreases from top to bottom (B1)
from top to bottom (B3).
3.2.4. Curves linking maximum depths to sub-areas Ai and Bj
Let's compare the following curves:
Figure 22 :Modelling the soil structure around Nyiragongo
Figure 23 :Modelling the soil structure around Nyamulagira
Observation of these curves shows that they are almost
similar; indeed, the angular coefficients of their lines, characterising
the ground structure, are almost equal.
The figure above models the behaviour of the maximum hypocentres
recorded at each vertical sub-area( Ai ) for the two
volcanoes, moving from west to East.
Figure 24 : Soil
structure curve of Nyiragongo and Nyamulagira
zones following the Ai
We can see from this figure that :
·From A1 to A3,
the two lines move in the opposite direction:
·Nyiragongo has a positive slope, while the other has a decreasing slope, with the
following details:
·At A1, Nyamulagira'shypocentre is lower than Nyiragongo's;
at A2, there is equality; A2 is the zone of intersection between the two
volcanoes.
·At A3, the hypocentre of Nyamulagira becomes greater than that of Nyiragongo.
·From A3 to A5, the two lines are nearly parallel with
a positive slope, with Nyamulagira'shypocentres deeper than Nyiragongo's.
·From A1 to A5, the model in Nyiragongo
has a linear shape with a positive slope, whereas Nyamulagira
has a parabolic curve with an upward slope (two straight lines, one decreasing
and the other decreasing),
·The A2 and A3 zones are thus of special interest to
us.
Consider the distribution of maximum hypocentres
in each horizontal zone (Bj), from North to South (Bj).
Figure 25 : Soil
structure curve ofNyiragongo
and Nyamulagira areas according to Bj
The figure
above reveals the following:
- The two
parabolic curves are symmetrical, with :
at B1, the hypocentre of Nyamulagira is higher than that of Nyiragongo
at B2, the reverse is true, the hypocentre
of Nyamulagira becomes lower than that of Nyiragongo,
At B3, we
return to the initial situation, as at B1,
- B2 is
therefore of interest as a singular point: the symmetrical line to the two
curves passes through B2.
The
comparison of curves (Figures 24-25) shows that:
- The Nyiragongo area studied from North to South (Bj) has a similar structure to that of Nyamulagira,
studied from West to East ( Ai),
- These two
structures act inversely to the Nyamulagira structure
studied along the Bj (horizontally).
The
following curve shows the distribution of the maximum hypocentres
from the North (Nyamulagira) to the South (Nyiragongo).
Figure 26 : Soil
structure curve of the Nyamulagira (North) and Nyiragongo (South) zones according to Bj,
from North to South.
The two curves below depict the shape of the magma
reservoir.
Figure 27 : Soil
structure curves of the Nyiragongo area according to Bj and Ai.
Figure 28a : Soil
structure curves of the Nyamulagira area according to
Bj and Ai.
After observation, we should note the following:
- Knowing that the shape of the Nyamulagira
volcano reservoirs is predominantly cylindrical (quote), the curves in figure
(28b), would henceforth represent this shape,
- Knowing that the shape of the Nyiragongo
volcano reservoirs is predominantly spherical (quote), the curves in figure
(28a) would now represent this shape.
- Ultimately, we say that the shape of the curves
would give an indication of the shape of the magma reservoir; this is one of
the geological implications.
The curve below gives statistics on the distribution
of hypocentres by depth bands for each volcanic area.
Figure 28b :Hypocentre distribution
based on depth band
These curves show: - A Nyamulagira
anomaly at depths [5-10] and [10-20],
- A Nyiragongo anomaly at
depths [20-30] and [30-40],
- A perfect coincidence of two curves ranging from
[30-40] at Moho to beyond,
- The anomalies observed in these locations are almost
certainly the result of significant volcanic activity, which would indicate the
location of the magma reservoir at depth; another geological implication.
3.2.5. Fromseismic
energy, earthquake frequency, and d-value
The distribution of the number of earthquakes, seismic
energy released, and soil structure constant (d-value) for each sub-area is
depicted in Figures 29 and 30.
Figure 29 : Distribution of energy, number of earthquakes and
d-value over the Ai and Bj sub-areas ofNyamulagira area
Figure 30 : Energy distribution, number of earthquakes, and
d-value over the Ai and Bj sub-zones of the Nyiragongo area
NB: the d-value has been multiplied by 2000.
These two figures show: - a strong correlation between
the curve of the number of earthquakes (%) and the d-value (which characterises the soil structure).
We conclude and
confirm that seismic activity is influenced by soil structure. That, on a
global scale, the structure constant curve evolves inversely to the energy
curve. Figures (31 and 32) express previous realities by introducing the
concept of the "volume density" parameter.
Figure 31 : Distribution of d-value and volume densities of
energy and number of earthquakes in sub-areas Ai and Bj,
Nyamulagira area
Figure 32: Distribution of d-value and volume
densities of energy and number of earthquakes in sub-areas Ai and Bj, Nyiragongo area
These two curves show
the following:
- With a few nuances,
there is a correlation between the minimum of the high energy density and the
maximum of the number of earthquakes at the same location for both Nyamulagira and Nyiragongo and
vice versa.
- The assumptions made
at the outset are validated at sub-areas A2 and B2 for Nyamulagira
and A3 and B1 for Nyiragongo, the most likely
location of craters.
It is concluded that
it is preferable for the characterisation of
seismicity to be described in terms of volume density rather than in terms of
number of earthquakes or energy. The notion of volume is therefore important in
this study.
3.2.6.Craters location and distance among
them
The location of the
crater is based on the assumptions that the crater is located where :
- The volume density
of the number of earthquakes is abnormally high,
- the
volume density of the seismic energy of tectonic or volcano-tectonic
earthquakes is very low.
Based on these
assumptions, other discriminating elements mentioned above and the exploitation
of the results of figures (24-25), it turns out that the crater is located at
zone C22≡ (B2, A2) ≡ [29.15°E; 1.35° S] for the Nyamulagira
volcano and at zone C13≡ (B1, A3) ≡ [29.25°E; 1.50° S] for the Nyiragongo volcano (Figure 33). Red solid circles indicate
their locations ofNyamulagira ( above) and Nyiragongo
( below) craters
Figure 33 : Location ofNyamulagira (red bubble, above) and Nyiragongo (solid red bubble, below) craters
Cij grid areas in black correspond to the Nyamulagira
volcano area and Nyiragongo in red. It is clear that
(Figure 33):
·the two columns A2 (C12 ,C22,32,C12 and C22)and A3(C13
,C23,33,C13 and C23) where the craters of the volcano Nyamulagira
and Nyiragongo respectively are located are 100%
identical,
·Adding (C22 and C32) to A2 and (C12 and C22) to A3,
the similarity rate reduces to 83%.
·The distance between the two craters is about 15 km,
which is consistent with field observations.
3.2.7. Characterisationaroundcraters
We are interested in characterising
the seismicity of the volcanoes aroundcraters (solid red circle in the following
figures): We subdivide the area into four quadrants, called Di , by drawing two
straight lines, one vertical and one horizontal, pass through the crater point.
This
model wasused to characterizethese zones.
Figure 34 : Characterization around Nyamulagira
crater is extremely fine.
Figure 35 :Characterisation around
the Nyiragongo crater is extremely fine.
These figures highlight the
following observations:
3.2.7.1.AboutNyamulagira volcano
The investigation is carried out in three stages:-
We notice four color groups:
The northwest red cluster (D1) is distinguished by
extremely high activity.The orange grouping in the
southwest (D2) is active. The green cluster in the south-east (D4) is active,
while the pink cluster in the north-east (D3) is inactive.
- In terms of quadrants, we observe: high activity to
the left (West) of the crater (D1 and D2), medium activity to the right (East)
of the crater (D3 and D4), and low activity to the center (D4) of the crater
(D3 and D4)
Nothing can be said about North-South activity.
- We can see from the diagonals passing through the
crater that:
The North-West-South-East diagonal (D1-D4): the
North-West has low activity, while the South-East has medium activity.
The North-East (D3-D2) and South-West diagonals are
moderately active, whereas the South-West is extremely active.As a result, the seismic activity structure
is symmetric, with a degree of heterogeneity of 100%. (four
groups of colours in four quadrants: each quadrant
has a colour).
3.2.7.2. On top of Nyiragongo volcano
The analysis is carried out in three steps, as before:
-There are three color categories:
-The orange grouping (D2), with high seismicity, is located in a large
south-western area.
-The medium activity green grouping in the east (D3 and D4),
-The purple assemblage (D1),
In terms of quadrants, we note :
·High activity on the left (west) side of the crater
(D1 and D2),
·Low activity to the right (east) of the crater (D3 and
D4),
·Nothing can be said in terms of activity between the
North and the South
According to the diagonals passing through the crater,
we observe the following:
·The North-West, South-East diagonal (D1-D4): the
North-West has high activity, while the South-East has medium activity,
·The North-East-South-West diagonal (D3-D2): The
North-East is low activity, while the South-West is high activity. This is the
opposite of what is observed for Nyamulagira.
·We therefore observe a quasi-symmetry of the seismic
activity structure and a degree of heterogeneity of 75% (three groups of colours on four quadrants: each quadrant has a colour)
3.2.7.3. Comparison
between the two volcanoes
The comparison between the two structures is done in two ways and is well
visualized using Vein diagrams.
The statistics on the
colors of the structures in Figures 10a-b: we will do this in terms of the
North, South, East and West zones of the structures. The C2j zones (J=1, 2.3)
separate the North from the South, while the Ci3 zones (i=1, 2.3) separate the
East from the West of the structure.
The structures (Figure 10 ab
or Figure 33) are clearly presented in the diagrams below
Figure 36: Qualitative comparison of the Nyiragongo
and Nyamulagira structures through Vein diagrams;
symmetrical subdivision
Statistically, these results are contained in
the table
The statistics on the
colors of the structures in Figures 10a-b: we will do it in terms of the North,
South, East and West zones of the structures, but on the basis of the quadrants
(Figures 34 and 35): the C2j zones (J= 1, 2,3)
separate the North from the South, while the zones Ci3 (i=1,2,3) separate the
East from the West of the structure. The structures (Figure 34 and 35) are
clearly presented in the diagrams below.
Figure 37: Qualitative
comparison ofNyiragongo and Nyamulagira
structures through Vein diagrams; subdivision into quadrants
Statistically, these results are contained in the table
Table 10: Statistics relating to figure (36),
East-West subdivision
SUBDIVISION/COMPARISON
COMMON COLORS (%)
COLORS EXCLUSIVE TO NYIRAGONGO (%)
EXCLUSIVE COLORS IN NYAMULAGIRA (%)
EAST
60
40
0
WEST
40
40
20
Table 11: Statistics relating to figure (36), North-South subdivision
SUBDIVISION/COMPARISON
COMMON COLORS (%)
COLORS EXCLUSIVE TO NYIRAGONGO (%)
EXCLUSIVE COLORS IN NYAMULAGIRA (%)
NORTH
75
25
0
SOUTH
33
67
0
Table 12: Statistics relating to figure (37), East-West subdivision
SUBDIVISION/COMPARISON
COMMON COLORS (%)
COLORS EXCLUSIVE TO NYIRAGONGO (%)
EXCLUSIVE COLORS IN NYAMULAGIRA (%)
EAST
50
0
50
WEST
0
50
50
Table 13: Statistics relating to figure (37),
North-South subdivision
SUBDIVISION/COMPARISON
COMMON COLORS (%)
COLORS EXCLUSIVE TO NYIRAGONGO (%)
EXCLUSIVE COLORS IN NYAMULAGIRA (%)
NORTH
0
50
50
SOUTH
100
0
0
The results from the tables above are transformed into the following
curves.
Figure 38 a: East-West
fine structure ofNyiragongo and Nyamulagira
volcanic zones; Table 10
Figure 38 b:
North-South fine structure ofNyiragongo and Nyamulagira
volcanic zones; Table 11
Figure 39a: East-West
hyperfine structure ofNyiragongo and Nyamulagira
volcanic zones;
Table 12
Figure 39b:
North-South hyperfine structure ofNyiragongo
and Nyamulagira volcanic zones;
Table 13
Observing the shape of these curves reveals the following:
·From the fine structure (Figure 38 ab), we
observe that:
vThe lines diverge first, to converge later;
vTheir intersection is located at the point of abscissa “colors exclusive to
Nyiragongo” and ordinate “40%”
·From the hyperfine structure (Figure 39a-b), we observe that:
vThe lines diverge first, to converge later;
vUnlike the previous case, the stopping point (maximum divergence)
corresponds to the point of abscissa “colors exclusive to Nyiragongo”
and ordinate “40%”
·From these two structures, two groups of curves emerge classified according
to concavity:
vThe following lines have a concavity facing upwards: EAST and WEST of the
fine structure (Figure 38a), South of the fine structure (Figure 38b), West of
the hyperfine structure (Figure 39a) and North of the hyperfine structure
(Figure 39b ),
vThe following lines have a concavity facing downwards: North of the fine
structure (Figure 38b), South of the hyperfine structure (Figure 39b), and East
of the hyperfine structure (Figure 39b),
The above results are useful in particular for monitoring the geodynamics
of a seismic zone; it is enough to repeat the same calculations in this area,
and evaluate the deviation or deformation of the curves, a reflection of the
geodynamics of the region.
These results, and
others above, show that the structure of the Nyamulagira
Volcano is a substructure of (included in) the Nyiragongo. This trend has been
observed by other studies (Ongendangenda T., 2020; Kamathe K., 2018) the main elements of which appear in the
table above.
Table 14: Structural and petrographic comparison
between the two volcanoes
VOLCANO
Structure
Magma reservoir location
Composition of lavas
(Petrography)
Isotope ratio
NYIRAGONGO
Strato-volcano
25-35km
(Deep)
Feldspaths and
Melilitis
Weak
Veryhigh
High
Veryhigh
NYAMULAGIRA
ShieldVolcano
3-7km
(superficial)
Feldspaths
High
Veryweak
Weak
weak
4. GENERAL CONCLUSION
AND PERSPECTIVES
The findings of this study revealed that: - The model
developed, particularly the scale designed for characterizing the areas
surrounding the volcanoes Nyamulagira (29.0°E-29.5°E;
1.2°S-1.5°S) and Nyiragongo (29.0°E-29.5°E;
1.45°S-175°S), is valid, logical, and reasonable.
The introduction of
the concept of earthquake "bulk density" or seismic energy in the
design of the characterisation scale played an
important role, - The assumptions made for the
location of the craters of these two volcanoes are also valid.
Both assumptions can be summed up as follows:
"The crater of a volcano, at least in our case,
is located where the volume density of the number of earthquakes is maximum, while the volume density of the seismic energy
released by tectonic earthquakes is minimum."
The application of this hypothesis, together with
other parameters, allowed us to locate the craters of these two volcanoes, in
accordance with field observations:
·The crater of the Nyamulagira
volcano is located at [29.15°E; 1.35°S] and at [29.25°E; 1.50°S] for Nyiragongo. The two craters are about 15 kilometers apart.
These findings corroborate the field observations.
·The structures of Nyamulagira
and Nyiragongo share many similarities, with some
differences in the Nyiragongo area, particularly in
its western part.
·The model allowed us to quantify the rate of
heterogeneity of each structure and calculate (compare) the rate of similarity
between the two; depending on the case, this rate is 67%, 75%, or 40%.
As a result, this model has highlighted the geological
features in the region; the geological implications of this model can be used
for geological prospecting.
Indeed, the
application of the characterisation scale and
hypothesis in the study of the areas surrounding Nyamulagira
and Nyiragongo yielded the following results:
·Iab, Ibc, IIIbb, and IIIbc are the seismic species discovered for Nyamulagira.
·The species of Nyiragongo
are Iab, Iac, Ibb, Ibc, IIIbb,
and IIIbc.
·Nyiragongo appears to include all of the Nyamulagira
species.
·The latter has two distinct species (Iac and Ibb) at (29.3°E-29.5°E).
·The region's structure factors (ab,
ac, bb, and bc) were
identified, with one (ac) being unique to Nyiragongo.
·As a result, the similarity rate between the two is 67%.
·In terms of structural factors, this rate is 75%.
·The 25% singularity of Nyiragongo
is justified by its extremely complex shape (stratovolcano
with a crater consisting of three platforms, .....).
·Several peculiarities or anomalies have been observed
at (29.3°E-295°E).
·The zoning maps made it possible to calculate the
degree of heterogeneity, which is 70% and 88% for Nyiragongo
and Nyamulagira, respectively. The structural curves
revealed that the structures of areas deteriorated from west to East and North
to South.
The observation of these curves relating to the statistics of the hypocentres as a function of the number of earthquakes,
i.e. the ground structure, reveals that the two structures are similar; indeed,
the angular coefficients of their lines, characterizing the ground structure,
are nearly equal.
The curves of the hypocentre
distribution statistics show an anomaly at depths [5-10] and [10-20] for Nyamulagira, depths [20-30] and [30-40] for Nyiragongo, and a perfect coincidence of two curves from
depth to depth.
The anomalies
observed at these locations are most likely the result of significant volcanic
activity. A comparison of these curves shows that the Nyiragongo
area studied from north to south has a similar structure to that of Nyamulagira studied from west to east.
These two structures
operate in the opposite direction of Nyamulagira,
which is studied from north to south.
After observing the
above curves, it appears that the shape of the Nyamulagira
volcano reservoir is predominantly spherical, whereas that of the Nyiragongo volcano reservoir is predominantly cylindrical
in accordance with the literature,
The study on the
volume density of seismic energy, the number of earthquakes and the d-value
shows a good correlation between the curve of the number of earthquakes (%) and
the d-value (which characterises the structure of the
ground). It is concluded and confirmed that the seismic activity depends on the
soil structure.
There is a
correlation between the minimum volume density of energy and the maximum volume
density of earthquakes at the same location for both Nyamulagira
and Nyiragongo, with a few exceptions.
The characterisation of seismicity should be described in terms
of volume density rather than number of earthquakes or energy. As a result, the
concept of volume is important in this study.
These results, and others above, show that the structure of the Nyamulagira Volcano is a substructure of (included in) the Nyiragongo.
REFERENCES
1.Borden J-P., (1988). Biologie-Géologie. Première S. Paris: Bordas
2.Kamate K., (2018). Pétrographie et géochimie des laves du volcan Nyiragongo (Nord Kivu, RD
Congo) : influence de la viscosité sur les paramètres de propagation des
coulées de laves menaçant la ville de Goma. Master de spécialisation :
Université de Liège, Faculté des Sciences. Département des Sciences et Gestion
de l’Environnement. http://hdl.handle.net/2268.2/5534
3.Lay T., Wallace T., (1995). Modern Global seismology. New-York :
Academic Press
4.Mukange B., Bantidi M., ZanaNd., (2013).
Structure de
la sismicité de la Branche orientale des Rifts Valleys
du système des Rifts Est-africains ; de 1954 à 2010. Revue Congolaise des Sciences Nucléaires. vol.27, pp151-169.
5.Mukange B., (2016). Conception d’un
modèle physique pour la caractérisationet la surveillance de l’activité sismique et son implication géologique(Cas de la République Démocratique du Congo). Thèse de Doctorat : Université de Kinshasa,Faculté des Sciences. Département de
Physique.
6.Mukange B., (2021a).Design of a
unified scale for the characterization of seismic activity. International
Journal of Innovative Science and Research Technology, Volume 6, Issue 7, July–
2021, pp.1407-1422. www.ijisrt.com
7.Mukange B., (2021b).Application of the
unified scale to the characterization of seismic activity of the Democratic
Republic of Congo and its surroundings (comparative study for Africa, Indonesia
and the Pacific coast of Central America). International Journal of Innovative
Science and Research Technology, Volume 6, Issue 7, July– 2021, pp.1516-1555.
www.ijisrt.com
8.Mukange B., (2023a). Characterization of
the volcano-seismic activity around Nyiragongo
volcano and location of its crater by means of unified scale. Greener Journal of Geology and Earth
Sciences, 5(1) December
2023: 28-51.
http//gjournals.org/GJGES.
9.Mukange B., (2023b). Characterization of
the volcano-seismic activity around Nyamulagira
volcano and location of its crater by means of unified scale. Greener Journal of Geology and Earth
Sciences, 5(1) December
2023: 52-75.
http//gjournals.org/GJGES.
10.Ongendangenda A., (2020). Volcanologie de la
chaîne des Virunga. Paris: L’Harmattan.
11.Wafula M., D. Atiamutu et M. Ciraba, (1999).
Activité séismique dans les Virunga (Rép.Dém. Congo)
liée aux éruptions du Nyiragongo et Nyamuragira, deNovembre 1994 à Décembre 1996. Mus. roy. Afr. centr.
Tervuren Belg., Dépt.Géol.
Min. Rapp. Ann. 1997 & 1998, pp. 309 - 319.
12.Wafula M.D., Kasereka M., Rusangiza K., Kuvuke K., Mukambilwa K., Ciraba M. &Bagalwa M., (2009). The Nyamulagira
Volcanic Eruption on November 27, 2006, Virunga
Region, D.R. Congo. Cahiers du CERUKI, Numéro
Spécial CRSN-Lwiro(2009), pp. 108 - 115.
13.Wafula M.D, Zana A. Kasereka M. and Hamaguchi H.,
(2011a). The Nyiragongo volcano: A case study for the
Mitigation of Hazards on an African Rift Volcano, Virungaregion,
Western African Rift Valley, 32 pp. Disponible
sur: http://iugg georisk.org/presentations
14.Wafula M., (2011b). Etude Géophysiquede l’Activité Volcano-Séismique dela Régiondes Virunga, Branche
Occidentale du Système des Rifts Est-Africains et son Implication dans la
Prédiction des Eruptions Volcaniques. Thèse de Doctorat : Université de
Kinshasa,Faculté des Sciences.
15.Zana N, (1977). The Seismicity of the Western Rift Valley of Africa and related
problems.Doctorat Theses, Tôhoku University. 189 pp.
Cite this
Article: Mukange, BA; Katwika, C; Jalum,
B; Zana, NA; Tondozi, KF
(2023). The NyamulagiraVolcano,
a Sub Structure of that
of Nyiragongo Volcano (AnalysisusingSeismicSpecies).Greener Journal of Geology
and Earth Sciences, 5(1): 1-27.