Previous work
consisted in characterizing some seismic zones, these include:
·The DRC area(10°E-35°E;
6°N-14°S), homogeneous, but once subdivided into square sub-zones of side 5°,
was made heterogeneous but homogeneous in the Virunga
region (25°E-30°E; 1°N-4°S°), (Mukange,2021b),
·The previously homogeneous Virunga area,
subdivided into square sub-areas of dimension 1°, was made heterogeneous but
homogeneous in the area around Nyiragongo volcano
(29.00°E-29.50°E; 1.45°S-1.75°S) (Mukange, 2023c).
These
characterizations were made possible by the design of a model by means ofunified scale
that generatesseismic species.
The objective of
this work is to characterize the "homogeneous" region around the Nyiragongo volcano, subdividing it into square sub-zones
of dimension 0.1° and to find a technique for locating the crater. To do
this, we designed a unified scale appropriate for characterization on the one
hand, and on the other hand made the following assumptions:
·The crater is located at the place where the densityvolumeof the number of volcanic earthquakes is abnormally high,
·The crater is located at the place wheredensityvolume of the energy of tectonic or
volcano-tectonic earthquakes is very low.
The outcome of the
research, following the processing of earthquake data from the areafor a period from 2016 to 2021, revealed
the following:
·The seismic species identified in this area are Iab,
Iac, Ibb, Ibc, IIIbb and IIIbc, as structural factors, and (ab,ac,bb, and bc). The
area's final degree of heterogeneity is 88%, with a 12% degree of
homogeneity. As a result, the notion of a structure's homogeneity is
dependent on the scale used to observe it.
·Hypotheses are confirmed. Indeed, according to our hypotheses and
field observations, the crater is located at [29.25°E; 1.50°S].
·Other significant outcomes include:
·The number of earthquakes curve and the d-value have
a good correlation (which characterizes the structure of the ground). It has
been determined and confirmed that in this area, The
seismic activity is completely dependent on the soil structure.
These
findings support previous research (Mukange,2016), which found that the
seismicity of DR C is better described (diversified) in terms of longitude (West
to East) than latitude (North to South). Moving from west to east, the shape
of the structure is the same for the DRC and Virunga;
they are the inverse of Nyiragongo. Moving north to
south, all three structures exhibit the same trend: seismic activity
decreases from North to South.
Our previous
research (Mukange, 2016; Mukange
2021a-b) on the characterization of seismicity in an area in general, and that
of the Democratic Republic ofCongo
(DRC) in particular, has highlighted, on a regional study scale, the
homogeneity of seismicity in the Virunga area, which
is home toNyamulagira
and Nyiragongo volcanoes. These two volcanoes are of
great scientific interest and deserve to be thoroughly studied in order to
improve monitoring and develop techniques and models for possible prediction.
As a result, our characterization ofNyiragongo volcano's surroundings will consist of the
following:
·Establishing the relationship between soil structure and seismic
activity in the area. (modeling),
To demonstrate that,
upon closer examination, this previously revealed homogeneous seismic
activity has a degree of heterogeneity.
To attempt to locate
the volcano's crater based on the following assumptions:
·The crater is situated in an area with a high density (volume) of
earthquakes.
·The crater is found in areas with a low density (volume) of energy
released by tectonic or volcano-tectonic earthquakes.
The crater is
situated in an area where the density of earthquakes and energy released is
low.
The East African Rifts system is presented as a
continental extension of the global system of lithospheric fractures that snake
through the middle of the Atlantic and Indian Oceans and extend into the
Eastern part of Africa via the Gulf of Aden and the Red Sea (Mukange, 2016; Boden et al. 1988;
Bantidi, 2014a). This fracture system is divided into
two branches:
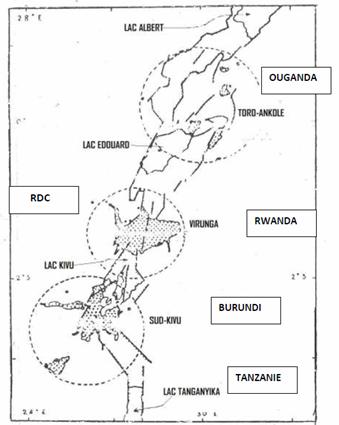
·The Eastern branch, which runs from the Afar triangle through Ethiopia
and Kenya to the Tanzanian divergence in the north (Figure 1).
·The Western branch consists of a system of fractures that cross the
Great Lakes garland, i.e., from Lake Albert (617 m) through Lake Edward (912
m), Lake Kivu (1462 m), Lake Tanganyika (780 m), Lake Rukwa
(782 m), and Lake Malawi (460 m), and continues South to Mount Beira in
Mozambique and southwest to Lake Kariba in Zimbabwe
(Fig. 1). This branch thus covers most of the Eastern provinces of the DRC from
latitude 4°N to latitude 8°S. From the Red Sea to the Zambezi, the East African
Rifts are more than 6,000 km long and 40 to 60 km wide. The two branches split
in two at the Aswan Lineament and join at Lake Malawi (Figure 1).The two
branches are active (Bantidi et al.,2014b ; Mukange et al.,2013 ;Wafula
1999,2009,2011a,2011b ; Zana,1977,1981).
Figure 1: The East African
Rift System is depicted with major faults as solid lines, water as blue, and
volcanoes as red.
The Congolese Rift has three main volcanic provinces: Toro-Ankole province in the north, Virunga
province (Nyiragongo and Nyamulagira
volcanoes...) in the center, and South Kivu province in the south (Zana and Tanaka, 1981; Zana,
1982; Ngindu, 2009). (Wafula et al., 1989; Wafula et
al., 2009).
The Virunga volcanic areais located in the far northwestern
corner of Lake Kivu. This area is made up of eight volcanoes that are divided
into three groups known as volcanic provinces: the eastern group, which includesMuhavura
volcanoes (4127 m a.s.l.), Gahinga
(3474 m), and Sabinyo (3647 m), the central group,
which includesvolcanoes Isoke (3911 m), Karisimbi (4506
m), and Mikeno (4437 m), and the western group (3056
m). Except for the brief eruption of Mugogo on August
1, 1957, volcanoes of the first two subgroups are currently dormant. Mugogo is 2350 meters above sea level and 11 kilometers
north of Visoke; it is considered a satellite cone of
the latter (Visoke).
Geophysical research carried out on the Virunga
region in general and the Nyiragongo volcano in
particular whose name means in English “ the one that smokes”
(Lubemba,2021),indicate that it is characterized by a flow of melilitite and feldpathic lavas
of a speed 60 km/h at a temperature of 1.100°C (Bahaya,2021; Kamate, 2018; Ongendangenda,
2020).
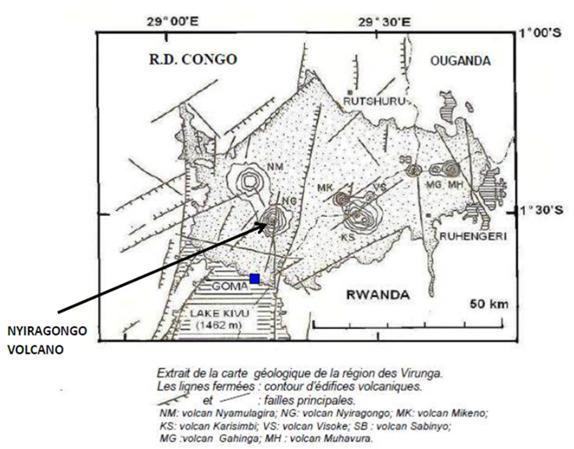
Figure 2 :
The volcanic provinces of the Virunga region
The volcanoes of the western group are among the most active in the
world today: Nyamulagira because of the frequency of
eruptions (on average every two years) and Nyiragongo
because of its permanent lava lake in the central crater. Note, in addition,
that Nyiragongo is considered one of the most
dangerous volcanoes on our planet due to its proximity to the city of Goma (15 km from the crater, with an estimated population
of over one million) and the superfluidity of its
lava, which can flow at speeds of up to more than 40 km/h (Wafula,2013). Both
of these volcanoes lie within the same zone of the Rift Axis fractures (Figure
3).
Volcanic rocks of these two volcanoes are basalts rich in alkaline
elements with a high potassium concentration; this would explain the lavas' hyperfluidity. The volcanic activity of these two volcanoes
is of the Hawaiian type, with effusive and passive emission of lava with low
viscosity (100-1000 poises) and very high temperature (1000°C). There are three
other volcanoes of this type in the world: Mount Erebus in the Arctic, Kilauea
in the Pacific, and Erta Alee in Ethiopia.
The classification based on seismogram frequencies is similar to that of
the Redoubt volcano in Alaska: in the Virunga area,
we record type A volcanic earthquakes (4-10 Hz), type B (1-4 Hz), type C (peak
at 2.6 and 8 Hz), and tremors (1-2 Hz).
The last eruption of Nyiragongo volcano
occurred on May 22, 2021.
Figure 3: Structural geology of the Virunga
region and location of volcanoes
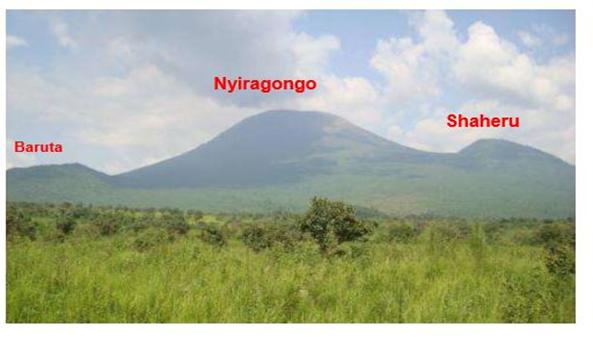
More than 1300 volcanoes provide a rhythm to the earth's internal
activity. The majority of them are active. The Nyiragongo
volcano is a complex of three volcanoes aligned north-south: Baruta (3100 m) in the north, Nyiragongo
main cone (99, 25°E, 1.50°S, 3470 m) in the center,
and Shaheru (2800 m) in the south (Figure 4). Nyiragongo has the morphology of a stratovolcano
(a volcano with an undulating shape and a stratified structure caused by the
piling up of volcanic materials constituting the cone) (Simkin
et al., 1981, cited by Wafula, 2013). Nyiragongo volcano is well-known for its lake, which was
discovered in 1928. (Tazieff, 1977; Hamaguchi et al., 1982, cited by Wafula,2013).
Until 1977, the Nyiragongo
crater was divided into three platforms: the first 180 meters from the crater's
summit, the second 180 meters below the first, and the third 60 meters below
the second. This lava lake's level fluctuated constantly, and by December 5,
1976, it had reached the critical level of the first platform (Pouclet, 1973, Tazieff, 1977, cited
by Wafula, 2013).
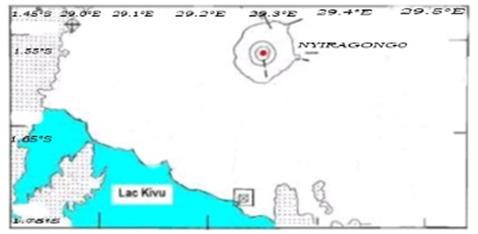
The basic data for Nyiragongo
volcano were collected at the GomaVolcanological Observatory (OVG) from 2016 to 2021 over the
geographical area between 29°E and 29.5°E longitude and 1.45°S and 1.75°S
latitude (Figure 5). The magnitudes, however, are missing from these data. To
address the second hypothesis, we linked the tectonic earthquakes to their
magnitudes as reported by the USGS.
Figure 5: Precinct ofthe area being investigated
Fundamental data
for each event contains the elements contained, for illustrative purposes, in
the table below.
Table 1: Illustration of fundamental seismic
data
Year
Month
day
Hour
Minute
Second
Latitude
Longitude
Depth(km)
2016
8
16
9
32
8,7
-1,447
29,181
4,1
2016
11
12
17
11
43,9
-1,447
29,218
5,6
2021
5
20
2
7
13,8
-1,448
28,565
17,1
2016
11
12
17
15
15,5
-1,449
29,204
23
2017
5
18
6
31
51,6
-1,453
29,104
30,8
2016
4
20
22
32
48,9
-1,453
29,156
41,5
2021
3
6
20
44
52,9
-1,457
29,327
52,7
2016
12
2
8
35
18,7
-1,462
29,267
66,9
2019
6
26
19
1
19,7
-1,464
29,27
70,4
2021
8
9
2
29
49,7
-1,465
29,173
79,8
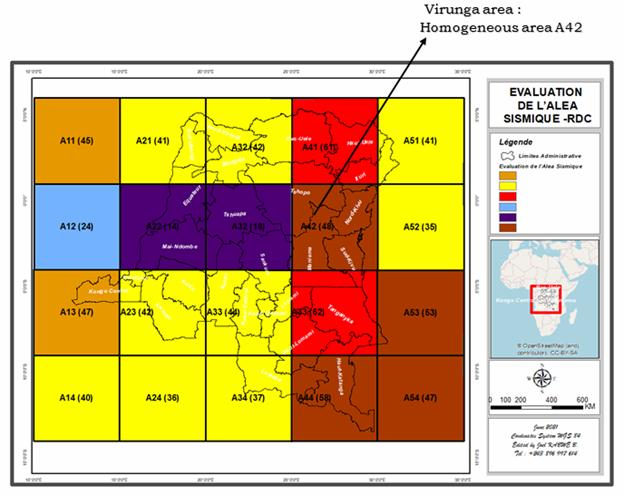
The figure below
depicts the findings of previous investigations (Mukange,
2021b) conducted in an area between 10° E-35° E longitude and 6° N-14° S
latitude. The current study area (29.0°E-29.5°E and 1.45°S-1.75°S) falls within
the "homogeneous" seismic area A42 (25°E-30°E and 4°S-9°S).
Figure 6: Seismic zoning in the Democratic
Republic of Congo for seismic hazard assessment (Mukange,
2021b)
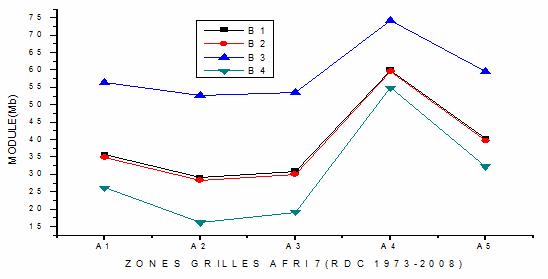
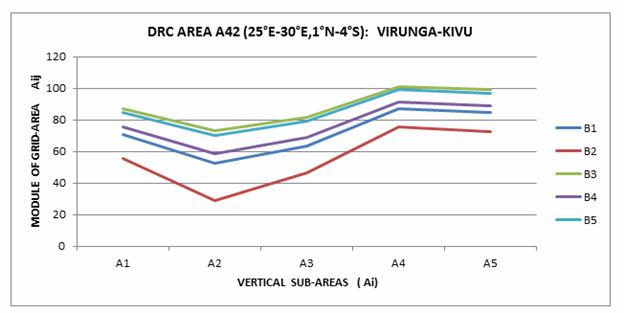
The results of the
preceding figure have been transformed into curves (Figure 7), known as
structure curves or "geoseismic
signatures."
Figure 7: Seismic hazard curves in the DRC from
Figure 6.
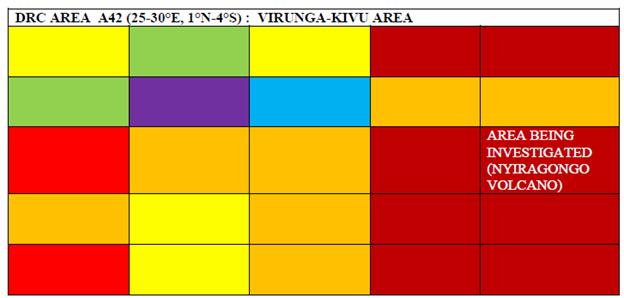
A more detailed
study was conducted (Mukange, 2023a) highlighting the
heterogeneity of the A42 zone (25-30°E, 1°N-4°S); it was sufficient to
subdivide the said zone into square sub-areasof one degree side (Figure 8).
Figure (8) divides the area intotwo sections: the sub-area between 25°
and 28°E and the sub-area between 28°E and 30°E. However, the first sub-areais divided into
two parts, one between 25° and 26°E and the other between 26° and 28°E. A study
similar to the previous ones will be conducted in this zone to characterize it
and highlight its 'heterogeneous' nature.
Figure 8: Seismic Zoning for Seismic Hazard
Assessment in the Virunga area, A42
The geoseismic signature of figure (8) is represented by the
figure bellow.
Figure 9: Transformation of the results of
Figure 8 into curves
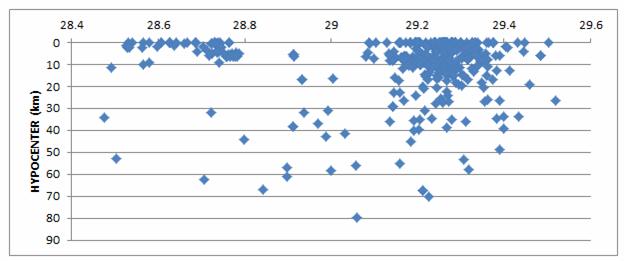
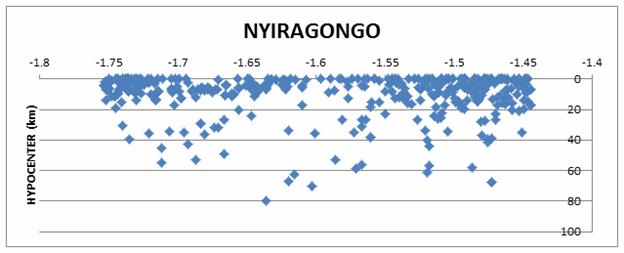
Figures (10-11) show the distribution of hypocenters around Nyiragongo volcano.
Figure 10: Distribution of hypocenters as a
function of longitude around Nyiragongo volcano
Figure 11: Distribution of hypocenters as a
function of latitude around Nyiragongo volcano
2.2 Method of analysis
2.2.1. Introduction
Our main objective is to characterize the
seismicity around the volcano. To do this, we must design a unified and
appropriate scale. This scale must integrate various classical parameters that
we will have to calculate in each sub-area; these are the following parameters:
- The total number of earthquakes,
- The total energy released by the earthquakes,
- The maximum Magnitude,
- The maximum depth of the hypocenters,
- Surface of each sub-area,
- Volume of each sub-area,
- Density of earthquakes,
- Density of energies,
- The b-value and the "d-value" Lay,1995; Mukange,2016),
- The degree of heterogeneity.
2.2.2. Method of analysis
The data will be processed by dividing the area
into vertical (Ai) and horizontal (Bj) sub-areas of
width 0.1° each, where we will calculate the above-mentioned parameters and
group them in the table (5).
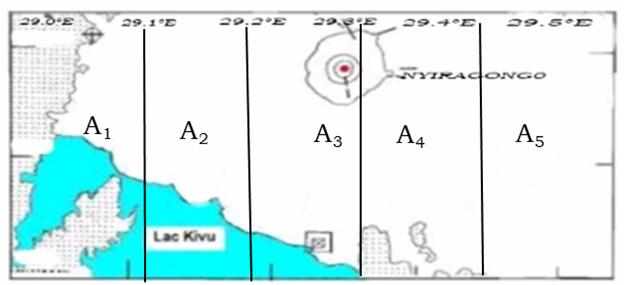
2.2.2.1. Vertical subdivision of the area
The study area is divided into five vertical
sub-areas in 0.1 degree steps from west to east (Figure 12, Table 2).
Figure 12: Subdivision of the area into vertical
sub-areas (Ai)
Table 2: Limits and numbers of earthquakes in
each vertical sub-area
N°
Areas
Limits of area
Number of earthquakes
Longitude(°)
Latitude(°)
1
A1
29°E-29,1°E
1,45°S-1,75°S
101
2
A2
29,1°E-29,2°E
1,45°S-1,75°S
114
3
A3
29,2°E-29,3°E
1,45°S-1,75°S
156
4
A4
29,3°E-29,4°E
1,45°S-1,75°S
30
5
A5
29,4°E-29,5°E
1,45°S-1,75°S
7
Total
A1+A2+A3+A4+A5
29,0°E-29,5°E
1,45°S-1,75°S
408
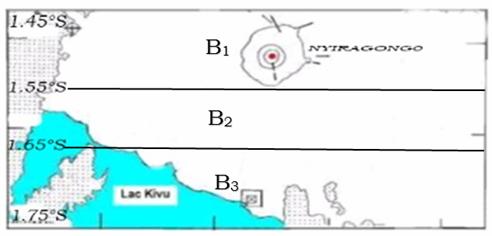
2.2.2.2. Horizontal subdivision of the area
The same areais, this time,
subdivided into three horizontal sub-zones by steps of 0.1 degree. (Figure 13, Table 3).
Figure 13: Subdivision of the area into
horizontal sub-areas (Bj)
Table 3: Limits and number of earthquakes of
each horizontal sub-area
N°
areas
Limits of the area
Number of earthquakes
Longitude(°)
Latitude(°)
1
B1
29,0°E-29,5°E
1,45°S-1,55°S
183
2
B2
29,0°E-29,5°E
1,55°S-1,65°S
72
3
B3
29,0°E-29,5°E
1,65°S-1,75°S
153
Total
B1+B2+B3
29,0°E-29,5°E
1,45°S-1,75°S
408
2.2.2.3. Calculation
of seismicparameters
The classical seismic parameters for each sub-zone are calculated as
follows:
2.2.2.3.1. The number of
earthquakes
This consists of counting all the earthquakes that have occurred in each
sub-area for the period from 2016 to 2021 (Tables 1-2).
These results are converted into percentages according to the following
relationship:
(1)
Where N_j is the total
number of earthquakes in each Ai or Bj subarea.N_k is the total
number of earthquakes in the whole study area.
2.2.2.3.2. The maximum
magnitude
The operation consists in locating the largest magnitude recorded in
each sub-area.
2.2.2.3.3. The energy of
the earthquakes
The seismic energy released by each earthquake is determined, in Erg,
through the formula
(2)
Thus, the total energy (E_Tk) in the sub-zone
(k) is the sum of the energies of each event.
In percent, we use the following formula:
(3)
With〖E〗_k,
the total energy released by all recorded earthquakes in the entire study area.
2.2.2.3.4. The maximum and
minimum depth
This identifies the greatest depth (hypocenter) recorded in each sub
area.
2.2.2.3.5. The surface of
each sub-area
Each sub-area has a rectangular shape whose surface (S) is calculated
using the following formula:
S=L.l(4)
With L and l, respectively the length and width
of the subarea.
Recall that 1°=111.11km
2.2.2.3.6. The volume of
each sub-area
The determination of the volume (V) of each sub-area is done using the
formula below:
volume=area*maximumdepth (5)
2.2.2.3.7. The volume
density of earthquakes
The volume density (Ds ) of
earthquakes in each sub-area is obtained by the following formula:
(6)
Ns is the total number of
earthquakes in each sub-zone (Ai or Bj), (V) the
volume of each sub-zone.
The volume density of earthquakes in percentage is
determined by the following relation:
(7)
With
DT, VT,
NTrepresent respectively the total
density, the total volume and the total number of earthquakes of the whole area
constituted by the sub-areas Ai or Bi.
2.2.2.3.8. The volume
density of energy
The volume density of energy in percentage is
calculated in the same way as that of the earthquakes provided that the number
of earthquakes in the zone or subzone is replaced by the energy. Hence:
(8)
In percentage it is demined for each sub-area by the
following relationship:
.100(9)
2.2.2.3.9. The b-value and
the d-value
The relationship
:
(10)
Used to characterize the
seismic activity through the calculation of the value of the angular
coefficient b, called the b-value (reference). This parameter has not
attracted our attention.
In the same way as before,
The relationship:
(11)
is used to characterize the
soil structure through the calculation of the value of the angular coefficient
d, introduced by us, called the d-value (Table 4, Figure 14).
Where ,m_b is replaced by H , the
depth in relation.
Table 4: Statistics on the
number of earthquakes by depth range
H≥
N
LOG(N)
0
114
2,00432
5
77
1,72428
10
39
1,41497
15
25
1,38021
20
19
1,36173
25
14
1,36173
30
14
1,27875
35
11
1,25527
40
9
1,17609
45
6
1,04139
50
5
0,95424
55
4
0,90309
60
4
0,8451
65
4
0,69897
70
2
0,30103
75
1
0
Figure 14: An illustration
of how the parameter d-value is determined.
At the
appropriate time, the parameter called "degree of heterogeneity" will
be defined and calculated.
3.Presentation and discussion of findings
3.1. Presentation
The
values of the various parameters calculated by usingthe above formulas are shown in the
table below:
Table 5: Synoptic table of calculated seismic parameters
Areas
d-value
Number of earthquakes
Number (%)
Power
(Erg)
power(%)
maxM
maxH
(km)
sur
face
(km2)
Volu
me
(km3)
Density
volume
earthquakes
Volume density
of power
Density of earthquakes
(%)
Power density
(%)
A1
0,0198
101
24,754902
7,86E+18
9,32E+01
5,2
79,8
363
28967,4
0,003
6,31E+13
106,389
93,257
A2
0,023
114
27,9411765
1,38E+17
1,64E+00
4,69
70,1
363
25446,3
0,00448
1,11E+12
136,700
1,637
A3
0,03
156
38,2352941
9,68E+15
1,15E-01
4,24
58,0
363
21054
0,00740
7,78E+10
226,088
0,114
A4
0,0225
30
7,35294118
2,91E+16
3,45E-01
4,44
48,8
363
17714,4
0,00169
2,34E+11
51,675
0,345
A5
0,031
7
1,71568627
3,85E+17
4,57E+00
4,91
26,6
363
9655,8
0,0007
3,09E+12
22,120
4,567
B1
0,0262
183
44,8529412
3,85E+17
4,57E+00
4,91
67,3
616
41456,8
0,0044
3,09E+12
134,692
4,567
B2
0,0179
72
17,6470588
1,23E+18
1,46E+01
4,91
79,8
616
49156,8
0,0014
9,88E+12
44,692
14,593
B3
0,0294
153
37,5
6,81E+18
8,08E+01
5,2
55,0
616
33880
0,0045
5,47E+13
137,795
80,799
TOUT
0,0297
408
100
8,43E+18
1,00E+02
5,2
79,8
1848
124494
0,00327
6,77E+13
100,000
100,020
3.2.DISCUSSION OF THE RESULTS
3.2.1. Design of the characterizationscale
The
characterization of the seismic activity of an area requires the design of a
unified characterization scale that can reasonably incorporate all calculated
parameters (Table 5). For our purposes, our characterization scale consists of
three parameters and is written as follows:
X_12 , consisting of two parts, the form factor and the
structure factor:
where
X is the
volume density of energy (D_E in %) of each sub-zone. It is the "form
factor".
X can
take the value I, II, III or IV, with :
I, if D_E (%) ≤25% ;
II, if D_E25% < D_E (%) ≤
50%,
III, if D_E (%) > 50%
The
number 1 in subscript represents the earthquake volume density (D_s in %) of
each subarea. It is defined as follows:
If D_s
> 50% then the number 1 takes the index b otherwise the index a.
Number 2
is interested in the value of d-value and takes the following values:
if d-value is <0.01, then number 2 takes index a,
if 0.01≤ d-value ≤0.02, then number 2 takes
index b,
if d-value is >0.02, then 2 takes index c.
The
group, of numbers (1,2) in index is called
"structure factor".
The
combination of our three seismic parameters assigns to each sub-area a unique
value called seismic species whose results are contained in Table (7).
3.2.2 Interpretation of the
results
The
interpretation of the results consists of characterizing the area and locating
the crater of the volcano on the basis of the results obtained and hypotheses
made.
3.2.2.1. Seismic species,
seismic levels and color
The
seismic species associated with each sub-area were ranked in ascending order
corresponding to the level of seismic activity and ground structure. Finally,
each seismic level is associated with a color (Tables 6-7).
Table 6:
Color code associated with each seismic level. follows:
If D_s
> 50% then the number 1 takes the index b otherwise the index a.
Number 2
is interested in the value of d-value and takes the following values:
if d-value is <0.01, then number 2 takes index a,
if 0.01≤ d-value ≤0.02, then number 2 takes
index b,
if d-value is >0.02, then 2 takes index c.
The
group, of numbers (1,2) in index is called
"structure factor".
The
combination of our three seismic parameters assigns to each sub-area a unique
value called seismic species whose results are contained in Table (7).
Table 6: Color code for
each seismic level.
Seismiclevel
colours
1
Pink
2
Blue
3
Green
4
Yellow
5
Purple
6
Orange
7
Light red
8
Darkred
Table 7: Color code,
seismic species and seismic level associated with each sub-area.
Sub areas
Seismicspecies
Seismic level
Colour code
A1
IIIbb
6
orange
A2
Ibc
4
Yellow
A3
Ibc
4
Yellow
A4
Ibb
3
Light green
A5
Iac
2
Light blue
B1
Ibc
4
Yellow
B2
Iab
1
Pink
B3
IIIbc
7
Light red
This
scale, in comparison to the previous one (MUKANGE 2021a), has
some simple innovations for the sake of the cause: While containing several
parameters,
- It has
been greatly simplified to three parameters,
- It
introduces and exploits the concept of volume density in particular (of power or
of the number of earthquakes).
3.2.2.2. Vertical and
horizontal zoning map
The
results of table (7) lead to the creation of the seismic zoning maps shown
below.
We notice
that each sub-area is distinct, and that when comparing the two subdivisions
(Figure 15 and 16) on the eight sub-areas, only one color is shared (red). This
demonstrates that seismicity and ground structure are not the same when studied
vertically or horizontally.
3.2.2.3 Degree of
heterogeneity
The
degree of heterogeneity is determined by the ratio (in percentage) of the
number of different colors to the total number of sub-areas (Table 8). It can
also be calculated as the ratio of the distinct colors to the total number (8)
of possible colors in the table (7).
Table 8 :
shows the overall degree of heterogeneity of the sub-areas.
Sub-areas
Degree ofhetérogeneity
Degree ofheterogeneityin %
Ai
4/5
80 %
Bj
3/3
100 %
Average
90%
This area, which was
previously homogeneous and subdivided into sub-areas, is no longer homogeneous:
when studied vertically and horizontally, it exhibits a degree of heterogeneity
of 80 and 100%, respectively, for a total of 90%.
3.2.2.4 Interpretation of
other parameters
The
evolution of the parameters according to sub-zones is shown below.
3.2.2.4.1 Evolution of the
d-value
The
d-value defines the soil structure, and its evolution by sub-area is as
follows:
Figure 17 :
depicts the evolution of the parameter d-value in each sub-area.
This
curve demonstrates that the structure of sub-area A2 is similar to that of A4
and nearly identical to that of A3 and A5.
3.2.2.4.2The evolution of Ai and Bj as a function of
maximum depth
The
characterization is carried out here by following the distribution of
hypocenters on each horizontal sub-area.
Figure 18: Distribution of
maximum hypocenters in each Bj sub-area: modeling
We observe that the distribution of maximum
hypocenters from north to south (Bj) around Nyiragongo volcano follows a parabolic law of upward
concavity; The shape of the above curve is similar to that obtained in our
previous research (Mukange,2021b).
Indeed, the curve below
from the above research depictsthe
seismic activity (moduleon the
ordinate) as a function of depth in Basaltic (Bi, on the abscissa) and
sub-basaltic (SM1) layers inVirunga area, i.e., from 25 to 105 km in depth.
Figure 19: Seismic activity
behavior in the basaltic and sub-Basaltic area ofVirunga area
We conclude that the ground structure studied from
North to South (horizontal subdivision) near Nyiragongo
volcano is similar to that studied between 25 and 105 kilometers away in the Virunga region.
The characterization is
carried out in this case by following the distribution of hypocenters on eachvertical sub-area.
Figure 20: Distribution of
maximum hypocenters in each sub-area AI (artificial intelligence): modeling
Maximum depths decrease
linearly from West to East.
We observe that the distribution of maximum
hypocenters from North to South (Ai) around Nyiragongo
volcano follows a linear increasing law; the shape of this line is similar to
that obtained in our previous research (Mukange).
Indeed, the straight line
below from the aforementioned study depicts seismic activity (module on the
ordinate) as a function of depth in the granitic layer (Gi)
in the Virunga region, i.e. from 0 to 20 km depth.
Figure 21: Seismic activity
behavior in the granitic area of the Virunga area
We conclude that the ground structure studied using
vertical subdivision (Ai) in the vicinity of Nyiragongo
volcano is similar to that studied in the granitic area of the Virunga area.
3.2.2.4.3 Comparison of
soil structure and seismic activity
Figures 22 and 23 depict the seismic activity and soil
structure in Virunga area, respectively, by using
angular coefficients (b-value and d-value).
Figure 22: Modelingof the
ground structure around Riragongo
This modelingshows that the number of earthquakes
decreases inversely with increasing depth and that seismic activity is, on
average, limited to a depth of 75 km.
The curve below depicts the
DRC's seismic activity as measured by the b-value (0.9918, angular coefficient
of the line).
Figure 23: Seismic activity
modeling in the DRC (Mukange, 2021b)
Because
the two lines (Figure 22-23) have the same trend or shape, it is reasonable to
conclude that there is a linear relationship between soil structure and seismic
activity.
3.2.2.4.4. Distribution of
seismic power and number of earthquakes by sub-area
The curve
below depicts the distribution of earthquakes and power in each sub-area.
Figure 24: Distribution of
seismic energy and number of earthquakes by sub-area
We can deduce the following from this graph:
- The number of earthquakes increases as Ai and Bi
increase, respectively, at A3 and B1.
- According to Ai and Bi, the energy released in A1 and
B3 is greater, respectively.
- The number of earthquakes is lower at A5 and B2,
according to Ai and Bi.
- As a function of Ai and Bi, the energy released is
lower at A3, A4, and B1.
- With some exceptions, there is a link between low
energy and a low number of earthquakes.
- There is no correlation between maximum energy and
the number of earthquakes, and vice versa.
The curve below depicts the distribution of earthquake
density and powerin
each sub-area.
Figure 25: Distribution of
seismic energy density and earthquakes by sub-area.
The figureabove depicts:
-As a function of Ai and Bi,
the volume density of earthquakes is higher at A3 and (B3,B1),
respectively.
-As a function of Ai and Bi,
the volume density of released energy is greater at A1 and B3, respectively.
-As a function of Ai and Bi,
the volume density of earthquakes is lower at A5 and B2, respectively.
-As a function of Ai and Bi,
the volume density of the released energy decreases at A3 and A4 and B1,
respectively.
-With a few exceptions,
there is a correlation between the minimum energy density and the maximum
density of earthquakes at the same location, and vice versa, confirming our
hypotheses.
We
conclude that it is preferable to characterize seismicity in terms of volume
density rather than number of earthquakes or energy. Thus, the concept of
volume density is crucial in this study and in the field of characterization in
general.
The
legend in the figure below attempts to establish a possible correlation between
the three curves.
Figure 26: Distribution of power, number of
earthquakes, and d-value by sub-zone.
NB: the d-value has
been multiplied by 2000.
Once again, there
is a strong correlation between the number of earthquakes curve and the d-value
(which characterizes the structure of the ground). We conclude and confirm that
seismic activity is influenced by ground structure.
3.2.3. Division of the areainto grid-areas ( cij)
The concept of
grid-areas is similar to the concept of vector representation (Mukange, 2021a-b).
Indeed, the
grid-zone Cij is formed by the intersection of the
sub-areasAi
and Bj.
As a result, cij is described as follows:
The seismic level
values (a i) of the vertical sub-areas (Ai) are taken
by I and the seismic level values (b j) of the horizontal sub-areas are taken
by j. (Bj).
We can calculate
the moduleof
the subzones cij using the relation
(12).
In accordance with
the code of table (9), we assign a color to each modulus (Table 10).
Table 9 : shows
the color code for the module slice.
MODULE
Level
Colours
1
Pink
2
Light blue
3
Purple
4
Green
5
Yellow
6
Orange
7
Light red
Table 10: Assignment of
color to the module of each zone-grid cij
AREAS-GRIDS
b
a
MODULE
SEISMIC LEVEL
COLOUR CODE
C11
6
7
9,21
5
Yellow
C12
6
4
7,21
4
Purple
C13
6
5
7,81
4
Purple
C14
6
3
6,7
4
Purple
C15
6
2
6,32
4
Purple
C21
1
7
7,07
4
Purple
C22
1
4
4,12
3
Green
C23
1
5
5,09
3
Green
C24
1
3
3,16
2
Light blue
C25
1
2
2,23
2
Light blue
C31
7
10,63
6
Orange
C32
8
4
8,94
5
Yellow
C33
8
5
9,43
5
Yellow
C34
8
3
8,54
5
Yellow
C35
8
2
8,24
5
Yellow
The
results of the above table, particularly the use of the color code, lead to the
characterization of grid-areas in the form of seismic zoning (Figure 27),
highlighting five groups:
Table 11: Colorstatistics (module)
N°
COLOURS
AREAS-GRIDS
CONTRIBUTION(%)
1
PURPLE
C12, C13, C14, C15, C21
5/15 (33%)
2
BLUE
C24, C25
2/15 (13,3%)
3
GREEN
C22, C23
2/15(13,3%)
4
YELLOW
C11, C32, C33, C34, C35
5/15 (33%)
5
ORANGE
C31
1/15 (7%)
The
results of this table are converted into curves (Figure 27)
Figure 27: Color
distribution (module) in Nyiragongo grid areas.
We estimate
the degree of homogeneity at 33% (5 groups out of 15 Cij),
corresponding to a degree of heterogeneity of 67%.
Figure 28: Characterization
of seismic activity using the zoning map of areas
The results of the table are transformed into curves
(Figure 29) and show the following:
- Seismic activity decreases from west (A1) to east
(A5), - The B1 sub-area is the transition zone between B2 (low activity) and B3
(high activity) (high seismic activity).
Figure 29 :
Figure 29: Characterization of seismicity by using the curves
Finally,
the degree of heterogeneity is calculated as follows: - For horizontal
sub-areas (Bj), we calculate the percentage of the
number of different colors recorded to the total number of Cij
(five for each Bj).
-For the vertical sub-areas
(Ai), we calculate the percentage of the number of different colors recorded to
the total number of Cij (three for each Ai).
-The final degree of
homogeneity is simply the mean of these two (Ai and Bj)
(Table 12)
-At the level of sub-areas A4
and A5, an anomaly appears: the gap between the blue and red curves becomes
extremely large (Figure 29).
Table 12: degree of
heterogeneity relative to each sub-area
Sub-areas
Degree of heterogeneity
Degree of heterogeneityin %
B1
3/5
60 %
B2
4/5
80 %
B3
3/5
60 %
A1
3/3
100 %
A2
3/3
100 %
A3
3/3
100 %
A4
3/3
100 %
A5
3/3
100 %
Average
700/800 =88%
The degree of heterogeneity has increased from
zero to 88%.
According to the formula, the rate of
heterogeneity é is 56% (5/9) when the number of distinct colors (5) in the
figure (28) is divided by the total number of colors in the table (9)
When the number of distinct colors (5) in the
figure (28) is divided by the total number of boxes (15) in the figure (28),
the rate of heterogeneity é is calculated to be 33% (5/15). We'll stick with
the first formula.
3.2.4 Comparison of the structural curves
To compare three structural curves obtained
through various studies, we present them below.
Figure 30: Structural curve of the DRC (10°E-35°E;
6°N-14°S), (Mukange,2021b)
Figure 31: Structural curve of the Virunga
area (25°E-30°E; 1°N-4°S),(Mukange,2022a)
Analysis of these
three structures reveals the following:
- Moving from west
to east (Ai), the shape is the same for the DRC (Figure 30) and the Virunga region (Figure 31); they are the inverse of Nyiragongo (Figure 321). This difference is due to the fact
that the Nyiragongo zone is located in the front
(29°E), a less seismic area , whereas the areaof major fractures and intense seismic activity is located between 30°E
and 35°E.
- From North to
South (Bj), the three structures exhibit the same
trend: seismic activity decreases from north to south.
- These findings
support previous research (Mukange, 2016), which
found that the DRC's seismicity is better described (diversified) in terms of
longitude (West to East) than latitude (North to South).
3.2.5. Crater location
Starting with the assumption that the crater is located where: - the
volume density of the number is abnormally high, - the volume density of the
seismic energy of tectonic or volcano-tectonic earthquakes is very low.
Based on these assumptions, other distinguishing features, and the
application of the results in Figures (24-25), the crater of Nyiragongo volcano is located at subarea C13 (B1, A3)
[29.25°E; 1.50° S]. The black bubble in Figure indicates this location (28).
These findings are consistent with the observations made in the field (Figure
5). This confirms our hypotheses, which should be generalized and confirmed
through additional research.
The design of a characterization scale enabled
the study of volcano-seismic activity in the vicinity of the Nyiragongo volcano in the DRC's Virunga
area, the western branch of the East African Rifts, as well as the search for
techniques for locating its crater on the basis of seismic data. This scale,,, very simplified because it contains only three
parameters, introducing the structure constant known as the d-value and the
concept of the volume density of energy or number of earthquakes has produced
the following results:
-This once homogeneous area, now subdivided into sub-areas, is no longer
homogeneous: When examined vertically and horizontally, it reveals a degree of
heterogeneity of 80 and 100%, respectively.
-The final degree of heterogeneity of the area is 88%, ranging from
homogeneous to 12%. Thus, a structure's homogeneity is determined by the scale
used to observe it.
-The seismic species identified in this area are Iab,
Iac, Ibb, Ibc, IIIbb, and IIIbc, while the structure factors are (ab,
ac, bb and bc).
-Analysis of these three structures, DRC (10°E-35°E; 6°N-14°S), Virunga area (25°E-30°E; 1°N-4°S°), and around Nyiragongo Volcano (29.00°E-29.50°E; 1.45°S-1.75°S),
reveals the following:
Going from West to East (Ai), the shape ofstructures is the
same for the Democratic Republic of Congo and Virunga;
they areopposites of Nyiragongo. This difference is due to the fact that the Nyiragongo zone is located before (29°E), a less seismic
area, whereas the area of major fractures and intense seismic activity is
located between 30°E and 35°E. Around 28°E, Virunga
and Nyiragongo structures share the same shape. From
North to South (Bj), the three structures follow the
same pattern: Seismic activity decreases from North to South.
These findings support previous research (Mukange, 2016), which found that the seismicity of the
Democratic Republic of Congois better
described (diversified) in terms of longitude (West to East) than latitude
(North to South).
-The ground structure surrounding the volcano from North to South
(horizontal subdivision) is similar to that studied in the Virunga
region at a depth ranging from 25 to 105 km; - the soil structure surrounding Nyiragongo volcano following vertical subdivision (Ai) is
similar to that studied in the Virunga area's
granitic area.
-We see a strong correlation between the number of earthquakes and the
d-value once more (characterizes the ground structure). We conclude and confirm
that seismic activity is determined by the ground structure. - In a volcanic
area, there is a correlation between the maximum volume density of tectonic
earthquake energy and the minimum density of earthquakes, with some nuances.
-It is preferable to characterize seismicity in terms of volume density
rather than number of earthquakes or energy. Volume is thus an important
concept in this study.
-The confirmation of the crater's location assumptions Indeed, these are
the assumptions:
The crater is located in an area with an
abnormally high volume density of volcanic earthquakes. - Using these
assumptions and other distinguishing factors, we were able to pinpoint the
crater of Nyiragongo volcano at [29.25°E; 1.50°S].
These findings are consistent with field observations. Nonetheless,
confirmation of these hypotheses is required before they can be generalized. As
a result, we must continue our research using our model.
REFERENCES
1.Bahaya B., (2021). Modélisation
numérique du transfert de chaleur par conduction au sein du volcan Nyiragongo.
Thèse de Doctorat : Université Pédagogique Nationale, Faculté des Sciences.
Département de Physique
2.Bantidi M., Wafula M., Mavambou, Mukange B., ZanaNd., (2014a). Probabilistic assessment of seismic hazard in
Lake Tanganyika Rift accounting for local geologies conditions. 2015. International Journal of Geology,
Agriculture and Environmental Sciences. Vol.03 Issue 02 (April 2015),
pp24-29.
3.Bantidi M., Mukange B., et Zana N., (2014b).
Structure de la sismicité de la Branche occidentale des Rifts Valleys du système des Rifts Est-africains ; de 1954 à
2010, International Journal of Innovation
and AppliedStudies,
ISSN 2028-9324 Vol. 9 No. 4 Dec. 2014, pp.1562-1581.
4.Borden J-P., (1988). Biologie-Géologie. Première S. Paris:
Bordas
5.Kamate K., (2018). Pétrographie et
géochimie des laves du volcan Nyiragongo (Nord Kivu, RD Congo) : influence de
la viscosité sur les paramètres de propagation des coulées de laves menaçant la
ville de Goma. Master de spécialisation : Université de Liège, Faculté des
Sciences. Département des Sciences et Gestion de l’Environnement.
http://hdl.handle.net/2268.2/5534
6.Lay T., Wallace T., (1995). Modern Global seismology. New-York : Academic Press
7.Lubemba A., (2021).Analyse des effets des gaz volcaniques et
des ilots d’évapotranspiration sur les paramètres climatiques autour du Volcan.
Thèse de Doctorat : Université Pédagogique Nationale, Faculté des Sciences.
Département de Physique
8.Mukange B., Bantidi M., ZanaNd. (2013). Structure de la sismicité de la Branche
orientale des Rifts Valleys du système des Rifts
Est-africains ; de 1954 à 2010.
Revue Congolaise des Sciences Nucléaires. vol.27, pp151-169.
9.Mukange B., Bantidi M., Zana L., Wafula M., ZanaNd. (2015). The isoseismal map and their implication to underlining ground
degree of heterogeneity (Kabalo quake’s case,
September 11, 1992, magnitude 6.7, Upemba Rift). Greener Journal of Geology and Earth
Sciences, vol. 3 (2), pp 030-042.
10.Mukange B., (2016).
Conception d’un modèle physique pour la
caractérisationet la surveillance de
l’activité sismique et son implication géologique(Cas de la
République Démocratique du Congo). Thèse de Doctorat : Université de Kinshasa,Faculté des Sciences. Département de
Physique.
11.MukangeBesa, (2021). Cours de Géophysique générale.
Université de Kinshasa, Faculté des Sciences.
12.Mukange B., (2021a).Design
of a unified scale for the characterization of seismic activity. International
Journal of Innovative Science and Research Technology, Volume 6, Issue 7, July–
2021, pp.1407-1422. www.ijisrt.com
13.Mukange B., (2021b).Application
of the unified scale to the characterization of seismic activity of the
Democratic Republic of Congo and its surroundings (comparative study for
Africa, Indonesia and the Pacific coast of Central America). International
Journal of Innovative Science and Research Technology, Volume 6, Issue 7, July–
2021, pp.1516-1555. www.ijisrt.com
14.Mukange B., (2023b). Characterization of the volcano-seismic activity around Nyamulagira volcano and location of its crater by means of
unified scale. Greener Journal of Geology and Earth Sciences, 5(1) December
2023: 52-75. http//gjournals.org/GJGES.
15.Mukange B., (2023c). Highlighting the fine structure of the seismic zones of
the western branch of the east african rift system
using the unified characterization scale and its geological implication
.Greener Journal of Geology and Earth Sciences, 5(1) December
2023: 76-108. http//gjournals.org/GJGES.
16.Ongendangenda A., (2020). Volcanologie de la chaîne des Virunga. Paris: L’Harmattan.
17.Wafula M., D. Atiamutu et M. Ciraba, (1999).
Activité séismique dans les Virunga (Rép.Dém. Congo)
liée aux éruptions du Nyiragongo et Nyamuragira, deNovembre 1994 à Décembre 1996. Mus. roy. Afr. centr.
Tervuren Belg., Dépt. Géol.
Min. Rapp. Ann. 1997 & 1998, pp. 309 - 319.
18.Wafula M.D., Kasereka M., Rusangiza
K., Kuvuke K., Mukambilwa
K., Ciraba M. &Bagalwa
M., (2009). The Nyamulagira Volcanic Eruption on
November 27, 2006, Virunga Region, D.R. Congo. Cahiers du
CERUKI, Numéro Spécial CRSN-Lwiro(2009), pp. 108 - 115.
19.Wafula M.D, Zana A. Kasereka
M. and Hamaguchi H., (2011a). The Nyiragongo
volcano: A case study for the Mitigation of Hazards on an African Rift Volcano,
Virungaregion, Western African Rift Valley, 32 pp.
20.Wafula M., (2011b). Etude
Géophysiquede l’Activité Volcano-Séismique dela Régiondes Virunga, Branche
Occidentale du Système des Rifts Est-Africains et son Implication dans la
Prédiction des Eruptions Volcaniques. Thèse de Doctorat : Université de
Kinshasa,Faculté des Sciences.
21.Zana N, (1977). The Seismicity of the
Western Rift Valley of Africa and related problems. Doctorat Theses, Tôhoku
University. 189 pp.
22.Zana N. and K. Tanaka, (1981). Focal mechanism of major earthquakes in the WesternRift Valley of Africa,TôhokuGeophys. Journ. (Sci. Rep. TôhokuUniv. Ser. 5), Vol.28, Nos
3-4, pp: 119 - 129.
23.ZanaNdontoni A., (2004), Cours de Géophysique :
Introduction à la géophysique générale, UNIKIN, Kinshasa
24.Zana
A., (2010), Détonateur Potentiel de Tsunami au lac Kivu, Conférence débat,
Cite this Article: Mukange, BA; Ntedika, ME; Zana, NA; Tondozi, KF (2023). Characterization of the Volcano-SeismicActivityaround
Nyiragongo Volcano and Location of itsCrater by Means of UnifiedScale.Greener Journal of Geology and Earth
Sciences, 5(1): 28-51.