In the Previous works, the DRC area (10°E-35°E; 6°N-14°S) was homogeneous,
but once subdivided into square sub-zones of side 5°, it was rendered
heterogeneous but homogeneous in the Virunga region
(25°E-30°E; 1°N-4°S°) (Mukange; 2021b). The
previously homogeneous Virunga zone was made
heterogeneous but homogeneous in the area around the Nyamulagira
volcano (29.0°E-29.5°E; 1.2°S-1.5°S), by subdividing it into square sub-zones
of dimension 1°. (Mukange; 2023a). These characterisations were made possible by the development
of a model that generates seismic species by using the unified scale. The
goal of this research is to characterize the 'homogeneous' region surrounding
the Nyiragongo volcano, subdividing it into square
sub-zones of 0.1° dimension, and to find a method for locating the crater.
To accomplish this, we developed an appropriate
unified scale for characterisation on the one hand,
and made the following assumptions on the other: The crater is located where
the volume density of the number of volcanic earthquakes is abnormally high,
while the volume density of tectonic or volcano-tectonic earthquake energy is
very low.
Following the processing of earthquake data from
the region from 2016 to 2021, the research revealed the following:
The seismic species identified in this area are Iab, Ibc, IIIbb,
and IIIbc, as well as structure factors (ab,bb and bc).
The final
degree of heterogeneity in an area is 70%, corresponding to a homogeneity of 30%.
Thus, the notion of a structure's homogeneity is
dependent on the scale used to observe it, - Confirmation of hypotheses.
Indeed, according to the hypotheses advanced on the one hand and field
observations on the other, the crater is located at the geographical
coordinates [29.2°E; 1.45°S]. Other significant outcomes were obtained,
including;
There is a strong correlation between the
earthquake number curve and the d-value (which characterizes the ground
structure).
It has been concluded and confirmed that seismic
activity in this area is dependent on the soil structure.
These findings support previous research (Mukange, 2016), which found that the seismicity oftheDRC is better described (diversified) in terms of longitude (West to
East) than in terms of latitude (North to South).
Moving from West to East, the shape of the
structure is the same for both the DRC and the Virunga
region; the latter has the opposite shape to Nyamulagira.
This difference is due to the fact that the Nyiragongo
area is located before (29°E) the major fracture zone (30°E) where seismic
activity is very intense. But, compared to 29°, the two structures have the
same shape.
Our previous research
(Mukange, 2016; Mukange
2021a-b) on the characterisation of seismicity in an
area in general, and that of the Democratic Republic of Congo (DRC) in
particular, has highlighted, on a regional study scale, the homogeneity of
seismicity in the Virunga area, peculiar toNyamulagira and Nyiragongo volcanoes.
These two volcanoes
are of great interest to the scientific community and merit further
investigation, particularly in terms of improving monitoring and research into
techniques and modeling for possible prediction.
As a result, our
research on the characterisation of the Nyiragongo volcano's surroundings will include the
following objectives:
-Establish the
relationship between soil structure and seismic activity in the area (modelling),
-To establish the
relationship between soil structure and seismic activity in the region
(modeling),
-To demonstrate that,
on closer inspection, this previously shown to be homogeneous seismic activity
is, in fact, somewhat heterogeneous,
-Try to locate the
volcano's crater using the following assumptions:
The crater is located
in an area with a high earthquake density (volume).
The crater is situated
in an area with a low density (volume) of energy released by tectonic or
volcano-tectonic earthquakes.
The crater is located
in an area with a low density of earthquakes and energy released.
The East African Rift System is portrayed as a continental extension of
the global system of lithospheric fractures that run through the middle of the
Atlantic and Indian Oceans and extend into the eastern part of Africa via the
Gulf of Aden and the Red Sea (Mukange, 2016; Boden et al. 1988; Bantidi,
2014a).
This fracture system is divided into two branches: the eastern branch,
which runs from the Afar triangle through Ethiopia and Kenya to the northern
Tanzanian divergence (Figure1); Mukange, 2013; and
the western branch, which runs from the Afar triangle to the northern Tanzanian
divergence.
The western branch is made up of fractures that run through the Great
Lakes daisy chain, from Lake Albert (617m altitude) to Lake Edward (912m), Lake
Kivu (1462m), Lake Tanganyika (780m), Lake Rukwa
(782m), Lake Malawi (460m), and Mount Beira in Mozambique and South-West to
Lake Kariba in Zimbabwe (Figure1). This branch thus
covers the majority of the DRC's eastern provinces between latitudes 4°N and
8°S.
The East African Rifts stretch more than 6,000 kilometers from the Red
Sea to the Zambezi.
The two branches join at Lake Malawi after splitting at the Aswan
Lineament (Figure 1).
The DRC's seismic activity also includes the typical intra-plate
fractures that affect the entire Congolese basin, known as the "Congolese craton."
Figure 1 : East African
Rift System: major faults are depicted as solid lines, while water is depicted
as blue and volcanoes are depicted as red.
The Congolese Rift has
three major volcanic provinces: Toro-Ankole Province
in the north, Virunga Province (Nyiragongo
and Nyamulagira volcanoes...) in the center, and
South Kivu Province in the south (Zana and Tanaka,
1981; Zana, 1982; Ngindu,
2009). (Wafula et al., 1989; Wafula et al., 2009).
The Virunga volcanic region lies to the north of Lake Kivu.
This region is made up of eight volcanoes that are divided into three groups
known as volcanic provinces: the eastern group, which includes the Muhavura volcanoes (4127 m a.s.l.),
Gahinga (3474 m), and Sabinyo
(3647 m), and the central group, which includes the Gahinga
volcanoes (3474 m) and Sabinyo (3647 m).
Central group consists of the volcanoes Isoke (3911 m), Karisimbi (4506
m), and Mikeno (4437 m), while the western group
consists of Nyiragongo (3470 m) and Nyamulagira (3056 m). Except for the brief eruption of Mugogo on August 1, 1957, the volcanoes of the first two
subgroups are currently dormant. Mugogo is 2350
meters above sea level and 11 kilometers north of Visoke;
it is considered a satellite cone of the latter (Visoke).
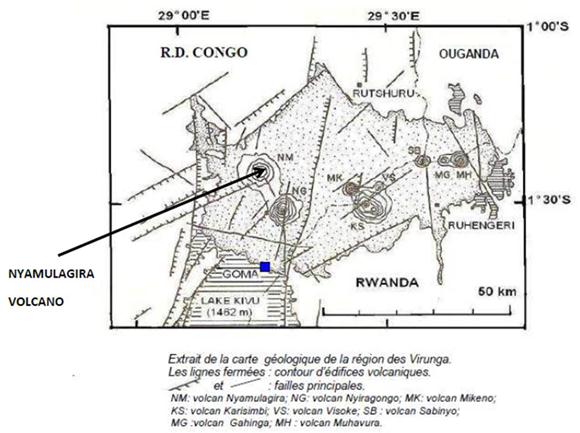
Geophysical research
carried out on the Virunga region in general and the Nyamulagiravolcano in particular
indicate that it is characterized by a flow of feldpathic
lavas (Ongendangenda, 2020).
Figure 2 : The volcanic
provinces of the Virunga region
The western group's
volcanoes are among the most active in the world today: Nyamulagira
due to the frequency of eruptions (on average every two years) and Nyiragongo due to its permanent lava lake in the central
crater. It is immortant to notethat Nyiragongo is
regarded as one of the most dangerous volcanoes on the planet due to its
proximity to the city of Goma (15 km from the crater,
with an estimated population of over one million) and the superfluidity
of its lava, which can flow at speeds of up to 40 km/h (Wafula,
thesis). These two volcanoes are in the same area of the Rift Axis fractures
(Figure 3). The volcanic rocks of these two volcanoes are basalts rich in
alkaline elements with a high potassium concentration, which would explain the
lava's hyper fluidity. The volcanic activity of these two volcanoes is of the
Hawaiian type, characterized by effusive and passive lava emission with low
viscosity (100-1000 poises) and very high temperature (1000°C). Mount Erebus in
the Arctic, Kilauea in the Pacific, and Erta Alee in
Ethiopia are the only other such volcanoes in the world.The frequency classification of the
seismograms is similar to that of the Redoubt volcano in Alaska: type A
volcanic earthquakes (4-10 Hz), type B (1-4 Hz), type C (peak at 2.6 and 8 Hz),
and tremors (1-2 Hz) are recorded in the Virunga
area. The last eruption of Nyiragongo volcanooccurred on May 22, 2021.
Figure 3 : Structural
geology of the Virunga region and location of
volcanoes
More than 1300
volcanoes provide a rhythm to the earth's internal activity. The majority of
them are active.
Nyamulagira
is a volcano in the Democratic Republic of the Congo (DRC) and one of the most
active volcanoes in Africa. It is one of the volcanoes on the western branch of
the Great Rift Valley and is part of the Virunga
Mountains.
Nyamulagira
volcano is bounded to the northwest by the town of Burungu,
to the south-southeast by Nyiragongo volcano, to the
south by Lake Kivu, and to the southwest by the town of Sake.
Nyamulagira volcano
rises 3058 meters above sea level and has a summit caldera two kilometers wide
by 2.3 kilometers long, surrounded by hundreds of meters high cliffs.
Slopes of Nyamulagira volcano are not very pronounced, as is typical
of shield volcanoes, and give the volcano a volume of 500 km3 compared to its
immediate neighbor Nyiragongo volcano.
These slopes are
punctuated by fissures and scoria cones, and they are covered by basaltic lava
flows with a high potassium content that are very
extensive, sometimes reaching lengths of 30 kilometers.
This fissure is
thought to be the main source of Nyamulagira's
weakness. As a result, it is the most active zone of the Nyamulagira
and Nyiragongo volcano fields.
Earthquakes at Nyamulagira volcano are caused by magma accumulation in the
magma chamber. Seismographs record a plethora of micro-earthquakes (tremors)
caused by fractures in compressed rocks or magma degassing.
The progressive rise
of the hypocenters (linked to magma rise) indicates that the Nyamulagira volcano is in the process of awakening and that
an eruption is imminent.
Because Nyamulagira is a shield volcano, the lava it produces is
polygenic. This is due to the volcano's fluid and hot magmas, which allow for a
two-phase conviction that prevents the chimney from closing due to material
solidification.
Nyamulagira
volcano is capable of dumping tens of millions of cubic meters of lava into
nature in the form of flows reaching more than 20 kilometers from the point of
emission, annihilating everything in its path. The volcanic products emitted,
such as slag, volcanic ash, Pelee's hair, and so on,
can travel a long distance with the wind, destroying and polluting fields,
pastures, and river waters.
.
Figure 4a: Panorama of Nyamulagira
volcano.
Nyamulagira volcano eruptions have wreaked havoc on the Virunga National Park, killing many animals and destroying
vast swaths of land.
The plume of smoke and
dust emitted during each eruption can rise into the atmosphere to the base of
the stratosphere, obstructing air navigation and causing aircraft damage if
pilots are not warned to avoid the affected area.
Since 1980, the Nyamulagira volcano has erupted every two years on average.
Nyamulagira volcano has erupted more than 30 times on
its flanks with lava flows since the turn of the century (Table 2.1). The
various cones associated with the eruptions of Nyamulagira
volcano have been depicted on the map (Fig. 2.10).
The most recent
eruption of Nyamulagira volcano occurred on April 18,
2018.
Figure 4b: depicts the distribution of the various
cones associated with the eruptions of the volcano Nyamulagira
from 1901 to 2011. (afterKasahara, 1991, modified).
- Eruptive sites are
indicated by a solid black circle.
The basic data for Nyamulagira volcano were collected at the GomaVolcanological Observatory
(GVO) between 2016 and 2021, covering the geographical area between 29°E and
29.5°E longitude and 1.2°S and 1.5°S latitude (Figure 5). These data, however,
lack magnitudes.
These data, however,
lack magnitudes. In order to respond to the second hypothesis, we have
associated the tectonic earthquakes with their magnitudes provided by the USGS
agency.
Figure 5 :Area
Circumscription being investigated: Surroundings ofNyamulagira volcano
The fundamental data for
each event includes the elements illustrated in the table below.
The figure above
illustrates a study area within the geographic range of 10°E-35°E longitude and
6°N-14°S latitude. The study area (29.0°E-29.5°E and 1.45°S-1.75°S) is included
in the "homogeneous" seismic area A42 (25°E-30°E and 4°S-9°S).
The results of the
above figure have been transformed into curves, known as "geoseismic signature" (Figure 7).
Figure 7 :
Geo-seismic signature of the DRC area
A more detailed study
(Mukange, 2023c) was conducted to highlight the
heterogeneity of the A42 zone (25-30°E, 1°N-4°S); it was sufficient to
subdivide the said zone into square sub-zones of one degree side (Figure 8).
The area is divided
into two parts by the figure (8): the sub-area between 25° and 28°E and the
sub-area between 28°E and 30°E. The first sub-zone, on the other hand, is
divided into two parts, one between 25° and 26°E and the other between 26° and
28°E.
A study similar to the
previous ones will be conducted in this zone to characterize it and highlight
its 'heterogeneous' nature.
Figure 8: Seismic zoning for assessing seismic hazards
in the Virunga area, A42.
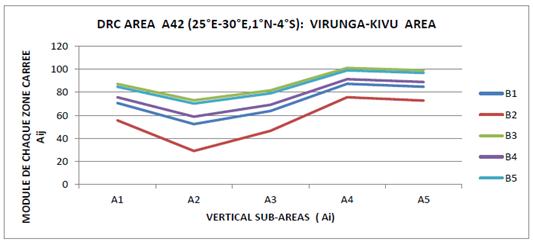
The above figure's
results have been transformed into curves known as "geoseismic
signatures" (Figure 9).
Figure 9: Geoseismic
signature of the Virunga area vertical sub-areas (Ai)
The two figures below
depict the distribution of hypocenters around Nyamulagira
volcano.
Figure 10: Distribution of hypocenters as a function
of longitude around Nyamulagira volcano
Our primary goal is to characterize the seismicity
around the volcano. To do so, we must create a unified and appropriate scale.
This scale must incorporate various classical parameters that we will need to
calculate in each sub-area; these parameters are as follows:
- The total number of earthquakes,
- The total energy released by earthquakes,
- The maximum Magnitude,
- The maximum depth of the hypocenters,
- Surface of each sub-area,
- Volume of each sub-area,
- The frequency of earthquakes
- Energy density,
- The b-value and "d-value" ( Lay,1995; Mukange,2016)
- The degree of
heterogeneity
2.2.2. Method of
analysis
The data will be processed by subdividing the area
into vertical and horizontal sub-areas. In each of them, we will calculate the
parameters listed above and group them in a table (5).
2.2.2.1. Vertical
subdivision of the area, Ai
The study area is divided into five vertical sub-areas
in 0.1 degree steps from west to east (Figure 12, Table 2).
Figure 12: Subdivision of the area into vertical
sub-areas (Ai)
Table 2: Limits and numbers of earthquakes in
each vertical sub-area.
N°
Area
Limitsof areas
Numbers
ofearthquakes
Longitude(°)
Latitude(°)
1
A1
29,0°E-29,1°E
1,2°S-1,5°S
103
2
A2
29,1°E-29,2°E
1,2°S-1,5°S
144
3
A3
29,2°E-29,3°E
1,2°S-1,5°S
146
4
A4
29,3°E-29,4°E
1,2°S-1,5°S
27
5
A5
29,4°E-29,5°E
1,2°S-1,5°S
9
Total
A1+A2+A3+A4+A5
29,0°E-29,5°E
1,2°S-1,5°S
429
2.2.2.2. Horizontal subdivision of the Bj area
The same area is, this
time, subdivided into three horizontal sub-areas by steps of 0.1 degree. (Figure
13, Table 3).
Figure 13: Subdivision of the area into horizontal
sub-areas (Bj)
Table 3: Limits and number of earthquakes of each
horizontal sub-area
N°
areas
Limits
of areas
Numbers
of earthquakes
Longitude(°)
Latitude(°)
1
B1
29,0°E-29,5°E
1,2°S-1,3°S
97
2
B2
29°E-29,5°E
1,3°S-1,4°S
158
3
B3
29°E-29,5°E
1,4°S-1,5°S
174
Total
B1+B2+B3
29,0°E-29,5°E
1,2°S-1,5°S
429
2.2.2.3. Calculation
of SeismicParameters
The classical seismic parameters for each sub-zone are
calculated as follows:
2.2.2.3.1. The
number of earthquakes
This consists of counting all the earthquakes that have
occurred in each sub-area for the period from 2016 to 2021 (Tables 1-2).
These results are converted into percentages according
to the following relationship:
(1)
Whereis the total
number of earthquakes in each Ai orsubareais the total number of earthquakes in the
whole study area.
2.2.2.3.2. The
maximum magnitude
The operation consists in locating the largest
magnitude recorded in each sub-area.
2.2.2.3.3. The
energy of the earthquakes
The seismic energy released by each earthquake is
determined, in Erg, through the formula
(2)
Thus, the total energy (ETk)
in the sub-zone (k) is the sum of the energies of each event.
In percent, we use the
following formula:
(3)
With E k, the total
energy released by all recorded earthquakes in the entire study area.
2.2.2.3.4 Maximum and minimum depth
This identifies the greatest
depth (hypocenter) recorded in each subarea.
2.2.2.3.5 The surface of each sub-area
Each sub-area has a
rectangular shape, and its surface (S) is calculated using the following
formula:
S=L.l(4)
L and l are the length
and width of the subarea, respectively.
Remember that
1°=111.11km
2.2.2.3.6 The volume of each sub-area
The volume (V) of each
sub-area is calculated using the following formula:
volume=area*maximum depth(5)
2.2.2.3.7. The volume density of earthquakes
The volume density (Ds ) of earthquakes in each sub-area is obtained by the
following formula:
(6)
Ns is the total
number of earthquakes in each sub-zone (Ai or Bj),
(V) the volume of each sub-zone.
The volume density of
earthquakes in percentage is determined by the following relation:
(7)
With
DT, VT,
NT represent respectively the total density, the total volume and
the total number of earthquakes of the whole area constituted by the sub-areas
Ai or Bi.
2.2.2.3.8. Energy density by volume
The percentage energy
density is calculated in the same way as for earthquakes, provided that the
number of earthquakes in the zone or sub-zone is replaced by the energy. Hence:
(8)
In percentage it is
demined for each sub-area by the following relationship:
.100(9)
2.2.2.3.9. The b-value and the d-value
The relationship:
(10)
Used to characterize
the seismic activity through the calculation of the value of the angular
coefficient b, called the b-value (reference). This parameter has not attracted our attention. In
the same way as before,
The relationship:
(11)
is used to characterize the soil structure through the
calculation of the value of the angular coefficient d, introduced by us, called
the d-value (Table 4, Figure 14).
Where m_b is replaced by H , the depth in relation (10) .
Table 4:
Statistics on the number of earthquakes by depth range
H≥
N
LOG(N)
0
103
2,01283722
5
43
1,63346846
10
36
1,5563025
15
21
1,32221929
20
19
1,2787536
25
15
1,17609126
30
12
1,07918125
35
12
1,07918125
40
9
0,95424251
45
5
0,69897
50
5
0,69897
55
2
0,30103
60
1
0
Figure 14: An
illustration of how the d-value parameter is determined.
At the appropriate time, the parameter known as
"degree of heterogeneity" will be defined and calculated.
3.
PRESENTATION AND DISCUSSION OF THE FINDINGS
3.1.
Presentation
The values of the various parameters calculated using
the above formulas are shown in the table below:
Table 5:
Synoptic table of calculated seismic parameters
Area
d-value
number
of earthquakes
number of earthquakes (%)
Max
magnitude
Energy
(Erg)
Energy
(%)
Hmax
(km)
surface
(km²)
volume
(km3)
Density
volume
earthquakes
Density
volume
earthquakes
Density
volume
earthquakes (%)
Densityofenergy
(%)
A1
0,027
103
24,00932
4,24
9,68E+15
3,02E-01
61
363
22143
0,004651583
4,37E+11
175,1499866
2,20E+00
A2
0,028
144
33,56643
4,47
3,39E+16
1,06E+00
67
363
24321
0,005920809
1,39E+12
222,9412379
7,02E+00
A3
0,029
146
34,03263
4,44
2,91E+16
9,08E-01
89
363
32307
0,004519144
9,01E+11
170,1631702
4,54E+00
A4
0,03
27
6,293706
4,02
2,84E+15
8,86E-02
71
363
25773
0,001047608
1,10E+11
39,44646902
5,55E-01
A5
0,031
9
2,097902
4,91
3,85E+17
1,20E+01
58
363
21054
0,000427472
1,83E+13
16,09597299
9,21E+01
B1
0,032
97
22,61072
5,09
1,04E+18
3,24E+01
89
616
54824
0,001769298
1,90E+13
66,62087912
9,56E+01
B2
0,033
158
36,82983
5,13
1,32E+18
4,12E+01
60
616
36960
0,004274892
3,57E+13
160,9661172
1,80E+02
B3
0,034
174
40,559
4,91
3,85E+17
1,20E+01
67
616
41272
0,004215933
9,33E+12
158,7461046
4,70E+01
Total
0,035
429
100
3,21E+18
1,00E+02
89
1815
161535
0,002655771
1,98E+13
100
1,00E+02
3.2. Discussion of Results
3.2.1. Characterization scale design
The characterization of an area's seismic activity necessitates the development of a unified characterization scale that can reasonably incorporate all calculated parameters (Table 5).
Our characterization scale consists of three parameters and is written as follows:
X 12, which is made up of two parts: the form factor and the structure factor: where X is the volume density of energy (D E in%) of each sub-area.
It is referred to as the "form factor."
X can have the value I, II, III, or IV, with I if D E (%) is 25%, II if D E25% D E (%) 50%, and III if D E (%) > 50%.
The number 1 in subscript represents the earthquake volume density (D s in%) of each subarea.
It is defined as follows:
If D s is greater than 50%, the number 1 takes the index b, otherwise the index a.
Number 2 is interested in the d-value and uses the following values:
If the d-value is less than 0, then number 2 takes index a; if the d-value is greater than 0, then number 2 takes index b; and if the d-value is greater than 0, then number 2 takes index c.
The group of numbers (1,2) in index is known as the "structure factor."
The combination of our three seismic parameters assigns to each sub-area a unique value called seismic species, the results of which are shown in Table (7).
3.2.2 Interpretation
of results
Interpretation of the results consists of characterizing the area and locating the volcano's crater based on the obtained
results and hypotheses.
3.2.2.1. Seismic species, seismic levels, and color
The seismic species associated with each sub-area
were ranked in ascending order based on the level of seismic
activity and ground structure.
Finally, each seismic level is assigned a color (Tables 6-7).
If D s is greater than 50%, the number 1 takes the
index b, otherwise the index a. Number 2 is concerned with the d-value and uses
the following values: If d-value is less than 0, then number 2 takes index a;
if d-value is greater than 0, then number 2 takes index b; and if d-value is
greater than 0, then number 2 takes index c.
The group of numbers (1,2) in
index is referred to as the "structure factor."
The combination of our three seismic parameters gives
each sub-area a unique value called seismic species, the results of which are
shown in Table (7).
Table 6: Each
seismic level is assigned a color
Seismiclevel
colour
1
Rose
2
bleu
3
Vert
4
jaune
5
violet
6
Orange
7
Rouge
clair
8
Rouge
foncé
Table 7 : Each subzone has a different color code, seismic
species, and seismic level.
Sub areas
Seismicspecies
Seismic level
Colour code
A1
IIIbc
7
Light
red
A2
Ibc
4
Yellow
A3
Ibc
4
Yellow
A4
Iab
1
Pink
A5
Iab
1
Pink
B1
IIIbb
6
Orange
B2
Ibc
4
Yellow
B3
IIIbc
7
Light
Because of the reason, this scale differs from
previous ones (MUKANGE 2021a) in a few ways: With several parameters,
• She has been greatly simplified to fit into three
parameters; • She incorporates the structure constant known as the d-value;
• She introduces the concept of volume density (of
energy or a number of séisms).
3.2.2.2.
Vertical and horizontal zone map
The results of Table (7) are used to create the
seismic zone maps shown below.
We notice that each sub-area is distinct,
and that when comparing the two subdivisions (Figure 15 and 16) on the eight
sub-areas, two colors are shared (yellow and red). This demonstrates that
seismicity and ground structure are not the same when studied vertically or
horizontally.
3.2.2.3 Degree
of heterogeneity
The degree of heterogeneity is determined by the ratio
(in percentage) of the number of different colors to the total number of sub-zones
(Table 8). It can also be calculated as the ratio of the distinct colors to the
total number (8) of possible colors in the table (7).
Table 8 :shows the
overall degree of heterogeneity of the sub-areas.
Sub-areas
Degree ofheterogeneity
Degree ofheterogeneity in %
Ai
3/5
60
%
Bj
3/3
100
%
Average
80%
We note that this area, which was previously homogeneous
and subdivided into sub-areas, is no longer homogeneous: when studied
vertically and horizontally, it exhibits a degree of heterogeneity of 60 and
100%, respectively, for an average of 80%.
3.2.2.4
Interpretation of other parameters
The evolution of the parameters according to sub-areas
is shown below.
3.2.2.4.1
D-value evolution
The d-value defines the soil structure, and its
evolution by sub-area is as follows:
Figure 17
depicts the evolution of the parameter d-value in each sub-area.
This curve demonstrates that the structure of the
sub-area A2 is similar to that of A4 and the same as that of A3 and A5.
3.2.2.4.2 The
evolution of Ai and Bj as a function of maximum depth
The characterization is carried out here by following
the distribution of hypocenters on each vertical sub-area.
Figure 18:
Distribution of maximum hypocenters in each Bj
sub-area: modeling
We observe that the distribution of maximum
hypocenters from West (A1) to East (A5) around Nyamulagira
volcano follows a parabolic law of upward concavity;
The shape of the above curve is similar to that
obtained in our previous research (Mukange, 2021b).
Indeed, the curve below shows the seismic activity
(modulus on the ordinate) as a function of depth in the basaltic (Bi, on the
abscissa) and sub-basaltic (SM1) layers in the Virunga
area, i.e. from 25 to 105 km depth.
Figure 19:
Seismic activity behavior in the basaltic and sub-basaltic zone of the Virunga area
We conclude that the ground structure studied in the
area of the volcano going from west to east (vertical subdivision, Ai) is
similar to that studied, in terms of seismic activity, in the Virunga region at a depth of between 25 and 105 km (Figure
19). These two parabolic curves are the inverse of the one that describes the
seismic structure studied in the vicinity of the volcano going from North to
South (Figure 20).
Figure 20:
Distribution of maximum hypocenters in each Bj
sub-area of the volcano region: modeling.
The above curve has a similar shape to that obtained
in our previous research (Figure 21).
Indeed, the curve below depicts seismic activity
(modulus on the ordinate) as a function of depth in the Virunga
region's granitic layer (Gi), i.e. from 0 to 20 km depth.
Figure 21:
Seismic activity behavior in the granitic zone (0-20 km) of the Virunga area.
3.2.2.4.3.
Comparison between soil structure and seismic activity
The following curves, Figure 22 and 23, present
respectively, through their angular coefficients (b-value and d-value), the
seismic activity and the ground structure in the Virunga
area.
Figure 22:
Model of the ground structure around Nyamulagira
According to this model, the number of earthquakes
decreases inversely as depth increases. The same is true for the number of
earthquakes in relation to their magnitude (Figure 23).
Figure 23:
Model of seismic activity in the Democratic Republic of Congo
Because these curves appear to have the same tendency (negative
slopes and almost parallel), there is reason to believe that there is a linear
relationship between soil structure and seismic activity.
3.2.2.4.4.
Distribution of seismic energy and number of earthquakes by sub-area
The curvebelow depicts how earthquakes and
energy are distributed in each sub-area.
Figure 24:
Distribution of seismic energy and number of earthquakes by sub-area.
It is worth noting (Figure 24) the following:
-As a function of Ai and Bi, the number of earthquakes
increases at A3 and B3, respectively.
-According to Ai and Bi, the energy released is greater
in A1 and B3, respectively.
-According to Ai and Bi, the number of earthquakes is
lower at A5 and B1, respectively.
-As a function of Ai and Bi, the released energy is
lower at (A2, A3, and A4) and B2, respectively.
-No link has been found between maximum (minimum)
energy and the number of earthquakes.
The curve below depicts the distribution of earthquake
density and energy in each sub-area.
Figure 25:
Distribution of seismic energy density and earthquakes by sub-area
The above figure shows the following:
-As a function of Ai and Bi, the volume density of the
number of earthquakes is higher at A2 and B2 respectively,
-As a function of Ai and Bi, the volume density of
energy released is higher at A1 and B3 respectively,
-As a function of Ai and Bi, the volume density of the
number of earthquakes is lower at A5 and B1 respectively,
-As a function of Ai and Bi, the volume density of the
released energy is lower at A2 and B2 respectively,
-With a few exceptions, there is a correlation between
the minimum energy density and the maximum density of earthquakes at the same
location, and vice versa. This is consistent with the assumptions made,
-The assumptions made at the start have been validated
at sub-areas A2 and B2, the most likely location of the crater.
It is concluded that the characterization of
seismicity should be described in terms of volume density rather than number of
earthquakes or energy. Thus, the concept of volume density is crucial in this
study and in the field of characterization in general.
Figure 26: Distribution of energy, number of
earthquakes and d-value by sub-zone
NB: the value of the
d-value has been multiplied by 2000
Once again, a good
correlation is observed between the curve of the number of earthquakes and the
d-value (which characterizes the structure of the ground). We conclude and confirm
that the seismic activity depends on the structure of the ground.
3.2.3. Division of the studied area into grid-areas (Cij) and calculation of the degree of heterogeneity.
The concept of
grid-areas is related to that of the vector representation (Mukange,
2016)
Indeed, the grid-area Cij is an intersection between the sub-areas Ai and Bj.
Thus Cij is described as follows:
i takes the
seismic level values (ai) of the vertical sub-areas
(Ai) ;
j takes the
seismic level values (bj) of the horizontal sub-areas
(Bj).
The relation(12)
allows us to calculate the modulus of the sub-areasCij. To
each modulus, in accordance with the code of table (9), we associate a color to
each module (Table 10).
Table 9: Color code for the module slice
MODULE
Level
Colours
1
Pink
2
Light blue
3
Purple
4
Green
5
Yellow
6
Orange
7
Light red
Table 10:
Assignment of the color to the module of each zone-grid cij
GRID-AREACij
b
a
MODULE
SEISMIC
LEVEL
COLOR
CODE
C11
6
7
9
5
Yellow
C12
6
4
7
4
Green
C13
6
4
7
4
Green
C14
6
1
6
3
Purple
C15
6
1
6
3
Purple
C21
4
7
8
4
Green
C22
4
4
6
3
Purple
C23
4
4
6
3
Purple
C24
4
1
4
2
Light blue
C25
4
1
4
2
Light blue
C31
7
7
10
5
Yellow
C32
7
4
8
4
Green
C33
7
4
8
4
Green
C34
7
1
7
4
Green
C35
7
1
7
4
Green
The results of the above table, particularly the use of
the color code, leads to the characterization of the grid-zones in the form of
seismic zoning (Figure 27), thus highlighting four groups (Table 11):
Table 11:
Statistics on the colors (module)
N°
COLOUR
AREA-GRIDS
CONTRIBUTION(%)
1
PURPLE
C14,C15,C22,C23
4/15
(27%)
2
BLUE
C24,C25
2/15
(13,3%)
3
GREEN
C12,C13,C21,C32,C33,C34,C35
7/15
(47%)
4
YELLOW
C11,C31
2/15
(13,3%)
The results of this table are converted into curves
(Figure 27).
Figure 27:
Distribution of colors (module) in the Nyamulagira
grid zones
Based on this grouping, we estimate the degree of
homogeneity to be 27% (4 groups out of 15 Cij), or a
degree of heterogeneity of 73%.
Figure 28:
Characterization of seismic activity by means ofthe zoning map
The results of the table are transformed into curves
(Figure 29) and indicate the following:
- Seismic activity decreases from the West (A1) to the
East (A5),
- The B1 sub-area is the transition areabetween B2 (low activity) and B3 (high
seismic activity).
Figure 29:
Characterization of seismicity using curves: structure
The diagram above reveals some intriguing anomalies:
-From West (A1) to East, the modulus decreases (A5),
-It decreasesfrom North (B1) to South (B3),
-The shift at A4 and A5 between curves B2 and B3 is
twice as large as the shift between B1 and B2; it appears that the crater is
unlikely to be located at A4 or A5.
-A4 and A5 are more likely to be the site of tectonic
or volcano-tectonic earthquakes than volcanic earthquakes.
Based on an analysis of the parameters that prevailed
in the design of the characterization scale (including the introduction of the
parameter "volume density") and seismo-volcanic
activity concepts, there is a high probability that the crater is located near
(A1, A2, A3) and (B1).Finally, the
degree of heterogeneity is calculated as follows:
For the horizontal sub-areas (Bj),
we calculate the ratio between the number of different colors recorded to the
total number of Cij (five in total for each Bj), converted into percentage. For the vertical sub-areas
(Ai), we calculate the ratio between the number of different colors registered
to the total number of Cij (three in total for each
Ai), converted in percentage,
Table 12:
Degree of heterogeneity for each sub-area
Sub-areas
Degree of heterogenéity
Degree ofheterogeneity in %
B1
3/5
60
%
B2
3/5
60
%
B3
2/5
40
%
A1
2/3
67
%
A2
2/3
67
%
A3
2/3
67
%
A4
3/3
100
%
A5
3/3
100
%
Average
561/800
=70%
Once zero, the
degree of heterogeneity is now 70.
According to
the formula, the rate of heterogeneity é is 44% (4/9) when the number of
distinct colors (5) in the figure (28) is multiplied by the total number of
colors in the table (9)
According to
the formula number of distinct colors (4) in figure (28) on total number of
boxes (15) in figure (28), the rate of heterogeneity é is worth 27% (4/15). We
will stick with the first formula.
3.2.4. Comparison of the structural curves
Three
structural curves are presented below.
Figure 30: Geoseismic
signature of the DRC (10°E-35°E; 6°N-14°S).
Figure 31: Geoseismic signature of the Virunga
area (25°E-30°E; 1°N-4°S)
Figure 32: Geoseismic
signature of the Nyamulagira Volcano area
(29.0°E-29.5°E; 1.2°S-1.5°S).
Analysis of
these three structures reveals the following:
Moving from
west to East (Ai), the shape of the DRC (Figure 30) and the Virunga
area (Figure 31) is the same; they are the inverse of the Nyamulagira
(Figure 321). This difference is due to the fact that Nyamulagira
areais located in the front (29°E), a
less seismic zone, whereas the area of major fractures and intense seismic
activity is located between 30°E and 35°E.
The three
structures follow the same pattern from North to South (Bj):
Seismic activity decreases from North to South.
These findings
support previous research (Mukange, 2016), which
found that the DRC's seismicity is better described (diversified) in terms of
longitude (West to East) than latitude (North to South).
3.2.5. Crater location
Starting with the assumption that the crater is located where: - the
volume density of the number is abnormally high, - the volume density of the
seismic energy of tectonic or volcano-tectonic earthquakes is very low.
Based on these
assumptions, the other distinguishing features discussed above, and the results
in Figures (24-25), the crater is located at C22 (B2, A2) [29.15°E; 1.35° S],
as indicated by the black bubble in Figure (28). These findings are consistent
with the observations made in the field (Figure 5). This confirms our stated
hypotheses, which must generalize and be confirmed further through additional
research.
4. GENERAL CONCLUSION AND PERSPECTIVES
The design of
a characterization scale enabled the study of volcano-seismic activity in the
vicinity ofNyamulagira volcano in the DRC's Virunga
area, the western branch of the East African Rifts, as well as the search for
techniques for locating its crater on the basis of seismic data. This scale,,, very simplified because it contained only three
parameters, introducing the structure constant known as the d-value and the
concept of the volume density of energy or number of earthquakes provided the
following results:
This
previously homogeneous area has been subdivided into sub-areas and is no longer
homogeneous: It has a degree of heterogeneity of 60 and 100%, or an average of
80%, when studied vertically and horizontally.
The area's
final degree of heterogeneity is 70%, corresponding to a
homogeneity of 30%. Thus, the notion of structure homogeneity is
dependent on the scale used to observe it.
The seismic
species identified in this area are Iab, Ibc, IIIbb, and IIIbc, with structural factors (ab,
bb, and bc) identified.
Analysis of
these three structures in the Democratic Republic ofCongo (10°E-35°E; 6°N-14°S), the Virunga area (25°E-30°E; 1°N-4°S°), and the area around Nyiragongo volcano (29.00°E-29.50°E; 1.45°S-1.75°S) reveals
the following:
Going from
West to East (Ai), the shape of the structures for the Democratic Republic of CongoandVirunga is the same; they are the inverse of Nyamulagira. Nyiragongo areais located in the front (29°E), which is a
less seismic zone, whereas the areaof
major fractures and intense seismic activity is located between 30°E and 35°E.
Around 28°E,Virunga and Nyiragongo
structures have the same shape.
From North to
South (Bj), the three structures follow the same
pattern: seismic activity decreases from North to South.
These findings
support previous research (Mukange thesis), which
found that the seismicity of the Democratic Republic ofCongois better described (diversified) in terms of longitude (West to East)
than in terms of latitude (North to South);
-The ground structure around the volcano from north to
south (horizontal subdivision) is similar to that studied in the Virungaareaat a depthranging from 25 to 105 km.
-The ground structure studied from west to east
(vertical subdivision, Ai) is similar to that studied in terms of seismic
activity in the Virungaareaata depthranging from 25 to 105 km
(Figure 19). These two parabolic curves are the inverse of the one that
describes the seismic structure studied in the volcano's vicinity from north to
south (Bj).
-We find a strong relationship between the number of
earthquakes and the d-value curve (characterizes the structure of the ground).
We conclude and confirm that seismic activity is determined by the ground
structure.
-There is a relationship between low energy and the
number of earthquakes, with some exceptions.
REFERENCES
1.Bantidi M., Wafula M., Mavambou, Mukange B., ZanaNd.,
(2014a). Probabilistic assessment of seismic hazard in Lake Tanganyika Rift
accounting for local geologies conditions. 2015. International Journal of Geology, Agriculture and Environmental
Sciences. Vol.03 Issue 02 (April 2015), pp24-29.
2.Bantidi
M., Mukange B., et Zana N.,
(2014b). Structure de la sismicité de la Branche occidentale des Rifts Valleys du système des Rifts Est-africains ; de 1954 à
2010, International Journal of Innovation
and AppliedStudies,
ISSN 2028-9324 Vol. 9 No. 4 Dec. 2014, pp.1562-1581.
3.Borden J-P., (1988). Biologie-Géologie. Première S. Paris: Bordas
4.Lay T., Wallace T., (1995). Modern Global seismology. New-York : Academic Press
5.MavongaTuluka G., (2009).Seismic
hazard assessment and volcanogenic seismicity for the Democratic Republic of
Congo and surrounding areas, western Rift valley of Africa. Thèse de Doctorat: University of
the Witwatersrand (Johannesburg), Faculty of Sciences.
6.Mukange B., Bantidi M., ZanaNd.,
(2013). Structure de la sismicité de la Branche orientale des
Rifts Valleys du système des Rifts
Est-africains ; de 1954 à 2010.
Revue Congolaise des Sciences Nucléaires. vol.27, pp 151-169.
7.Mukange B., Bantidi M., Zana L., Wafula M., ZanaNd.,
(2015). The isoseismal map and their implication to
underlining ground degree of heterogeneity (Kabalo
quake’s case, September 11, 1992, magnitude 6.7, Upemba
Rift). Greener Journal of Geology and
Earth Sciences, vol. 3 (2), pp 030-042.
8.Mukange B., (2016). Conception d’un modèle physique pour la caractérisationet la surveillance de l’activité sismique et
son implication géologique(Cas
de la République Démocratique du Congo). Thèse
de Doctorat : Université de Kinshasa,Faculté des Sciences. Département de Physique.
9.Mukange B.,
(2021a). Design of a unified scale for the characterization of seismic
activity. International Journal of Innovative Science and Research Technology,
Volume 6, Issue 7 , July– 2021, pp.1407-1422.
www.ijisrt.com
10.Mukange B.,
(2021b). Application of the unified scale to the characterization of seismic
activity of the Democratic Republic of Congo and its surroundings (comparative
study for Africa, Indonesia and the Pacific coast of Central America).
International Journal of Innovative Science and Research Technology, Volume 6,
Issue 7, July– 2021, pp.1516-1555.
11.Mukange
B., (2023a). Characterization of the volcano-seismic activity aroundNyiragongo volcano
and location of its crater by means of unified scale. Greener Journal of Geology and Earth
Sciences, 5(1) December
2023: 28-51. http//gjournals.org/GJGES.
12.Mukange
B., (2023c). Highlighting the fine structure of the seismic zones of the
western branch of the east african
rift system using the unified characterization scale and its geological
implication. Greener Journal of Geology and Earth
Sciences, 5(1) December
2023: 76-108. http//gjournals.org/GJGES.
13.Ongendangenda A., (2020). Volcanologie de la chaîne des Virunga. Paris: L’Harmattan.
14.Wafula M., D. Atiamutu et
M. Ciraba, (1999). Activité séismique dans les
Virunga (Rép.Dém. Congo) liée aux éruptions du Nyiragongo
et Nyamuragira, deNovembre
1994 à Décembre 1996. Mus. roy. Afr. centr. Tervuren Belg., Dépt.Géol. Min. Rapp. Ann.
1997 & 1998, pp. 309 - 319.
15.Wafula
M.D., Kasereka M., Rusangiza
K., Kuvuke K., Mukambilwa
K., Ciraba M. &Bagalwa
M., (2009). The Nyamulagira Volcanic Eruption on
November 27, 2006,Virunga Region, D.R. Congo. Cahiers
du CERUKI, Numéro Spécial CRSN-Lwiro(2009), pp. 108 - 115.
16.Wafula
M.D, Zana A. Kasereka M.
and Hamaguchi H., (2011a). The Nyiragongo
volcano: A case study for the Mitigation of Hazards on an African Rift Volcano,
Virungaregion, Western African Rift Valley, 32 pp.
18.Wafula M., (2011b). Etude
Géophysiquede l’Activité Volcano-Séismique dela Régiondes Virunga, Branche
Occidentale du Système des Rifts Est-Africains et son Implication dans la
Prédiction des Eruptions Volcaniques. Thèse de Doctorat : Université de
Kinshasa,Faculté des Sciences.
19.Zana
N, (1977). The Seismicity of the Western
Rift Valley of Africa and related problems. Doctorat Theses, Tôhoku
University. 189 pp.
20.Zana
N. and K. Tanaka, (1981). Focal mechanism of major earthquakes in the WesternRift Valley of Africa,TôhokuGeophys. Journ. (Sci. Rep. TôhokuUniv.
Ser. 5), Vol.28, Nos 3-4, pp: 119
- 129.
Cite this Article: Mukange, BA; Kuzituka,
T; Zana, NA; Tondozi, KF
(2023). Characterization of the Volcano-SeismicActivityaroundNyamulagiraVolcano and the
Location of itsCrater by
Means of UnifiedScale.Greener Journal of Geology
and Earth Sciences, 5(1): 52-75.