By Belay,
F (2024).
|
Greener Journal of Plant breeding and Crop
Science ISSN: 2354-2292 Vol. 12(1), pp. 13-20, 2024 Copyright ©2024, Creative Commons
Attribution 4.0 International |
|
Click on Play button...
GGE biplot analysis for grain yield stability of drought tolerant
sorghum (Sorghum bicolor L.)
genotypes in dry lowlands of Ethiopia
Fantaye Belay
Alamata
Agricultural Research Center, P.O.Box 56, Alamata, Ethiopia.
|
ARTICLE INFO |
ABSTRACT |
|
Article No.: 091424113 Type: Research |
Sorghum known as a Camel crop of cereals, is a
versatile and resilient cereal grain that has been cultivated for millennia.
Six drought tolerant sorghum genotypes were evaluated with the objectives to
identify stable and high yielding ones across six locations in the dry
lowland environments of Ethiopia during the 2016 main cropping season. The
field experiment was conducted using a randomized complete block design with
three replications at each location. Agronomic and striga
counts data were collected but only grain yield was used for stability
analysis. The combined analysis of variance revealed highly significant
(P≤0.01) difference among genotypes (G) environments (E) and genotype ×
environment interaction (GEI). Genotypic mean grain yield ranged from 1730 to
3650 kg ha-1 with average mean grain yield of 2421 kg ha-1,
while environment ranged from 1670 to 3422 kg ha-1. GGE bi-plot
model was used to identify stable genotype for partitioning the GEI into the
causes of variation and the best multivariate model in this study. The first two principal components were
used to create a 2- dimensional GGE bi-plot analysis explained 97.83% of the
total variation caused by G+GE of PC1 and PC2 accounted for 93.26% and 4.57%
sum of squares, respectively, while 2.17% was attributed to noise. Thus,
model diagnosis (fitting) showed that the first two PCs were significant and
can be taken to interpret this data. The which-won-where bi-plot further
identified one winning genotype in one mega environment. The winning genotype
across locations was Melkam. Therefore, Melkam can be recommended for wider
cultivation due to better grain yield and stability performance across
testing locations in the dry lowland areas of Ethiopia. |
|
Accepted: 14/09/2024 Published: 17/09/2024 |
|
|
*Corresponding Author Fantaye
Belay E-mail: fantaye933@gmail.com |
|
|
Keywords: Drought tolerant, GEI, GGE biplot, Mega
environment, Stability. |
|
|
|
|
INTRODUCTION
Sorghum [Sorghum bicolor (L.) Moench] known as a Camel crop of cereals, is a versatile and resilient cereal grain that
has been cultivated for millennia. Originating from Africa, it has spread
across the globe due to its adaptability to diverse climates and its numerous
uses ranging from food and feed to industrial applications. Sorghum is a staple
crop for more than 500 million people in 30 sub-Saharan African and Asian
countries and is essential to the food security of over 300 million people
in Africa (Mace et al., 2013). Ethiopia is considered as a center of origin and
diversity for the four (bicolor, guinea, caudatum and durra except kafir) of
the five major races and the second largest sorghum producing country in
eastern Africa next to Sudan. Of the cereals, sorghum covers 15% of the total
area and contributed 16% of the total grain production in the country. Sorghum
ranks 4th in Ethiopia in terms of total production (45.2 million quintal), area
cultivated (1.7 million hectare), and number of farmers (4.3 million) producing the commodity (CSA, 2020).
There are
numerous varieties of sorghum cultivated globally, each adapted to different
environmental conditions and intended uses. These varieties can be broadly
categorized into grain sorghum, sweet sorghum and forage sorghum. It is utilized in various ways. Sorghum flour (fermented or unfermented) is used for human food such as breads,
porridges, couscous, and snacks and beverages. The grain and fresh or dry
biomass has diverse use and good source for sugar, syrup, and molasses industry
(McGuire, 2007). It is
also the second most important crop for “injera” quality next to tef in
Ethiopia. In addition, sorghum stalks and leaves are an important
source of dry season feed for livestock, source of energy for cooking their
daily foods, for
construction of houses and fences, and as fuel wood (MoANR, 2016). However, a number of constraints have been standing on
the way towards sorghum production.
Drought and striga are reported to be
the most important abiotic and biotic constraints limiting the production and productivity of sorghum in the north and northeastern
parts of Ethiopia (Wortmann et al.,
2006). Over 80% of sorghum in Ethiopia is produced
under severe to moderate drought stress conditions. Most farmers grow long
maturing local landraces, some of which take 7-8 months to mature further
complicating the drought problem. Striga,
a parasitic weed, is the most severe in the highly degraded north,
northwestern and eastern parts of the country, viz. Tigray, Wollo,
Gonder, Gojam, North Shewa, and Hararghe (AATF, 2011). In spite of biotic and
abiotic stress tolerant, yield stability is also one of the setbacks to select
and recommend genotypes for different environments. Therefore, the objectives of this study were to identify
stable sorghum genotypes and/or assess their performance across locations in
dry lowland areas of Ethiopia.
MATERIALS AND
METHODS
Description of
the study areas
Field experiments
were conducted in the 2016 main cropping season at six locations representing the
major sorghum growing dry lowland agro-ecologies in Ethiopia, namely Fedis,
Kobo, Mehoni, Abergelle, Sheraro and Humera. The agro-ecology of the locations
are described as semi-arid belt of the eastern lowlands of Hararghe (Fedis), sub-moist hot warm lowlands (Kobo, Mehoni, Abergelle and Sheraro) and hot to warm semiarid plain
(Humera) sub agro-ecology (SA1-1) (EIAR, 2011) with a variation in elevation.
Table 1. Description of the study sites
|
Location |
Altitude |
Geographic
position |
Rain Fall |
Temperature
(şC) |
Soil type |
Location code |
||
|
Latitude |
Longitude |
(mm) |
Min |
Max |
||||
|
Humera |
609 |
14°
06’N |
39°
38’E |
576.4 |
27.0 |
42.0 |
Vertisol |
E1 |
|
Abergelle |
1560 |
13°
14’N |
39°
59’E |
570 |
18.0 |
32.0 |
Sandyclay |
E2 |
|
Kobo |
1468 |
12°
09’N |
39°
39’E |
673.4 |
22.0 |
31.0 |
Vertisol |
E3 |
|
Fedis |
1600 |
9°
07’N |
42°
04’E |
724.5 |
11 |
28.4 |
Alfisols |
E4 |
|
Mehoni |
1578 |
12°
41’N |
39°42’E
|
539.3 |
18.0 |
32.0 |
Vertisol |
E5 |
|
Sheraro |
1028 |
14°
24’ N |
37°
45’E |
700 |
19.3 |
38.5 |
Vertisol |
E6 |
Source:
respective research centers, 2016
Experimental
materials
Six
stress tolerant sorghum genotypes; two early maturing and drought
tolerant varieties (Meko-1 and Melkam); three striga resistant and drought
tolerant varieties,
Gobye (P9401), Abshir (P9403) and Birhan and one
local check, obtained from Melkassa Agricultural Research Center in
Ethiopia were used and /or evaluated as presented in Table 2.
Table 2: Description of genotypes used in the study
|
Variety |
Pedigree |
Year
of release |
Maintainer |
Main characteristics/ Adaptation |
|
Birhan |
PSL85061 |
2002 |
MARC |
Early maturing, drought and heat resistance
varieties. Additional attribute is their resistance to the parasitic weed
striga. |
|
Gobye |
P9401 |
2000 |
MARC |
|
|
Abshir |
P9403 |
2000 |
MARC |
|
|
Melkam |
WSV387 |
2009 |
MARC |
Early maturing, drought and heat resistance
varieties |
|
Meko-1 |
M-36121 |
1997 |
MARC |
|
|
Local |
Check cultivar |
- |
- |
Late
maturing and susceptible check cultivar |
MARC = Melkassa Agricultural Research Center in Ethiopia.
Experimental
Design and Trial Management
The field
experiment was carried out in a randomized complete block design (RCBD) with
three replications across locations. Each plot
was consist of 5 rows of 5m length with inter and intra row spacing of 0.75m and 0.20 m,
respectively. The three middle rows were harvested and two border rows
were left to exclude border effect. The gross area of the
experimental plot
and the harvestable area had a size of 18.75
m2 (3.75 m x 5 m) and 11.25m2 (2.25 m x 5 m),
respectively. All plots were fertilized
uniformly with 100 kg ha-1 Di-ammonium Phosphate (DAP) and 50kg ha-1 Urea. Full
dose of P (18 % N and 46 % P2O5) and half of N (46 % N) were
applied at the time of planting and the remaining half was side dressed at knee height stage of the crop.
Weeding and other agronomic practices were done uniformly and properly as per
the recommendations for sorghum in dry lowland areas of Ethiopia.
Data
Collection
Grain yield
was determined as the total weight of clean grains from the central three rows
(harvestable net plot size of 11.25m2), leaving a border rows from
both sides of the plot and measured with sensitive balance, adjusted at 12.5%
seed moisture content and the obtained
grain yield per plot in grams was converted to kg ha-1 for analysis.
Data Analysis
Homogeneity of
residual variances was tested prior to a combined analysis using Bartlett’s
test (Steel and Torrie, 1998). Analysis of variance for each location, combined
analysis of variance over locations and GGE biplot analysis was computed using
Genstat 16th edition (Payne, 2014) software following a procedure
appropriate to RCBD (Gomez and Gomez., 1984). Mean separation was done using
Fisher’s least significant difference (LSD) test at 5% probability level.
RESULTS AND DISCUSSION
Combined ANOVA and Mean Performance of Genotypes across
Locations for Grain Yield
The combined
analysis of variance of six drought tolerant sorghum genotypes over six
locations for grain yield (kg ha-1) is presented in Table 4. The
result revealed that genotypes, locations, and their interaction (GEI) had a
highly significant difference (p<0.01), indicating that the performances of
genotypes varied across different locations. The environments (locations) in
the study were assumed as random effects and the genotype effects were treated
as fixed. The genotype (G) explained 53.93% to the treatment (total variation)
sum squares for grain yield, while location (E) and genotype by environment
interaction contributed 38.13% and 7.42% respectively, suggesting that the
environmental conditions were relatively consistent across locations while the
contribution of GEI to the total variation showed minimal role.
Based on mean performance of genotypes over locations
result the highest yield was obtained from Melkam (3650 kg ha-1),
while the lowest was from Local (1730 kg ha-1) and the average grain
yield was 2421 kg ha-1. The variation in grain yield was attributed
to factors such as genotypic variation, soil fertility, rainfall patterns, temperature,
and moisture availability across different environments. In agreement with this
finding, several studies (Gebeyehu et al., 2019; Yitayeh
et al., 2019; Alemu
et al., 2020; Amare et al., 2020; Belay et al., 2020; Belete et al., 2020; Worede et al., 2020; Birhanu et al., 2021; Enyew
et al., 2021; Habte
et al., 2021; Teressa
et al., 2021; Nesrya
et al., 2024) have been conducted to
scrutinize genotype by environment interaction and reported significant
variation for grain yield on sorghum in Ethiopia.
Table 3. Mean grain yield (kg ha-1)
of six sorghum genotypes tested across six locations
|
Variety (Gen.) |
Environments
(Loc.) |
GM |
|||||
|
Humera |
Abergelle |
Kobo |
Fedis |
Mehoni |
Sheraro |
||
|
Abshir |
1300cd |
1708c |
2000cd |
2255c |
2509c |
3600b |
2230c |
|
Birhan |
1429c |
1700c |
2110c |
2152d |
1707f |
2700d |
1966d |
|
Gobiye |
1290cd |
1689c |
1970cd |
1977e |
2077d |
3100c |
2018d |
|
Local |
1100d |
1367d |
1950d |
1567f |
1867e |
2533e |
1730e |
|
Melkam |
2700a |
3100a |
3600a |
3200a |
4300a |
5000a |
3650a |
|
Meko-1 |
2200b |
2300b |
3300b |
2400b |
3800b |
3600b |
2932b |
|
EM |
1670 |
1977 |
2488 |
2258 |
2710 |
3422 |
2421 |
|
LSD (5%) |
220.4 |
147 |
143 |
101.7 |
140.7 |
123.8 |
132.8 |
|
CV (%) |
6.6 |
4.1 |
3.2 |
2.5 |
2.9 |
2.0 |
3.4 |
Where:
GM= genotypic means, EM= environment means; LSD = least significance
difference, CV (%) = coefficient of variation in percent and values with the
same letters in a column are not significantly different at P≤ 0.05.
Table 4. Combined analysis of variance
for six sorghum genotypes (G)
across six locations (E)
|
Source of variation |
DF |
SS |
MS |
% SS explained |
|
Reps. within Env. |
12 |
6032 |
3016 |
|
|
Genotype (G) |
5 |
47818986 |
9563797** |
53.93 |
|
Environment (E) |
5 |
33805294 |
6761059** |
38.13 |
|
GxE
Interaction |
25 |
6571853 |
262874** |
7.42 |
|
Pooled error |
60 |
465680 |
6653 |
|
**= significant at P≤
0.01, DF = degree of freedom, SS = sum of squares, MS = mean squares
GGE
Biplot Analysis
In the GGE
model, genotype (G) main effect plus genotype by environment interaction (GEI),
are the two sources of variation of GGE biplot whereas in the AMMI model only
the GEI term is absorbed. In GGE biplot, the best genotype is the one with large
PC1 scores (high mean yield) and near zero PC2 scores (stable). The
partitioning of GEI through GGE biplot analysis in this study displayed that
PC1 and PC2 accounted for 93.26% and 4.57% of sum of squares, respectively,
with a total of 97.83% of GGE variation for grain yield.
'Which-Won-Where' Pattern and Mega-environment
Identification
The
'which-won-where' pattern as graphically described in Figure 1 revealed that
the testing environments (Fedis, Kobo, Mehoni, Abergelle, Sheraro and Humera) fall into the same mega environment
with winning genotype Melkam. This pattern suggested that Melkam was vertex genotype for sector that gave the highest yield for the
environments i.e. broadly
adapted. As a result the genotype would be selected for proper exploitation of
resources across the tested dry lowland environments of Ethiopia. On the contrary, the genotypes Meko-1, Gobye,
Abshir, Birhan and local fall in sectors where there were no locations
at all; these genotypes are poorly adapted to the testing environments. In
agreement with this finding Yitayeh et al. (2019); Alemu
et al. (2020); Belay et al.
(2020); Belete et al. (2020); Worede
et al. (2020); Birhanu
et al. (2021); Enyew
et al. (2021), and Nesrya et al. (2024) are among the many authors who used GGE bi-plot to
identify mega environments, to evaluate the genotypes and to test the
environments in Ethiopian sorghum cultivars.

Figure 1. Polygon view of GGE biplot
graph for which-won-where pattern of six sorghum genotypes across six environments.
Ranking of
Genotypes Based on Mean Grain Yield and Stability Performance
Figure 2 shows
ranking of genotypes based on their mean yield and stability performance by AEC
(average environment coordination) line which passes through the average
environment (represented by small circle) and bi-plot origin. Genotypes on
the right side most of this line have high yield performance (above average mean
yield). Hence, Melkam and Meko-1 gave above average mean yield across locations
while Gobye,
Abshir, Birhan and local scored below average mean yield (left side
to AEC). The stability of the genotype is determined by their projection on to
the middle horizontal line. The greater the absolute length of the projection
of a genotype, the less stable it is. According to the bi-plot (Fig. 2) Melkam
has the shortest vector from the ATC abscissa with high yield and most stable
genotype, suggesting it’s adaptation to a wide range of environment.
Meko-1 was longer projection from average line and
indicating highest yielding but less stable genotype while, Gobye, Abshir, Birhan and local were the lowest yielding and least stable genotypes
across locations in the present study having large contribution to the genotype
by environment interaction in agreement with the findings of Yitayeh et al. (2019);
Alemu et al.
(2020); Belay et
al. (2020); Belete et al. (2020);
Worede et al.
(2020); Birhanu et
al. (2021); Enyew et al. (2021), and Nesrya
et al. (2024) reported high yielder
and stable genotypes as well as low yielding and poorly stable one’s in
sorghum.

Figure 2. The mean performance and
stability view of the GGE biplot with scaling focused on genotypes across
environments.
Evaluation of
Varieties Based on the Ideal Genotype
The ideal
genotype is located in the first concentric circle in the biplot
as indicated in Figure 3. An ideal genotype should have both high mean yield
performance and stable across locations. From this study, Melkam was the
“ideal” genotype with the highest mean grain yield and stable across locations.
Starting from the middle concentric circle pointed with arrow was drawn to help
visualize the distance between genotypes and the ideal genotype (Yan and Tinker
2006). Genotypes closer to the ideal genotype were the stable ones, while
genotypes far from the ideal genotypes were the unstable. Meko-1 was plotted
close to the ideal genotype considered as desirable genotype, while Gobye, Abshir, Birhan and local were low yielding genotypes associated with genotypic
instability (Figure 3). Therefore, desirable genotypes are those nearest to the
ideal genotype (the center of concentric circle). Similar result was reported
by many researchers (Gebeyehu et
al., 2019; Yitayeh et al., 2019; Alemu et al., 2020; Amare et al.,
2020; Belay et al., 2020; Belete et al.,
2020; Worede et
al., 2020; Birhanu et al., 2021; Enyew et al., 2021; Habte et al., 2021; Teressa et al., 2021; Nesrya
et al., 2024) on sorghum in Ethiopia.

Figure 3. GGE-biplot showing the
“ideal” genotype.
CONCLUSION
The combined
analysis of variance result revealed that sorghum genotypes evaluated in the
study were highly significantly (p<0.01) influenced by genotype, environment
and genotype x environment interaction (GEI). The total sum of squares
explained by the genotype was 53.93% followed by environment 38.13%, while the genotype x environment interaction explained least 7.42%. Based on combined analysis of variance over locations,
the mean grain yield of environments ranged from 1670 to 3422 kg ha-1.
The highest yield was obtained from Melkam (3650 kg
ha-1), while the least was from Local (1730 kg ha-1) and
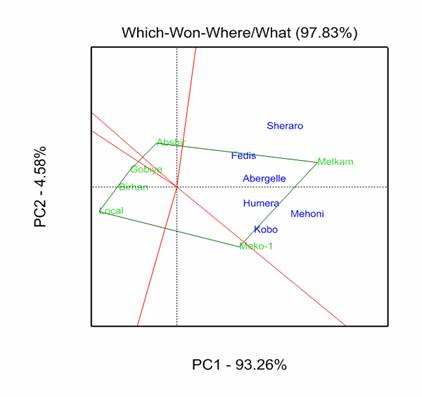
the average grain yield of genotypes were 2421 kg ha-1. GGE model was employed in
determining the most stable and high yielding sorghum genotypes in this study.
The first two principal components for grain yield stability of the GGE biplot
analysis explained 97.83% of the total variation caused by G+GE of PC1 and PC2
accounted for 93.26%
and 4.57% sum of
squares, respectively, while 2.17% was attributed
to noise. The which-won-where biplot identified one
winning genotype in one mega environment. Melkam was the winning genotype and considered as
the most desirable and stable ones, therefore can be recommended for wider
cultivation due to better grain yield and stability performance across the
testing environments in the dry lowland areas of Ethiopia.
Conflict of Interest
The
author has not declared any conflict of interest.
Acknowledgements
The
author thank to the national sorghum improvement program of Ethiopia for financing and providing
working facility.
REFERENCES
AATF [African
Agricultural Technology Foundation]. 2011. Feasibility Study on Striga Control
in Sorghum. Nirobi, African Agricultural Technology Foundation. ISBN
9966-775-12-9.Asfaw Adugna. 2007. Assessment of yield stability in sorghum.
African Crop Science Journal, 15 (2): 83-92.
Alemu, B., Negash, G., Raga, W. and Abera,
D. Multi-locations evaluation of sorghum [Sorghum bicolor (L.) Moench] genotypes for grain yield and yield related traits
at western Oromia, Ethiopia,” Journal of Cereals and
Oilseeds. 2020, 11(2), pp.44-51.
Amare, S., Amare, N., Kedanemaryam, W., Taye, T., Diriba,
T., Alemu, T., Habte, N., Adane, G., Sewmehone, S., Tsegaye, G., Chalachew, E.,
Hailemariam, S., Tamirat, B., Tokuma, L., David, J., Emma, M., Daniel, N.,
Ligaba, A. and Meron, B. 2020. Multi Environment and Spatial Analysis of Early
Maturing Sorghum [Sorghum bicolor (L.) Moench] Genotypes in Dry Lowland Areas
of Ethiopia. African Journal of Agricultural Research, 15(2), pp. 278-290.
Belay, F., Mekbib, F.
and Tadesse, T., 2020. Genotype by environment interaction and grain yield
stability of Striga resistant sorghum [Sorghum bicolor (L.) Moench] genotypes
in Ethiopia. Ethiopian Journal of Crop Science, 8(2): 79-99.
Belete, T.
and Bediru, N. Yielding and stability appraisal of
released varieties of sorghum [Sorghum bicolor (L.) Moench.].
Journal of Agricultural Research Advances. 2020. 2 (4), pp
31-35/31.
Birhanu, C., Bedada, G., Dessalegn,
K., Lule, D., Chemeda, G., Debela, M. and Gerema, G.
Genotype by environment interaction and grain yield stability analysis for
Ethiopian sorghum [Sorghum bicolor (L.) Moench]
genotypes. Int. J. Plant Breeding and Crop Sci. 2021, 8, pp.975-986.
CSA (Central Statistics
Agency). 2020. Report on Area and Production of Major Crops (Private Peasant
Holdings, Meher Season): Agricultural Sample Survey. Central Statistical
Agency, Addis Ababa, Ethiopia.
Enyew, M., Feyissa, T., Geleta, M., Tesfaye, K., Hammenhag, C. and Carlsson, A.S. Genotype by environment interaction,
correlation, AMMI, GGE biplot and cluster analysis
for grain yield and other agronomic traits in sorghum [Sorghum bicolor L. Moench],” Plos one. 2021, 16(10),
p.e0258211.
Gebeyehu Chala, Bulti Tesso, Dagnachew Lule and
Kebede Dessalegn. 2019 Additive Main Effect and Multiplicative Interactions
(AMMI) and Regression Analysis in Sorghum [Sorghum bicolor (L). Moench]
Varieties. Journal of Applied Biosciences, 136: 13877-
13886.
Gomez,
K.A. and Gomez, A.A. Statistical Procedures for Agricultural Research. 2nd
Edition John Wiley and Sons Inc. 1984, New York.
Habte, N., Girma, G., Mekonen, M., Tirfessa, A., Seyoum,
A., Bejiga, T., Birhanu, C., Dessalegn, K., Senbetay, T., Ayana, G., Tesso, T.,
Ejeta, G., Mengiste, T. 2021. Genome-wide association analysis reveals seed
protein loci as determinants of variations in grain mold resistance in sorghum.
TheorAppl Genet. 134(4): pp. 1167-1184
Mace ES, Tai S, Gilding
EK, Li Y, Prentis PJ, Bian L, Campbell BC, Hu W, Innes DJ, Han X. 2013.
Whole-genome sequencing reveals untapped genetic potential in Africa’s
indigenous cereal crop sorghum. Nat Commun. 4(1): 2320
McGuire, S. J. 2007. Vulnerability in farmer seed
Systems: Farmer practices for coping with seed insecurity for sorghum in
Eastern Ethiopia. Economic Botany 61(3), pp. 211-222.
MoANR (Ministry of Agriculture and Natural
Resource). 2016. Plant and Animal Health Regulatory Directorate. Crop variety
register issue No. 20. Addis Ababa,
Ethiopia.
Nesrya Bedru, Temesgen
Matiwos, Techale Birhan, Tegegn Belete. 2024.
Performance Evaluation of Different Sorghum Genotypes (Sorghum bicolour (L.) Moench) Using GGE Bi-plot Stability Analysis.
International Journal of Genetics and
Genomics, 12(2): 19-30
Payne RW, Harding SA,
Murray DA, Soutar DM, Baird DB, Glaser AI, Welham SJ, Gilmour AR, Thompson R,
Webster R (2014). Introduction to GenStat for Windows 16th Edition. VSN
International, the Waterhouse, Waterhouse Street, Hemel Hempstead,
Hertfordshire HP1 1ES, UK.
Seyoum, A., Gebreyohannes, A., Nega, A., Nida, H., Tadesse, T., Tirfessa, A. and Bejiga, T.
Performance evaluation of Sorghum [Sorghum bicolor (L.) Moench]
genotypes for grain yield and yield related traits in drought prone areas of
Ethiopia. Advances in Crop Science and Technology. 2019, 7(2), p.423.
Steel RG, Torrie JH. 1980.
Principles and procedures of statistics. McGraw-Hill, New York.
Teressa, T., Bejiga, T., Semahegn, Z., Seyoum, A.,
Kinfe, H., Nega, A., Ayele, L., Nadew, D., Salah, M., Siraw, S. and Bekele, M.,
2021. Evaluation of advanced sorghum (Sorghum bicolor L. Moench) hybrid
genotypes for grain yield in mois ture stressed areas of Ethiopia. Journal of
agricultural science and food technology, 7(2), pp. 212-219.
Worede, F., Mamo, M., Assefa, S., Gebremariam, T. and Beze, Y.
Yield stability and adaptability of lowland sorghum [Sorghum bicolor (L.) Moench] in moisture-deficit areas of Northeast Ethiopia.
Cogent Food & Agriculture. 2020, 6(1), p.1736865.
Wortmann, C.S., Martha Mamo, Girma Abebe, Mburu, C., Kayuki, K.C., Elias Letayo and Xerinda, S. 2006. The
Atlas of Sorghum Production in Five Countries of Eastern Africa University of
Nebraska, Lincoln, USA.
Yan,
and Tinker, (2006). Biplot analysis of multi-environment trial data: Principles
and applications. Canadian Journal of Plant Science, 623-645.
Yitayeh, Z.S., Mindaye, T.T. and Bisetegn,
K.B. AMMI and GGE Analysis of GxE and Yield Stability
of Early Maturing Sorghum [Sorghum bicolor (L.)Moench]
Genotypes in Dry Lowland Areas of Ethiopia. Adv. in Crop Sci. T.2019.
|
Cite this Article: Belay, F (2024). GGE biplot analysis for grain yield stability of
drought tolerant sorghum (Sorghum
bicolor L.) genotypes in dry lowlands of Ethiopia. Greener Journal of Plant breeding and Crop Science, 12(1):
13-20. |