Surface tension is
the tendency of a liquid to resist surface penetration. The values of the
surface tension of Ethane-1, 2-diol, 2-Aminoethan-1-o1 and Ethane-1,
2-diamine were determined in this work by the capillary-liquid rise method in
aqueous solution as the solvent. The values of the surface excess
concentration were obtained by plotting the changes of surface tension with
concentrations of these surfactants. This work is meant to assess the film
coverage of these surfactants from the values of the surface concentration.
The values of the surface tensions of these surfactants showed the order
Ethane-1,3-diol (52,60,48, 70, 43, 10, 37.05 and 32.35 Nm-1) <
2-Aminoethan-1ol (59.50, 55.15, 52.60, 48.50 and 44.40 Nm-1) < Ethane -1,2
–diamine (66.40, 62.25, 59.91. 57.76 and 54.31 Nm-1). Thus, the positive
values of the surface excess concentration, Гi
(mole/m2) obtained from these changes in the values of surface tension, dγ with respect to changes in concentrations, dC (mole/m2) from the relation: Гi
(mole/m2) –(1/RT dy/dc) in water as a solvent
indicated that the values of dy/dcwere of negative valueswhich implied that (i)
these surfactants were miscible with water in all concentrations and (ii) the
molecules of the surfactants deposited substantially more on the air/water
interface than within the bulk solution. These interactions between the
surfactant in each case with air/water interface reduced drastically the
surface tension of water. Further elucidation of the results herein showed
that this occlusion of the air/solution interface by these surfactants
produced a considerable decrease in the surface tension with increase in
surface excess concentration in the order; Ethane -1, 2-diol (16.2 x 10⁻²)
> 2-Aminoethan-1-ol (12.33 x 10⁻²) > Ethane -1,2-diamine (8.28 x
10-2).The findings based on the
occlusion of the air/solution interface by the surfactants elicit interest
for their use as surface-active suppressants against the volatility of
perfumes in pyrogen-free water in perfume industry.
In this work, these amphiphilic surfactants have proven to be more effective
as suppressants than the previously used mono-alcohols.
Liquid
surfaces tend to contract inwards, manifesting either an invisible surface film
or as if an invisible membrane is covering the liquid surface [1,2]. This
surface film phenomenon is exhibited by all liquids in their natural forms.
This surface film or an invisible surface membrane resists surface penetration
into a liquid. In consequence, this surface film by its resistance to surface
penetration exhibits the flotation of most substances on liquid surfaces such
as hydrophobic dust, foils, pollen grain, etc. Thus, the manifestation of this
surface film formation by a liquid that resists surface penetration is termed
surface tension [3,4,17] with the symbol γ Nm-1 and is further elucidated here
under.
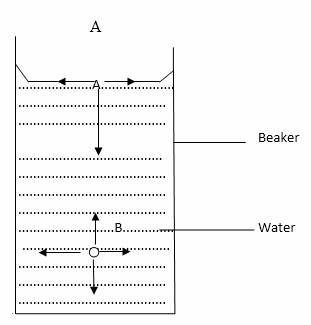
These forces that manifest as surface tension
on liquid surfaces resisting surface penetration may be explained by
considering a vessel (beaker) containing water as shown in Figure 1. By
considering a molecule of water at the position “B” with radial forces acting
and maintaining the molecule at a static equilibrium of the molecule at “B”,
the forces acting on the molecule “B” in the bulk are equal in all directions
and therefore maintaining a static equilibrium of the molecule at “B”. However,
let us consider the molecule in position “A” at the water/air interface. The
molecule at “A” requires an upward force to balance the force pulling it
inwards [11].
Therefore, the surface tension phenomenon of
inward pull of the molecules of a liquid, is responsible for the following: (i) the spherical shape of falling liquid droplets, such as
observed with rain water droplets (ii) spherical shape of mercury resting on a
flat surface (iii) rise of liquids in capillary tubes and (iv) flotation of
foils or powdery grains on liquid surfaces [10].
Figure 1: An assembly
illustrating the phenomenon of surface tension by the forces acting on the
molecules at the water surface “A” and within the bulk “B” in a beaker.
Surface
tension may be considered as the tendency of a liquid to reduce its surface to
a minimum surface energy in order to attain a stable surface equilibrium.
The surface tensions of liquid metals and
molten salts are large in comparison with those of organic liquids.
Surface
tension can be defined as the amount of energy required to expand the surface
of a liquid by unit area, and which can be measured in Joules per square metre or Newton per metre .The
assessment of surface tension of a liquid can be studied and evaluated by the
following techniques; (1) Principle of Liquid Rise in a Capillary (2) Principle
of Liquid Drop (3) Liquid Fall in a Capillary (4) Moving Boundary Film
Assessment. In this work, the principle of liquid rise is the method of
interest.
Principle of Liquid
Rise
The
principle of liquid rise can be achieved by using the Capillary Rise Method. The
Latin word “capilla” means “hair”. The capillary rise
phenomenon is not only the basis for an absolute and accurate means of
measuring surface tension, but also one of the reliable and easy assessment of
surface tension. The phenomenon accounts for the general tendency of wetting
the pores and fine cracks. The absorption of vapour
by porous solids to fill their capillary channels and the displacement of oil
by gas or water in petroleum formations are specific examples of capillary
effects. The water wetting of fabrics is a direct application of capillary
effects. Fabrics are porous materials, the spaces between them amounting to
small capillary pores [12,13].
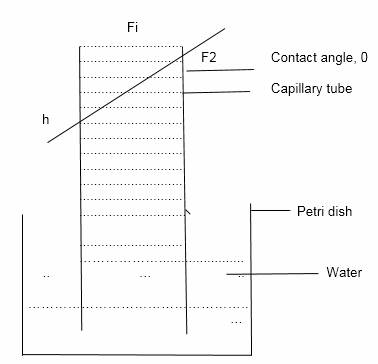
The principle of the capillary rise involves
the use of a clean glass tube which dips and stands vertically in a liquid
which rises in the tube with a radius “r” to a level “h” much above the same
liquid in a containing vessel as shown in Figure 2.
Capillarity is concerned with interfaces that
are sufficiently mobile to assume an equilibrium shape, e.g. meniscuses and
drops formed by liquids in air or in another liquid and thin films such as that
forming a soap bubble. Capillarity occupies a place in the general framework of
thermodynamics, since it deals with the macroscopic and statistical behaviour of interfaces rather than with the details of
their molecular structure [15,16].
Figure 2: An Assembly
for the study of liquid rise, h, in the capillary tube of water.
The
liquid rise is due to the force of surface tension, Fs, against the
downward force of gravity, Fg, such that
at level “h”, the rise, these forces are at equilibrium by the expression:
Fs= Fg(1.1)
This
upward force of surface tension acts along the periphery of the cylindrical
bore with a contact angle, ϴ, between the liquid and the capillary glass
wall [10]].
By
considering the force of surface tension, γ, with ϴ as the contact
angle, we have the expression:
Fs
= 2nry cos ϴ(1.2)
Similarly,
the force of gravity, Fg from the column
of the liquid of height, h, is represented by:
Fg = nr2hpg (1.3)
where
p and g are the density of the liquid and acceleration due to gravity,
respectively. Since these forces are at equilibrium, then
2nry cos ϴ = nr2hpg (1.4)
On
further simplification of equation (1.4) with γ as the subject of the
formula, the expression becomes:
(1.5)
Also,
by further consideration of equation (1.4), with the height “h” attained by the
liquid rise as the subject of the expression:
(1.6)
Equation
(1.6) provides the simple evaluation of γ by the plot h versus 1/r to obtain the slope of the profile
as shown
(1.7)
In
the case of water, the liquid rise wets the capillary tube and assuming that ϴ = 00, therefore,
cos ϴ = 1 asϴ00
Factors Affecting
Surface Tension
The magnitude of surface tension is affected
by many factors which either decrease its effects or in limited cases improve
on its effects on liquid surfaces. These factors are: (i)
Temperature (ii) Solute (iii) Contact angle (iv) Films (v) Miscelles
formation.
Effects
of Contact Angle, ϴ of a Liquid
Thecontact
angle, ϴ,which liquids
make with surfaces has greatest significance towards the preparation of the
liquid on surfaces. Apart from its values, the influence of contact angle
determines the degree of wetting of the said liquid on the surface and the
extent of spreading.
The contact angle, ϴ,of a liquid is that angle that a
liquid makes between the surface of a solid and the liquid. The liquid makes
this contact angle with the tube and the value of that determines the extent of
rise in the tube. The ultimate rise of a liquid means that the force of
adhesion must be greater than the force of cohesion. By this phenomenon, the
wetting of a liquid gives a tendency for the spreading of the liquid on the
solid surface.
Wetting
of Liquid on Surface
Generally, wetting occurs when the mutual
attraction between the molecules of the solid and the molecules of the liquid
is stronger than the forces of cohesion within the molecules of the liquid.
This principle is often described with the range of contact, ϴ0< ϴ < 900. Therefore,
within this range of ϴ the
liquid wets the surface of either a solid/liquid or liquid/liquid surface.
Non-Wetting
of Liquid on Surface
In the same token, non-wetting occurs when
the mutual attraction between the molecules of the liquid is stronger than that
between them and the molecules of the solid surface. Again, with respect to the
values of contact angle, the range 900> ϴ<1800indicates
that the liquid will not wet the surface.
Surfactants
These are surface-active agents that act
between two phases [5,6,11,18]. They can be grouped as either soaps or
detergents which are active at the space between hydrocarbon (hydrophobic) and
hydrophilic phases. A detergent acts at the interface, and modifies the surface
tension by lowering it.
Some compounds while
in an aqueous solution have the whole of them m inside the solution, i.e. both
their hydrophilic and hydrophobic parts or ends are well within the aqueous
solvent, e.g. strong electrolytes, sugar, glucose, sucrose, aminobenzoic
acids. Some other compounds have their hydrophobic end – CH2 – CH2
– on the surface of the aqueous solvent, e.g. inorganic salts and organic acids
of low molecular mass, their hydrophilic ends (-OH) are very much inside the
solvent. These are the surfactants such as soaps and detergents. Also, an
organic compound such as amphiphilic surfactant with two hydrophobic ends and
hydrophilic middle atom e.g. 2-Aminoethan-1-o1 (NH2-CH2
CH2-OH) anchors on the liquid or solvent. These surface-active and
surface-inactive substances produce varying effects on the surface tension of
liquids as follows:
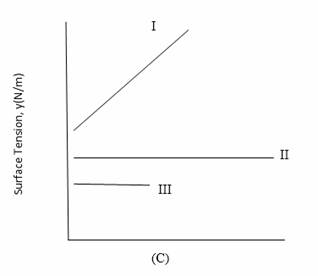
Case I increase the
surface tension with an increase in the concentration of the solute such as
sugar, glucose, etc in Figure 1.6. Case II decreases
fairly the surface tension with an increase in the concentration of the solute,
while Case IIIdecreases the surface tension the more with an increase in the
concentration of the solute such as soaps and detergents.
Figure 3 below is a graph that illustrates
the three different cases I, II and III describes various behaviour
of solutes.
Fig. 3:The variation of surface tension with types
of solute concentrations, for surface-inactive, I, fairly active, II, and
surfactants, III.
The
surface tension of aqueous solutions is generally close to that of pure water
if the solutes are salts such as NaCI or sucrose and
other substances that do not preferentially collect at the air-water interface.
On the other hand, a dramatic decrease in surface tension can result if the
dissolved substance is a fatty acid or a lipid. These molecules consist of two
regions: at one end, a polar group such as – COOH, which is hydrophilic
(water-liking) at the other end, A long hydrocarbon
chain that is non-polar and is therefore hydrophobic (water-hating). The
non-polar groups tend to line up together along the surface of water with the
polar group pointing towards the interior of the solution. Consequently,
surface tension decreases. Any substance
that causes a reduction in surface tension in this manner is called a
“surfactant” [7,8,9,14].
The surface tension, or the surface free
energy, is just (dG/dA)T.P;where
A is the surface area. Substances that lower the surface tension also lower the
free energy of the surface; they preferentially migrate to the surface. Thus,
substances that lower the surface tension concentrate at the surface, and give
large decreases in surface tension, but substances that raise the surface
tension avoid surface and give only small increase in surface tension. The
quantitative expression for this is called the Gibbs Adsorption Isotherm:
Γ
=-1
dγ/RT dlna
R
=-1
dγ/RT dInc(1.8)
where;
R
= adsorption (excess concentration) of solute at the surface, mol m-2
Γ
= Surface tension, Nm-1
R
= gas constant = 8.314k-1 mil-1
a
= activity of solute in bulk solution
c
=concentration
of solute in bulk solution (any unit can be used).
The
sign of the excess surface concentration, Г, is opposite to the sign of
the change of the surface tension with concentration (or activity) of solute in
the solution.
METHODOLOGY
Chemical
and Reagents
Chemical
The only solid chemical used in this work was
sodium hydroxide pellets which were sourced locally and used to prepare 2.5
molar solution with distilled water. This stock solution was stored in 5L
Winchester bottle for use in the cleaning of the capillary tubes, rinsed in
distilled water and dried in an oven at 105o prior to use.
Reagents
The underlisted
organic reagents were commercially sourced from the local chemical vendors at Ogbete main market, Enugu; Ethane 1, 2-diol, 2-Aminoethan-1-1,
Ethane – 1, 2 – diamine and
Distilled water (obtained from the
laboratory).
Determination
of the Physical Properties of the Reagents
The physical properties of the reagents (i) Refractive index (ii) Specific gravity (iii) appearance
(iv) viscosity (v) Boiling point were determined.
Preparation
of Solutions of the Reagents
The solutions used in this work were prepared
from the reagents listed as follows:
Preparation
of Various Concentrations of Ethane -1,2-diol
The various concentrations of Ethane-1-2-diol
were prepared by pipetting volumes of 0.10,0.25, 0.45, 0.65 and 0.85ml into
25ml of distilled water in 50ml flat-bottom volumetric flask whichwas later made up to 1000ml to obtain the
various concentrations of 7.20, 17.96, 32.32, 46.80, and 61.20 x 10⁻²
mole/litre respectively.
Preparation
of Solutions of 2-Aminoethan -1-o1
Similarly, various concentrations of the
reagent 2-Aminoethan-1-ol were prepared by pipetting the volumes (0.10, 0.25,
0.45, 0.65, and 0.85ml) of the reagent into 25ml of distilled water in a
flat-bottom flask made to 100ml to obtain the concentrations: 6.64, 16.59,
29.86, 43.12 and 58.40 x 10⁻² mole/litre
respectively.
Preparation
of Solutions of Ethane-1,2-diamine
The various volumes of Ethane -1, 3-diamien
were pipette (0.10, 0.25, 0.45, 0.65 and 0.85 ml) into 25ml of distilled water
and topped up to 1000 ml in a flat-bottom volumetric flask to obtain the varied
concentrations: 6.00, 15.00, 26.16, 38.96 and 50.80 mole/litre
respectively.
Determination
of Liquid Rise in Capillary
The experimental measurements of various
liquid rises in the various capillary tubes of specific radii (2.22, 2.86,
3.33, 4.00 and 5.30mm) were achieved using the capillary rise method assembly
in Figure 3.1 for:
i.Distilled
water as the blank
ii.Various
concentrations of ethane-1, 2-diol in distilled water
iii.Various
concentrations of 2-Aminoethan-1-ol in distilled water.
iv.Various
concentrations of Ethane -1, 2-diamine in distilled water.
These methods are described in details as
follows:
Measurement
of the Rise of Distilled Water in the Capillary
After pouring 25ml of distilled water into
the petri-dish with a capillary tube of 2.22mm radius, the rise “h” up of the
water in the capillary tube was allowed to attain the maximum height, h which
was recorded from the bottom of the meniscus. The same process was repeated
separately using capillary tubes of 2.86, 3.33, 4.00 and 5.30mm radii, and the
liquid rise, h recorded for each radius of the capillary tube.
Measurement
of the Rise of Various Concentration of Ethane-1, 2-diol, 2-Aminoethan-1-ol,
and Ethane-1,2-diamine in Distilled Water, respectively.
After pouring an aqueous solution of 0.10ml
ethane-1,2-diol dissolved in25ml of distilled water into the petri-dish with a
capillary tube of 2.22mm radius, the rise “h” up to 0.10ml of Ethane-1,2-diol
in 35ml of distilled water in the capillary tube was allowed to attain the
maximum height h which was recorded at the bottom of the meniscus. The same
process was repeated using capillary tubes of 2.86, 3.33, 4.00 and 5.30mm,
liquid rise, h was recorded for each radius of the capillary tube.
The entire procedure
was repeated using aqueous solutions of 0.25, 0.45, 0.65 and 0.85ml of
ethane-1,2-diol, respectively, and the readings were recorded for each concentration.
Evaluation
of the Values of Surface excess Concentrations, Гi
The values of the surface excess
concentrations for the various organic reagents were obtained from the various
experimental data on the surface tension variation with the concentrations of
the organic reagents from the relation in equation (2.60) in section 2.9 as
restated herein.
dγ=ГRTd In Ci
Evaluation
of the Surface Pressure, ∏ of the
Solutions
The effects of the concentrations of the
organic reagents on the surface pressure of the solvent distilled water were
also evaluated by obtaining the differences in the changes of the surface
tension of the pure solvent (distilled water) and the distilled water/organic
reagents of equation (2.34) of section 2.6 as restated herein:
שּ= γ solvent – γ solution.
Results
of Variations of Water Rise as Blank
The variations of water rise as blank, h(mm)
for the various radii, r x 10-1mm of the varied capillary tubes are
shown in Table 4.4.
Table
4.4: The values of water (blank) rise in radii of capillary tubes
R x 10-3mm
1mm-1
R
H x 10-1mm
5.30
1.88
27.50
4.00
2.50
40.50
3.33
3.00
45.75
2.86
3.50
52.00
2.22
4.50
60.50
Results
of Surface Tension of Water
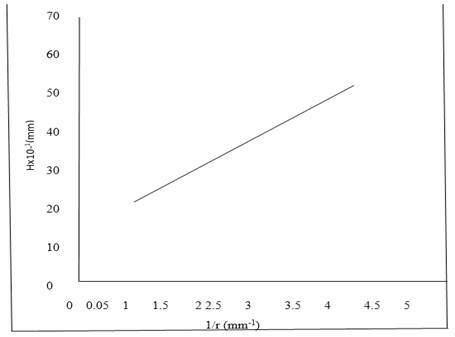
A plot of the values of water rise, h, with
the reciprocal of the radii of the capillary tube (1/r mm-1) is
shown in Figure 4.1. The value of the slope indicates that surface tension of
water (distilled water as blank) is obtained with the value72.40Nm-1.
Figure
4.1: A plot of the capillary rise, h (mm) of distilled water for different
capillary tubes of radii of range 2.22 – 5.30 x 10⁻¹mm).
Figure 4.1 shows that the capillary rise, h
(mm) of distilled water for different capillary tubes has a direct relationship
with the reciprocal of the radii of capillary tube and is inversely
proportional to the radii of capillary tubes.
Capillary
Rise of Solutions of ethane – 1, 2-diol
The values of the capillary rise, h (mm) of
aqueous solutions of Ethane – 1, 2-diol of various concentrations in capillary
tubes of varying radii are shown in Table 4.5.
Table
4.5: The values of capillary rise, h (mm) of solutions of varied concentrations
in mole/dm3 for the various radii of capillary tubes in aqueous
solutions of Ethane-1, 2-diol at 30oC.
R(mm)
1
(mm-1)
R
h (mm) Capillary Rises of Solutions
0.53
1.88
20.25
19.00
16.75
15.00
12.75
0.40
2.50
27.00
25.00
22.00
19.75
16.50
0.33
3.00
32.50
29.80
26.50
23.50
20.00
0.29
3.50
37.75
34.75
30.50
27.0
023.00
0.22
4.50
48.25
44.50
39.50
34.50
29.50
Vol. of solutions (ml)
Conc. Of Solutions (mole/dm3)x
10-2
0.10
0.25xxc
0.45
0.65
0.85
7.20
17.96
32.32
46.80
61.20
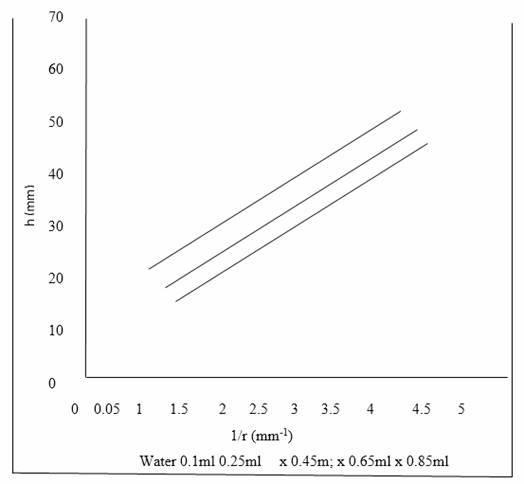
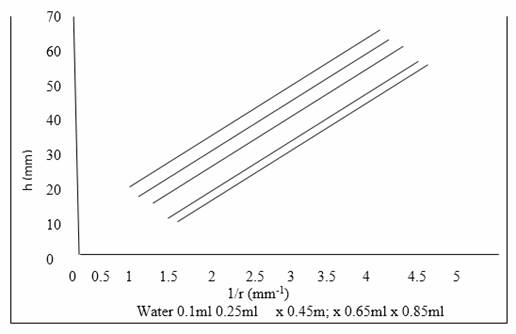
The plots of the capillary rise, h (mm) of
various concentrations of Ethane – 1 , 2-diol for
various radii are shown in Figure 4.2.
Figure
4.2: The profiles of the plots of the capillary rise, h (mm) of various
concentrations in moles/dm3 of Ethane-1, 2-diol in aqueous solutions
at 30oC for various radii of the capillary tubes.
Figure 4.2 shows that the capillary rise, h
(mm) of ethane – 1, 2-diol at different concentrations for different capillary
tubes has a direct relationship with the reciprocal of the radii of the
capillary tubes and is inversely proportional to the radii of capillary tubes.
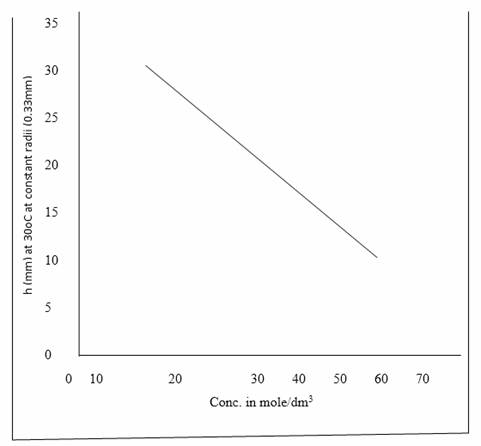
The plots of the
capillary rise, h (mm) with varying concentrations of Ethane-1,2-diol at
constant radius (0.33mm) are shown in Figure 4.3.
Figure
4.3: The plots of the variation of the capillary rise with concentration (C) in
mole/dm3 of the solutions Ethane -1, 2-diol at 30oC at
constant radius (0.33mm).
Figure 4.3 shows that the capillary rise has
an inverse relationship with the various concentrations of Ethane-1, 2-diol at
30oC at constant radius (0.33mm).
4.5Capillary Rise of Solutions of
2-Aminoethan -1-ol
The values of the capillary rise, h (mm) of
aqueous solutions of 2-Aminoethan -1-ol of various concentrations in capillary
tubes of varying radii are shown in Table 4.6.
Table
4.6: The values of capillary rise, h (mm) for various radii of the capillary
tubes in concentrations (C) in mole/dm3 of 2-Amonoethan – 1-ol in
aqueous solutions at 30oC.
R(mm)
1 (mm-1)
R
H(mm)
Capillary Rises of Solutions
0.53
1.88
23.00
22.00
19.88
18.38
16.63
0.40
2.50
30.00
28.50
26.50
24.00
22.00
0.33
3.00
35.75
33.75
31.75
29.00
26.50
0.29
3.50
41.80
39.50
3675
34.00
30.80
0.22
4.50
54.00
50.75
47.13
43.00
39.13
Vol. of solutions (ml)
Conc. Of solutions (mole/dm3) X
10-2
0.10
0.25
0.45
0.65
0.85
6.64
16.59
29.86
43.12
56.40
Theplots
of the capillary rise, h (mm)of various concentrations fo
2-Aminoethan-1-o; for various radii are shown in figure 4.4
Figure
4.4: The profiles of the plots of the capillary rise, h (mm) of various
concentrations (C) in mole/dm3 of 2-Aminoethan-1-ol in aqueous
solutions at 30oC for various radii of the capillary tubes.
Figure 4.4 shows that the concentrations for
different capillary rise, h (mm) of 2-Aminoethan-1-ol at different
concentrations for different capillary tubes has a direct relationship with
thereciprocal of the radii of the
capillary tubes and is inversely proportional to the radii of capillary tubes.
The plots of the
capillary rise, h (mm) with varying concentrations of 2-Aminoethan-1-ol at
constant radius (0.33mm) is shown in figure 4.5.
Figure
4.5: The plots of the variation of the capillary rise, h (mm) versus
concentrations (C) in mole/dm3 of the solutions 2-Aminoethan-1-olin
aqueous solution at 30oC at constant radius (0.33 mm).
Figure 4.5 shows that the capillary rise has
an inverse relationship with the various concentrations of 2-Aminoethan-1-ol at
30oC at constant radius (0.33 mm).
Capillary
Rise of Solutions of Ethane – 1, 2-diamine
The values of the capillary rise, h (mm) of
aqueous solutions of Ethane – 1, 2-diamine of various concentrations in
capillary tubes of varying radii are shown in Table 4.7.
Table
4.7: The values of capillary rise, h (mm) of varied concentrations (C) in
mole/dm3 of Ethane-1, 2-diamine for different radii of the capillary
tubes in aqueous solutions at 30oC.
R(mm)
1 (mm-1)
R
H(mm)
Capillary Rises of Solutions
0.53
1.88
25.00
24.00
23.00
21.75
20.50
0.40
2.50
33.00
31.50
30.75
28.75
27.00
0.33
3.00
39.75
38.00
36.50
34.50
32.50
0.29
3.50
46.50
44.25
42.25
40.00
37.75
0.22
4.50
60.00
57.00
54.75
51.50
48.75
Vol. of solutions (ml)
Conc. Of solutions (mole/dm3) X
10-2
0.10
0.25
0.45
0.65
0.85
6.00
15.00
26.96
38.96
50.80
The plots of the capillary rise, h (mm) of
various concentrations of Ethane-1, 2-diamine for various radii are shown in
figure 4.6.
Figure
4:6: The profiles of the plots of the capillary rise, h (mm) of various
concentrations (C) in mole/dm3 of Ethane-1-2-diamine in aqueous
solutions at 30oC.
Figure 4.6: shows that the capillary rise, h
(mm) of Ethane-1, 2-diamine at different concentrations for different tubes has
a direct relationship with the reciprocal of the radii of the capillary tubes
and is inversely proportional to the radii of capillary tubes.
The plots of the
capillary rise, h (mm) with varying concentrations of Ethane-1, 2-diamine at constant
radii (0.33mm) are shown in figure 4.7.
Figure
4.7: The plots of the variations of the capillary rise, h (mm) versus
concentrations (C) in mole/dm3 of Ethane-1, 2-diamine in an aqueous
solution at 30oC at constant radius (0.33 mm).
Figure 4.7 shows that the capillary rise has
an inverse relationship with the various concentrations of Ethane -1, 2-diamine
at 30oC at constant radius (0.33 mm).
The comparative
profiles of the capillary rise, h (mm) of varying concentrations of the
surfactants ethane – 1, 2-diol, 2-Aminoethan -1-ol and ethane-1, 2-diamine at
constant radius.
Figure
4.8: The comparative profiles of the variation of capillary rise, h (mm) with
various concentrations of the surfactants, namely; ∆ Ethane – 1, 2 –
diol, c 2 –
Aminoethan-1-ol andEthane-1,
2-diamine in aqueous solution at 30oC at constant radius (0.33 mm).
The comparative profile shows that Ethane -1,
2-diol has the lowest rise, while Ethane -1, 2-diamine has the highest rise.
Changes
in Surface Tension with Changes in Concentration of Ethane-1, 2-diol,
2-Aminoethan-1-ol and Ethane-1,2-diaminee.
The values of the surface tension, changes in
surface tension, concentrations and changes in concentration for Ethane-1,
2-diol, 2-Aminoethan-1, 2-diamine, respectively.
The values of the
surface tension and its changes as well as the concentrations and their changes
for Ethane-1, 2-diol are shown in Table 4.8.
Table
4.8: The values of γ, dγ, (C) and d In C
for Ethane -1, 2-diol.
Y (Nm-1)
Dy(Nm-1)
(c) x 10-2 mole/dm3
ln c
d ln C
52.60
19.890
7.20
-2.6311
-
48.70
23.70
17.96
-1.7170
0.9141
43.10
29.30
32.32
-1.1295
0.5875
37.05
34.35
46.80
-0.7593
0.3702
32.35
40.05
61.20
-0.4910
0.2683
Calculation
γH20=72.40 Nm
The values of the surface tension and its
changes as well as the concentrations and their changes for 2-Aminoethan-1-ol
are shown in table 4.9.
Table
4.0: The values of Y, dY, (C) and d ln C for
2-Aminoethan-1-ol.
Y(Nm-1)
dY(Nm-1)
(C) x10-2 mole/dm3
Ln C
d ln C
59.50
12.90
6.64
-27121
-
55.15
17.25
16.59
-1.7964
0.9157
52.60
19.80
29.86
-1.2087
0.5877
48.55
23.85
43.12
-0.8411
0.3676
44.40
28.00
56.40
-0.5727
0.2684
The values of the surface tension and its
changes as well as the concentrations and their changes for Ethane-1,2-diamine
are shown in table 4.10.
Table
4.10: The values of Y, dy, (C) and dlnC for Ethane-1, 2-diamine
Y(Nm-1)
dY(Nm-1)
(C) x10-2 mole/dm3
Ln C
d ln C
66.40
6.00
6.00
-2.8134
-
62.25
10.15
15.00
-1.8971
0.9163
59.91
12.49
26.96
-1.3108
0.5863
57.76
14.64
38.96
-0.9426
0.3682
54.30
18.00
50.80
-0.6773
0.2653
The comparative profiles of the changes in concentrations
of the surfactants Ethane -1, 2-diol, 2-Aminoethan-1-o1 and Ethane-1, 2-diamine
are shown in figure 4.9.
Figure:
4:9: The comparative profiles of the differences in surface tensions against
the changes in concentrations of the surfactants, namely: Ethane – 1, 2-diol,
2-Aminoethan -1-o1 and Ethane -1, 2-diamin, in aqueous solutions.
The comparative profile of the changes in
surface tension with changes in concentration of the surfactants show that
Ethane -1, 2-diol has the highest while Ethane -1, 2-diamine has the lowest
surface excess concentrations.
Calculation
of the Surface Excess Concentration
The surface excess concentration, was
calculated using the formula:
dy=
ГRT dlnC
=ГRT
- r = -slope / RT
r=-slope / -RT
R = 8.314 Joules/mol/K
T = 25oC = 298k
RT = (8.314) (298k) – 207.85.
Ethane-1,2-diol
N/m
=
10.75
-0.32
=
-33.59N/m
=
0.1616 mol/m2
= 16.20
x 10-2mol/m2
2-Aminoethan-1-ol
=
= -25.65N/m
r = -25.63 / -207.85
=
0.1233 mol/m2
=12.33
x 10-2mol/m2
Ethane
-1, 2-diamine
N/m
=5.51
-0.32
=-17.22N/m
r
= -(17.22)
-207.85
=0.0828mol/m2
=8.28 x 10⁻²mol/m2
The values of the surface excess
concentration obtained for Ethane – 1,2 – diol, 2 – Aminoethan -1-o1 and Ethane -1, 2-diamine are shown in
table 4.11.
Table
4.11: The values of the surface excess concentration for Ethane – 1, 2-diol,
2-Aminoethan -1-o1 and Ethane – 1, 2-diamine.
Surfactants (C)
Surface excess Concentration, Г
(mole/m2)
HO-CH2-CH2-OH
16.20 x 10⁻²
Ethane-1, 2-diol
HO-CH2-CH2-NH2
12.33 x 10⁻²
2-Aminoethan-1-ol
H2N-CH2-CH2-NH2
8.28 x 10⁻²
Ethane -1, 2-diamine
Surface coverage or occlusion is in the
order: NH2-CH2-NH2<OH-CH2-CH2-NH2<OH-CH2-CH2-OH
Or
OH-CH2-CH2-OH>OH-CH2-CH2-NH2>NH2-CH2-CH2-NH
RESULTS
AND DISCUSSION
The
purity of the reagents used in this research has been certified by the results
in Tables 4.1, 4.2 and 4.3 which are in concordance with the commercial grade.
The results in table
4.4 show that the rise of water, h (mm), in the capillary tubes increases with
a decrease in the radii of the capillary tubes. Aplot of the values of h (mm) with the
reciprocals of the radii, 1 (mm-1)of the capillary tubes is a straight line (Figure
4.1), the slope of which was utilized in equation (1.5) to obtain the surface
tension, Y (Nm -1) of distilled water as blank with the value of
72.40Nm-1
The results in Tables
4,5, 4,6, and 4.7 show that the values of the capillary rise, h (mm) of varying
concentrations, (C) in mole/dm3 of the surfactants: Ethane-1,
2-diol, 2-Aminoethan-1-ol and Ethane-1, 2-diamine in aqueous solutions are
consistent with the characteristics of water, but this time with lower values
of h (mm). The plots of the values of the capillary rise, h (mm) of various
concentrations (C) in mole/dm3 of aqueous solutions of the
surfactants with the reciprocals of the radius, 1 (mm-1) of the capillary tubes are
straight lines (Figures 4.2, 4.4 and 4.6 respectively, the slopes of which were
utilized in equation (1.5) to obtain the values of the surface tensions of
Ethane-1, 2-diol (52.60,48.70, 43.10, 37.05 and 32.35 Nm-1),
2-Aminoethan-1-ol (59.50, 55,15, 52.60, 48.50 and 44.40Nm-1) and
Ethane-1, 2-diamine (66.40, 62.25, 59.91, 57.76 and 54.31 Nm-1)
respectively. The trend of the values of surface tension, Y (Nm-1)
is observed from the results to be as follows: Ethane -1, 2-diol < 2-Aminoethan-1-ol
< ethane-1, 3-diamine. The lower the surface tension seems to indicate that
the surface coverage of ethane-1, 2-diol > 2-Aminoethan—1-ol > Ethane-1,
2-diamine.
Figures 4.3, 4.5 and
4.7 which depict the plots of the variations of h(mm) with the concentrations
(C) in mole/dm3)of the solutions of Ethane-1, 2-diol,
2-Aminoethan-1-ol and Ethane-1, 2-diamine, respectively, at a constant radii
(0.33 mm) confirm the effectiveness of these surfactants in the lowering of
surface tension due to surface coverage. This is shown in Figure 4.8 which
illustrates the comparative profiles of the variation of capillary rises, h,
with various concentrations of the surfactants. The trend is as follows:
Ethane-1, 3-diol < 2-Aminoethan-1-ol < Ethane-1, 2-diamine.
Using Tables 4.8, 4.9
and 4.10, the plots of the differences in the surface tensions (dṿ) with the differences in the logarithms of the
concentrations (dlnC) were achieved, as illustrated
in figure 4.9, for each of the three surfactants, with the trend Ethane-1,
2-diol > 2-Aminoethan-1-ol > Ethane- 1, 2-diamine. The slopes obtained
were used to determine the values of the surface excess concentration, Г
(mole/m2) of the surfactants according to equation (2.60). By their
values, 16.20 x 10⁻², 12.33 x 10⁻², and 8.28 x 10⁻²
mole/m2 for Ethane-1, 2-diol, 2-Aminoethan-1-ol and Ethane-1,
2-diamine respectively, Г for Ethane-1, 2-diol > 2-Aminoethan-1-ol
> Ethane 1, 2-diamine. This trend of the surface excess concentrations,
Г (mole/m2) suggests a drastic lowering of surface tension of
water by the same order of activity. Also, the efficacy of Ethane-1, 2-diol in
a commanding lead as an effective amphiphilic surfactant among the groups such
by its configuration remains longer at cis-configuration, while 2-Aminoethan-1-ol
and ethane 1, 2-diamine remain much longer at trans-configuration. These
preferences of geometric configuration stability of trans – and cis – suggest
the effectiveness of surface coverage have been used herein to explain the
effective surface coverage, and, in consequence, the lowering of surface
tension by the large values of surface excess concentration of these
amphiphilic surfactants.
CONCLUSION
In considering these surfactants, one can
conclude that they are good where they can be used for minimizing the
volatility of the perfume by anchoring on the surface of the solvent. In the
case of detergents, they can be used to lower the surface tension of water to
bring about the union between water and fabric.The surfactants ethane-1,
2-diol, 2-Aminoethan-1-ol and ethane-1, 2-diamine derived from organic
compounds are found in this work to lower the surface tension of water by
having their hydrophobic ends on water surface, thereby imparting a film which
acts as a masking agent. Therefore, the findings of this work show that these
surfactants have proven to be effective surface suppressants of volatile
solutes in aqueous solution. These suppressants are used in perfume industry as
well as agro-allied industries in their application as masking agents for
insecticides, fungicides and other aerosols.
REFERENCES.
1.Atkins P.W, (2001), Elements of Physical Chemistry,
Oxford University Press, 3rd edition, New York :
405-407.
2.Chang, R. (2002),
Physical Chemistry, with Applications to Biological Systems, 3rd
ed., Macmillan Publishing Company. Incorporation NY : 59-62.
3.Chataraj, D.K. Birdi, K.S., Kalder, K., Das,
K.P. and Mitra, A. (2006). Surface activity
coefficients of spread monolayaers of behenic acid salts at air-water interface. Adv. Colloid Interface Sci. 151: 123-126.
4.Engel, T. and Reid, P. (2005), Physical Chemistry, 3rded, Pearson NY U.S.A; pp. 182-184.
5.Holmberg. K., Jonsson, B.,
Kornberg. B. and Lindman, B. (2003), “Surfactants and
Polymers in aqueous solution”, 2nd edition. John Wiley & Sons,
Inc. New York.. 121-124.
6.Jean-Louis, S. (2002), “Surfactants types and uses,
teaching aid in surfactant science and engineering in English, Version II,
Merida-Venezuela.
7.Lu, J.R. Thomas, R.K. and Penfold,
J. (2000). Adv. Colloid Interface sci. 84: 143-304.
8.Moroi, Y. Rusdi, M. and Kubo, I. (2004). J.Physic.
Chem. B., 108: 6351-6358.
9.Moroi, Y. Yamabe, T. Shibata, O. and Abe, Y. (2000), Langmuir, 16:
9697-9698.
10.Onuchukwu, A. I. (2006),
chemistry of surface and Colloid, Ambix Printers
Nigeria, pp. 1-17.
11.Rosen, J.M. (2004), Surfactants and
Interfacial Phenomena. 3 New York: Wiley.
12.Sharma, K.K. and
Sharma L.K. (2004), A Textbook of Physical Chemistry, 4th Ed, Vikas Publishing House PVT Ltd New Delhi: 78-85.
13.Sharma, K.K. and Sharma
L.K. (2004), A Textbook of Physical Chemistry, 4th Ed, Vikas Publishing House PVT Ltd :
605-606.
14.Silbey, R.J., Alberty, R.A, and Bawendi, M/G.
(2006), Physical Chemistry, 4th ed. Wiley and sons Inc, India (New Delhi): 843.
15.Tharwat, F., F. Th, (2009). “Colloids in Agrochemicals”, Journal of Colloids
and Interface Science. 5: 14.
16.Tincoco, I. (Jr.), Saver,K., Wang, J. And Puglisi,
J.D. (2002). Physical Chemistry Principles and Applications in Biological
Sciences, 3rd Ed; Pearson Education International New Jersey:.218-224.
17.Yamabe, T. Moroi, Y. Abe, Y. And Takahashi, T. (2000), Langmuir 16:
9754-9758.
18.Zdziennicka, A. and Janczuk. B. (2010). Behaviour of
cationic surfactants and short chain alcohols in mixed surface layers at
water-air and polymer-water interfaces with regard to polymer wettability. I.
Adsorption at water-air interface. J.
Colloid Interface sc. 349: 374-383.
Cite this Article:Okonkwo, NA; Onuchukwu, AI; Ikeh, OA; Anarado, IL; Ejidike, LC (2024). A Study of the Surface Excess
Concentrations of Some Surfactants in an Aqueous Medium. Greener Journal of
Physical Sciences, 10(1): 1-16.